

Abstract
We tested the hypothesis that the time course of the evolution of antifungal drug resistance depends on the ploidy of the fungus. The experiments were designed to measure the initial response to the selection imposed by the antifungal drug fluconazole up to and including the fixation of the first resistance mutation in populations of Saccharomyces cerevisiae. Under conditions of low drug concentration, mutations in the genes PDR1 and PDR3, which regulate the ABC transporters implicated in resistance to fluconazole, are favored. In this environment, diploid populations of defined size consistently became fixed for a resistance mutation sooner than haploid populations. Experiments manipulating population sizes showed that this advantage of diploids was due to increased mutation availability relative to that of haploids; in effect, diploids have twice the number of mutational targets as haploids and hence have a reduced waiting time for mutations to occur. Under conditions of high drug concentration, recessive mutations in ERG3, which result in resistance through altered sterol synthesis, are favored. In this environment, haploids consistently achieved resistance much sooner than diploids. When 29 haploid and 29 diploid populations were evolved for 100 generations in low drug concentration, the mutations fixed in diploid populations were all dominant, while the mutations fixed in haploid populations were either recessive (16 populations) or dominant (13 populations). Further, the spectrum of the 53 nonsynonymous mutations identified at the sequence level was different between haploids and diploids. These results fit existing theory on the relative abilities of haploids and diploids to adapt and suggest that the ploidy of the fungal pathogen has a strong impact on the evolution of fluconazole resistance.
THE predicted advantages and disadvantages of haploidy and diploidy, like those of recombination (Kondrashov 1993), hinge on the ability of populations (a) to cope with deleterious mutation (Kondrashov and Crow 1991) and (b) to adapt to new environments (Orr and Otto 1994). Our goal in this study was to make a direct comparison of ploidy states by measuring the relative abilities of isogenic haploids and diploids of the yeast Saccharomyces cerevisiae to adapt to the presence of the antifungal drug fluconazole (FLC). We followed the initial, rather than the long-term, responses of haploid and diploid populations to pinpoint the relative advantages and disadvantages of each of the two ploidy states in adaptation and to minimize the potentially confounding effects of the genetic divergence that may accumulate with long-term evolution. Antifungal drug resistance is an excellent model for adaptation because the fitness increments with each mutation are large (Anderson et al. 2003), the underlying molecular mechanisms are well documented (Sanglard et al. 1998; White et al. 1998; Lupetti et al. 2002; Sanglard and Odds 2002), the mutations can be readily mapped to the gene and nucleotide site, and their level of dominance can be measured directly.
Two factors are preeminent in determining the effect of ploidy on the rate of adaptation (Orr and Otto 1994): the waiting time for mutations to appear and the fixation time required for mutations to spread to high frequency in a population in response to directional selection. Under conditions of finite population size where the waiting time for beneficial mutations is the rate-limiting step in adaptation, diploids should, at first glance, have the faster rate of adaptation. This is because diploids have twice the number of targets for mutations, resulting in a higher frequency of mutations conferring increased fitness. This advantage for diploids, however, accrues only when the mutations are sufficiently dominant in their effect on phenotype. Where the mutations are recessive, haploids should have the advantage because the fixation time, rather than the waiting time, is the rate-limiting step. Under these conditions, haploids that are hemizygous for beneficial mutations respond more efficiently to selection than diploids that are heterozygous for mutations.
In a previous study, we showed that drug concentration determines which kinds of FLC-resistance mutations are favored in S. cerevisiae (Anderson et al. 2003). At low drug concentrations (16 μg/ml), mutations in PDR1, one of two regulators of the ABC transporters (the other is PDR3, see below), are common in replicate populations. These mutations raise the minimum inhibitory concentration (MIC) for FLC only to intermediate levels (MIC 64 μg/ml) and are dominant, at least in drug concentrations below the MIC. When the drug concentration is raised in several increments, populations with mutations in PDR1 become fixed for mutations in a second gene, as yet unidentified, to reach the highest measurable level of resistance (MIC 256 μg/ml). This ordered succession of mutations was observed in parallel in three different populations. Interestingly, the PDR1 mutations, the first to occur in this series, carry a large fitness cost at the highest drug concentrations where, for unknown reasons, their reproductive output is reduced compared to that of wild-type, drug-sensitive populations. The wild types retain a residual ability to reproduce at all drug concentrations and this ability is nearly abolished in the PDR1 mutants. Because of this fitness deficit, strains carrying PDR1 mutations that are suddenly placed in high drug concentrations (64 or 128 μg/ml) usually become extinct in serially transferred batch culture (data not shown).
In contrast, when populations of wild-type, drug-sensitive cells are abruptly subjected to a high drug concentration, mutations raising the MIC to the highest level become fixed in one step. The favored mutations in these situations map to ERG3 and are recessive. This evolutionary system, in which different kinds of mutations have different levels of dominance that are favored in different environments, offers an opportunity to test the predictions of Orr and Otto (1994).
The specific goals of this study were (a) to test the relative advantages of haploids and diploids under a range of drug concentrations at which different drug-resistance mutations with different levels of dominance are favored and (b) to compare the distribution and dominance of mutations within the PDR1 and PDR3 genes favored in haploid and diploid populations exposed to a low drug concentration.
MATERIALS AND METHODS
Strains and growth conditions:
To allow comparison of haploidy with diploidy and to exclude any possible effect of mating type on the evolution of FLC resistance, isogenic haploid MATa and MATα and diploid MATa/α, MATα/α, and MATa/a strains from the study of Anderson et al. (2003) were used; these strains were all URA3Δ::KANMX4 and were derivatives of S288C. All cultures were maintained in liquid, half-strength yeast peptone dextrose (0.5× YPD) medium on an orbital shaker at 30°. Archives were maintained in 15% glycerol at −80°. Subcultures from all experiments described below are available on request.
In addition, diploid strains carrying replacements at PDR1 and PDR3 by the KanMX4 cassette were constructed for control experiments. The initial haploid deletion strains from the yeast knockout collection were MATa his3Δ1 leu2Δ0 met15Δ0 ura3Δ0. These were crossed with an otherwise isogenic MATα ura3 strain. From the progeny, haploid strains of compatible mating types with ura3, but none of the other auxotrophies, were crossed to form two strains that were PDR1/PDR1 PDR3/PDR3 and two that were PDR1/PDR1Δ PDR3/PDR3Δ. Further, the two diploid strains that were heterozygous for deletions at PDR1 and PDR3 were allowed to sporulate and nonparental ditype tetrads segregating 2:2 for resistance to G418 were identified; double mutants (PDR1Δ PDR3Δ) of compatible mating types were crossed to form two diploid strains that were PDR1Δ/PDR1Δ PDR3Δ/PDR3Δ.
MIC tests:
MIC assays were in 96-well microtiter plates with 0.2 ml of 0.5× YPD and 0, 16, 32, 64, 128, and 256 μg/ml FLC as described by Anderson et al. (2003). Cell densities were measured in 24-hr-old, 10-ml cultures. From these cultures, ∼103 cells, or fewer, were inoculated to each test well. The plates were scored by the unaided eye with backlighting against a dark surface at 48 hr; the lowest drug concentration at which growth was reduced by twofold or greater was read as the MIC. Each MIC determination was repeated at least once.
Short-term evolution experiments:
These experiments were designed to measure the initial response of populations to selection imposed by the drug so that haploids and diploids could be compared on a level playing field, with no subsequent dilution or batch transfer. Each replicate culture consisted of 50 ml of medium with FLC at 16, 32, 64, or 128 μg/ml that was inoculated with 5 × 10⁴ cells from a 10-ml culture that was 24 hr old. Because progenitor cells maintain the residual ability to undergo seven to nine doublings at 32 μg/ml FLC and higher (Anderson et al. 2003), the basal population size of both haploids and diploids was expected to reach 107–108 even without resistance mutations. The optical density at 600 nm (OD600) of these cultures was monitored at 1, 2, 3, 4, 5, and 9 days after inoculation. Whenever cultures reached high densities of ∼108 cells/ml after several days, this represented ∼22 generations. For all populations, including those that remained at low density after 5 days, the MIC of FLC was assayed for three single-colony isolates.
To show that this increase in density was due to adaptation as a function of population size and mutation and not merely to growth, control cultures were inoculated with 10–20 cells each. In medium without drug, these control cultures invariably grew to high density within 24–48 hr. Control cultures in 32, 64, and 128 μg/ml FLC never increased in cell density. At 16 μg/ml FLC, however, control cultures reached high densities after several days. This was expected because 16 μg/ml is near the MIC of FLC of the wild-type progenitor cells, which routinely undergo almost as many doublings as in medium without drug. Even at 16 μg/ml FLC, however, resistance mutations appeared and proliferated (see results).
Gene expression:
As an indication of the two main kinds of resistance expected, expression of two genes, PDR5 and ERG11, was monitored in experimental cultures at day 5 and in some cases at day 9. Overexpression of PDR5 is expected with resistance mutations in the regulatory genes PDR1 and PDR3, while overexpression of ERG11 is expected with loss of function at ERG3. Three single-colony isolates from each replicate culture, the same cultures used to determine the MIC of FLC, were grown to midlog phase in the absence of FLC and RNA was extracted exactly as described by Anderson et al. (2003). Northern blots, probes, hybridization, and phosphor-imagery were also as described by Anderson et al. (2003). As before, YEF3 was the internal standard for gene expression and the expression values of each evolved strain were relative to its respective progenitor. Detailed genetic characterization of the mutations was reserved for the next round of experiments described below.
Replicate populations in 16 μg/ml FLC:
To compare the spectrum of mutations fixed by haploids and diploids, 29 replicate populations of the MATa haploid and 29 replicated of the MATa/α diploid were established in 1 ml of 0.5× YPD. These cultures were batch transferred daily at a dilution rate of 1:10 for the first 50 generations. This dilution rate has been shown to be optimal for the fixation of mutations conferring adaptive advantage in a given environment (Wahl and Krakauer 2000). Cultures were then batch transferred at a dilution rate of 1:100 for the next 50 generations. For the first few transfers after their establishment, the maximum density of the batch cultures with FLC was reduced 30–50%, relative to the density in control populations without the drug. In all populations with FLC, maximum density then recovered to near the levels in the controls without FLC. At the end of 100 generations, a single-colony isolate was recovered from each population and archived for further analysis.
The 29 diploid cultures evolved with FLC were allowed to sporulate and three to five tetrads were dissected for each. All tetrads segregated for lower MIC (16 μg/ml)/higher MIC (64 or 32 μg/ml), consistent with a single mutation for resistance heterozygous with the wild type. A MATa progeny strain of higher MIC was selected for further tests. From the 29 haploid populations evolved with FLC, single-colony isolates (also MATa) were also subjected to the same tests.
To measure the dominance of the mutations, haploid MATa strains derived from the 29 diploid and 29 haploid populations after 100 generations in 16 mg/ml FLC were mated with a drug-sensitive, MATα strain carrying a complementary auxotrophy. Diploids heterozygous for the resistance mutation were selected and assayed for MIC of FLC (Table 1). These tests included wells with 16 μg/ml FLC, the same environment in which the 58 mutations were originally fixed. On the basis of earlier observations, the MICs of haploid strains were assumed to reflect the MIC of diploids homozygous for the resistance mutation. Dominance levels at 16 μg/ml FLC were binary. Strains carrying a dominant mutation grew to maximum density (estimated as ∼13 doublings from measurements of initial and final population size) at 16 mg/ml FLC both (a) when the mutation was hemizygous in a haploid background and (b) when the same mutation was heterozygous with the progenitor allele in a diploid background; all of these strains had MICs >16 μg/ml. In contrast, strains carrying a recessive mutation grew to maximum density at 16 mg/ml FLC only when the mutation was hemizygous in a haploid background; these strains all had MICs >16 μg/ml. When the same recessive mutation was heterozygous with the progenitor allele in a diploid background, these strains grew poorly (∼7–9 doublings) and all registered MICs of 16 μg/ml.
TABLE 1.
Distribution of mutations fixed in haploid and diploid populations ofS. cerevisiae after 100 generations in 16 μg/ml FLC
| Haploid
|
Diploid
|
|||||||
|---|---|---|---|---|---|---|---|---|
| MIC
| ||||||||
| MIC:a Haploid |
MIC: Diploid |
Geneticb | Mutation | Diploid | Haploid | Diploid | Genetic | Mutation |
| PDR1 N terminus | ||||||||
| 64 | 32 | PDR1 | G866A Arg289Ile | 32 | 64 | 32 | —c | G844T Gly282Cys |
| 32 | 16 | PDR1 | C893T Pro298Leud | 64 | 64 | 64 | PDR1 | G906T Lys302Asn |
| 64 | 64 | PDR1 | G924T Met308Ile | 32 | 64 | 32 | PDR1 | G906T Lys302Asn |
| 64 | 64 | 64 | — | T926C Leu309Val | ||||
| PDR1 C terminus | ||||||||
| 64 | 16 | — | T2215A Phe739Iled | 64 | 64 | 64 | — | T2246C Phe749Ser |
| 64 | 32 | — | T2215A Phe739Ile | 32 | 64 | 32 | Not PDR3 | T2444C Phe815Ser |
| 64 | 64 | PDR1 | T2246C Phe749Ser | 32 | 64 | 32 | — | C2461T Arg821Leu |
| 64 | 32 | — | C2258G Ser753Cys | 64 | 64 | 64 | — | C2461A Arg821Ser |
| 64 | 32 | — | C2250A Thr817Lys | 32 | 64 | 32 | PDR1 | G3125A Gly1042Glu |
| 64 | 64 | PDR1 | G2462A Arg821His | |||||
| 64 | 16 | PDR1 | G2620T Asp874Tyrd | |||||
| 64 | 32 | PDR1 | A2635G Tyr879Ala | |||||
| PDR3 N terminus | ||||||||
| 64 | 16 | PDR3 | G758A Gly253Vald | 32 | 64 | 32 | PDR3 | G844T Val282Phe |
| 32 | 16 | Not PDR1 | G758A Gly253Vald | |||||
| 64 | 16 | PDR3 | G758A Gly253Vald | |||||
| 64 | 16 | PDR3 | G758A Gly253Vald | |||||
| PDR3 C terminus | ||||||||
| 64 | 16 | PDR3 | G2120T Cys707Phed | 32 | 64 | 32 | PDR3 | G2860T Val954Phe |
| 64 | 16 | — | G2120T Cys707Phed | 32 | 64 | 32 | PDR3 | G2860T Val954Phe |
| 64 | 16 | PDR3 | G2120T Cys707Phed | 64 | 64 | 64 | PDR3 | G2860T Val954Phe |
| 64 | 32 | PDR3 | A2163C Lys721Asn | 64 | 64 | 32 | PDR3 | G2860T Val954Phe |
| 64 | 16 | Not PDR1 | G2381C Arg794Thrd | 32 | 64 | 32 | PDR3 | G2860T Val954Phe |
| 64 | 64 | PDR3 | T2444A Phe815Tyr | 32 | 64 | 32 | PDR3 | G2860T Val954Phe |
| 64 | 16 | PDR3 | A2483C Lys828Thr/ | 32 | 64 | 32 | PDR3 | G2860T Val954Phe |
| T2489C Val830Alad | 64 | 64 | 32 | PDR3 | G2860T Val954Phe | |||
| 64 | 16 | PDR3 | T2839G Leu947Vald | 64 | 64 | 32 | PDR3 | G2860T Val954Phe |
| 64 | 32 | PDR3 | G2860T Val954Phe | 64 | 64 | 64 | PDR3 | G2860T Val954Phe |
| 64 | 32 | PDR3 | G2860T Val954Phe | 32 | 64 | 32 | PDR3 | G2860T Val954Phe |
| 64 | 64 | 32 | PDR3 | G2860T Val954Phe | ||||
| 32 | 64 | 32 | PDR3 | G2860T Val954Phe | ||||
| 64 | 64 | 32 | PDR3 | G2860T Val954Phe | ||||
| 64 | 64 | 64 | PDR3 | G2860T Val954Phe | ||||
| 32 | 64 | 32 | PDR3 | G2860T Val954Phe | ||||
| 64 | 64 | 64 | — | G2860T Val954Phe | ||||
| ERG3 | ||||||||
| 256 | 16 | Not PDR1, not PDR3 |
C800A Thr267Asnd | |||||
| Unidentified | ||||||||
| 32 | 16 | Not PDR1, not PDR3 |
Unknownd | 32 | 64 | 32 | PDR3 | |
| 64 | 16 | — | Unknownd | 64 | 64 | 32 | Not PDR1 | |
| 32 | 16 | — | Unknownd | |||||
For haploid populations, MIC was determined for the original culture and in a diploid formed from the mating of the original haploid with a FLC-sensitive haploid of compatible mating type. For diploid populations, MIC was determined for the original population, for haploid FLC-resistant, meiotic offspring, and for diploids formed from mating the FLC-resistant offspring with a FLC-sensitive haploid.
Genetic tests for allelism were as described in the text. “not PDR1” and “not PDR3” mean that only one of the two tests for allelism was done and there was no match.
The test was not done.
These mutations were recessive.
Genetic mapping:
In most cases (Table 1), the resistance mutations were further tested for allelism with the candidate genes PDR1 and PDR3. These genetic tests were done both to confirm the inheritance of the FLC resistance as a single, stable Mendelian trait and to reach a tentative assignment to a candidate gene. The diploids used for dominance tests were sporulated and multiple tetrads were dissected from each. Again, all tetrads showed segregation for MIC consistent with a single resistance mutation. A MATα, FLC-resistant, URA+, G418-sensitive haploid was recovered from each and used to test allelism in matings with strains with PDR1 and PDR3 deleted, respectively. For these crosses, zygotes were isolated by micromanipulation. The MIC of FLC of these knockout strains was 16 μg/ml or lower. Up to six tetrads were isolated from each cross and their contents scored for MIC of FLC, G418 resistance, and mating type, the latter for quality control. Parental genotypes were FLC resistant, G418 sensitive and FLC sensitive, G418 resistant. Assuming that the unknown mutation is unlinked to the deleted tester gene, the probability of a spurious match in which all five tetrads are all parental ditype by chance alone is 1/25 or 0.03 assuming no crossovers between either of the genes and their respective centromeres. With occasional crossovers between these genes and their respective centromeres, however, the probability of a spurious match becomes even lower.
Sequencing:
The progenitor haploid plus one resistant haploid strain from each of the 58 populations were selected for sequencing of PDR1 (Kolaczkowska et al. 2002) and PDR3 (Nourani et al. 1997) regions known to accumulate FLC-resistance mutations. For each of these strains, the DNA was fully sequenced over bases 600–1075 and 1800–3207 of PDR1 and 730–1070 and 1830–2931 of PDR3. In each gene these regions included the structural motifs I–II and the transcription activation domains near the C terminus that encompass all previously identified mutations in these genes. Amplification primers and sequencing primers spaced at 400–500 bases on each DNA strain were selected with the primer design option provided by the Saccharomyces genome database (http://www.yeastgenome.org/). Sequencing was exactly as described earlier (Anderson et al. 2003).
RESULTS
Evolution of haploids and diploids at various FLC concentrations:
Haploids and diploids showed three different patterns of evolution of resistance (Figure 1). First, at 16 μg/ml FLC, haploids and diploids increased in a similar manner over 5 days. On day 5, three haploid replicate populations reached intermediate MICs (64 μg/ml FLC) and overexpressed PDR5 and one replicate reached a high MIC (256 μg/ml) and overexpressed ERG11. Five of the six diploid replicates at this same FLC concentration reached an intermediate MIC and overexpressed PDR5; one replicate achieved an intermediate MIC, but slightly overexpressed ERG11 (mean = 1.53). Among the three single colonies tested for MIC and gene expression from each replicate flask, there was no evidence of polymorphism for the resistance phenotype.
Figure 1.—
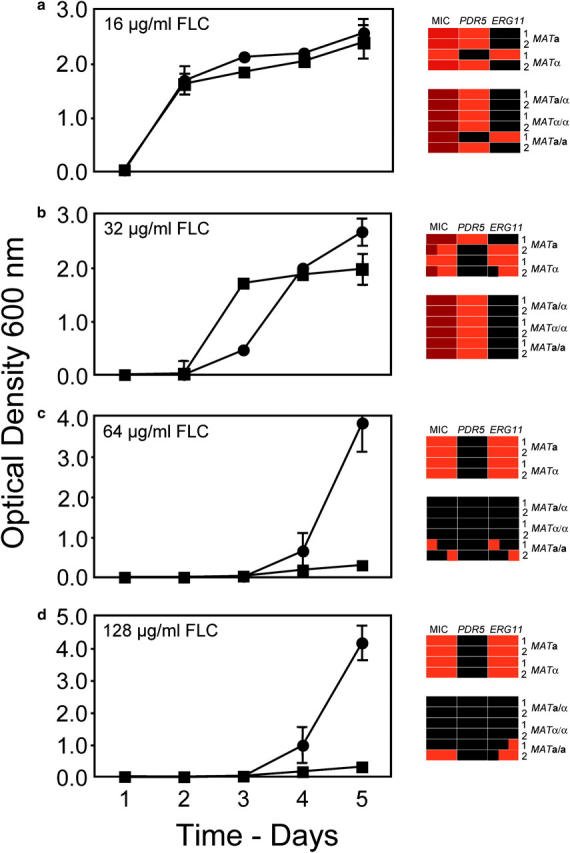
Evolution of resistance to FLC in 50-ml cultures of 0.5× YPD inoculated with 5 × 10⁴ cells. Circles represent the mean OD600 of four haploid populations, two replicates of MATa and two of MATα. Squares represent the mean OD600 of six diploid populations, two replicates of MATa/α, two of MATα/α, and two of MATa/a. The measure of dispersion at each time point was standard error. On the right, MIC of FLC and expression of PDR5 and ERG11 were measured for three single-colony isolates of each population. For MIC, black, 16 mg/ml; dull red, 64 mg/ml; and bright red, 256 μg/ml. For gene expression, black, not overexpressed; and red, significantly overexpressed [see supplementary data appendix (http://www.genetics.org/supplemental/) for original values]. Each rectangle in the grids is divided into three squares, one for each single-colony isolate tested.
Second, at 32 μg/ml FLC, the diploids reached a significantly higher culture density than the haploids at day 2 (two-tailed t-test assuming unequal variance, P = 0.000), while the haploids showed marked increases in density 1 and 2 days later. By day 5, one haploid replicate reached an intermediate MIC of FLC and overexpressed PDR5 and one haploid replicate reached a high MIC and overexpressed ERG11; neither of these replicates showed any polymorphism for phenotype among the three single-colony isolates of each. Two haploid replicates showed evidence of polymorphism in their resistance phenotypes, but the majority of single-colony isolates from these replicates had a high MIC and overexpressed ERG11. The diploid replicates at 32 μg/ml all reached intermediate MICs and overexpressed PDR5.
Third, at 64 and 128 μg/ml of FLC, the haploids began to increase in density on day 4 and reached high density by day 5, during which time the diploids all remained at low density. At day 5, all haploids had high MICs and overexpressed ERG11. The majority of isolates from the diploid populations at day 5 showed no increase in MIC over the basal level nor any overexpression of either PDR5 or ERG11; a minority of isolates from these diploid replicates showed evidence of an increase in MIC over the basal level and in most of these there was a corresponding increase in expression of ERG11. By day 9, however, the diploid cultures had all risen to high density, and all isolates had high MICs and overexpressed ERG11 (data not shown).
Haploids, diploids, and the waiting time for resistance mutations:
The next experiments were done to test the hypothesis that the apparent advantage of the diploids on day 3 of the experiment at 32 μg/ml FLC (Figure 1b) was due to a reduced waiting time relative to that of the haploids. If so, then reducing the diploid inoculum by half relative to that of the haploid populations should erase this advantage. Further, doubling the haploid inoculum relative to that of the diploids should bring the haploid density up to that of the diploids on day 2. These expectations were confirmed (Figure 2): when the diploid populations were started with half the inoculum of the haploids (2.5 × 10⁴ rather than 5 × 10⁴ cells), the increase in the mean density of the diploids was delayed one full day compared to that in Figure 1b and almost exactly matched that of the haploids on day 4 (P = 0.41, Figure 2b). In contrast, the trajectory of the increase among the haploids in Figure 2a closely matched that of the previous experiment in which the inoculum size was the same (Figure 1b).
Figure 2.—

Diploid advantage at 32 mg/ml FLC with respect to the waiting time for FLC-resistance mutations. As in Figure 1, circles show haploid populations and squares show diploid populations. Top, diploid populations were started with 2.5 × 10⁴ cells and the haploids with 5 × 10⁴ cells. Bottom, diploid populations were started with 5 × 10⁴ cells and the haploids with 105 cells.
In the converse experiment, in which the haploids were started with double their previous inoculum size (105 rather than 5 × 10⁴ cells), the haploids showed a prominent increase in density on day 3 and their mean density nearly matched that of the diploids. Again, the difference was not significant (P = 0.11). The diploids in Figure 2b matched their trajectory of increase in density observed in the comparable experiment in Figure 1b.
In the above tests of the waiting time, a potential problem of interpretation is that two different cell types are being compared. In addition to the different number of genomes present, haploid and diploid cells differ markedly in their size, shape, and pattern of budding. The rationale for the next experiments was to compare effectively diploid, haploid, and null genotypes for the primary candidate genes for adaptive mutation, PDR1 and PDR3, in a generally diploid background. In this diploid background, the frequent, loss-of-function mutations at ERG3 would not confer an immediate advantage and the cell type was held constant. We therefore constructed otherwise isogenic diploid strains that varied in the numbers of PDR1 and PDR3 genes. Two strains were homozygous wild type for each gene, two strains were heterozygous for each wild-type gene and its respective deletion, and two strains were homozygous for each deletion. Three replicate 50-ml cultures of each strain (18 in total) were inoculated as above with 5 × 10⁴ cells. The prediction was that cultures of the wild-type homozygotes (i.e., diploid for PDR1 and PDR3) should rise to high density first, followed by the heterozygotes (i.e., haploid for PDR1 and PDR3), followed even later by the homozygous deletion strains (null for PDR1 and PDR3). This prediction was confirmed (Figure 3). Although peripheral to our main prediction, it was curious that the wild-type, homozygous and the heterozygous constructs did not reach the same final density by day 5; this unexpected effect could have been due to many factors, such as a relationship between altered ratios of the regulatory proteins Pdr1p and Pdr3p and their targets and ability of cells to tolerate high population density, but not to ploidy per se.
Figure 3.—

Waiting time and the copy number of PDR1 and PDR3. Squares, mean OD600 for six populations that were PDR1/PDR1 PDR3/PDR3. Circles, mean OD600 for six populations, that were PDR1/PDR1Δ PDR3/PDR3Δ. Diamonds, mean OD600 for six populations that were PDR1Δ/PDR1Δ PDR3Δ/PDR3Δ. Each diploid genotype was constructed twice, from different matings, and was used to found three replicate populations each.
Spectrum of mutations at 16 μg/ml FLC:
Next, we compared the distribution of mutations in haploids and diploids evolving over 100 generations in a low concentration of FLC (Table 1) in which mutations in PDR1 or PDR3 are most likely to be fixed in both haploids and diploids. The dominance level of the 29 mutations occurring in haploid populations was variable with 17 recessive and 12 dominant. In contrast, all of the 29 mutations from the diploid populations were dominant in the test environment with 16 μg/ml FLC; the difference in the distribution of dominant and recessive mutations from haploid and diploid populations was highly significant (chi-square test, 1 d.f., P < 0.001). Of the total of 58 mutations fixed in populations, 52 were identified at the nucleotide sequence level in the sequenced regions of either PDR1 or PDR3 (Table 1 and Figure 4) and in all of these cases the determined map location agreed with the sequence information. All of these mutations were nonsynonymous and no other mutations were observed. The progenitor also showed no departure from the standard sequence. Among the haploids two unidentified mutations did not map to either PDR1 or PDR3. Of these one had a high MIC and was completely recessive, the hallmarks of loss of function at ERG3. This mutation was later identified at the DNA sequence level (Table 1).
Figure 4.—

Distribution of nonsynonymous mutations in PDR1 and PDR2 in haploid and diploid populations evolved for 100 generations in 16 mg/ml FLC.
Several mutations occurred in parallel in different populations including Phe739Ile (two haploid populations), Phe749Ser (1 diploid and 1 haploid population), and Lys302Asn (2 diploid populations) in PDR1 and Gly253Val (4 haploid populations), Cys707Phe (3 haploid populations), and, most remarkably, Val945Phe (2 haploid and 17 diploid populations) in PDR3. In PDR1, one amino acid position was substituted for three different amino acids: Arg821His (1 haploid population), Arg821Leu (1 diploid population), and Arg821Ser (1 diploid population). Several of these mutations have occurred independently in previous studies. In all but one case, the same substitution occurring independently in different populations conferred the same level of dominance; the only anomaly was Phe739Ser in PDR1, which for reasons unknown appeared to be dominant in one population, but recessive in another. In three of the four regions sequenced the diversity of mutations was less in the diploid than in the haploid populations, and especially so in the transcription activation domain of PDR3.
DISCUSSION
The haploid and diploid yeast populations in this study showed prominent and complementary advantages and disadvantages in adapting to the presence of the antifungal drug fluconazole. The clear advantage of diploids over haploids at low fluconazole concentration follows from two conditions. First, these experimental populations were of low initial size (5 × 10⁴ cells) and the waiting time must have been the rate-limiting step in adaptation. Given a per-gene mutation rate of 10−6 from an approximate per-nucleotide mutation rate of 10−9 and an average gene size of 103 nucleotides, these populations were likely devoid of resistance mutations for the first several generations. Indeed, populations of even lower initial size (10 or 20 cells) failed to evolve resistance at 32 μg/ml FLC or higher concentrations. Second, the mutations in PDR1 and PDR3 strongly favored at low drug concentrations were sufficiently dominant in heterozygous diploids to confer a large selective advantage over the drug sensitive, ancestral type.
The difference in the time to fixation of the first mutation between haploids and diploids at 32 μg/ml FLC can be attributed to ploidy, and not to other factors, for the following reasons. First, the haploid and diploid cells used in these experiments were all initially isogenic and so the background genotype was not a factor. Second, there was no detectable effect of mating type on adaptation. Third, when the initial population size of the diploid populations was halved, their advantage was erased. Conversely, when the initial populations of the haploid populations were doubled, their disadvantage was nearly eliminated. And finally, in additional control experiments in which the number of functional PDR1 and PDR3 genes was varied in diploid strains, as expected, the wild types evolved resistance first, followed by the strains heterozygous for the gene deletions, followed by the diploid strains homozygous for the gene deletions. Consequently, cell-type differences between haploids and diploids could not have been a factor. The results all coincided closely with those expected when the waiting time is the rate-limiting step of adaptation and greater numbers of copies of the target genes for beneficial mutations confer an advantage. The simple reason for the decreased waiting time is that diploid populations have twice as many genome equivalents and hence twice as many mutational targets as haploid populations have with the same numbers of individuals.
Although diploids were at an advantage at the lower end of the spectrum of drug concentration, haploids were at an advantage over diploids at the high end of the drug-concentration range. This is explained by the recessive nature of the ERG3 mutations most frequently favored at these concentrations and the resulting greater efficiency of selection of these mutations in haploids than in heterozygous diploids. At high drug concentrations, individual PDR1 and PDR3 mutations are not strong enough in their effect on resistance to be favored in either haploids or diploids and indeed show a pronounced fitness deficit compared with the ancestral drug-sensitive type at the highest drug concentrations. That diploids ultimately did become resistant by day 9, and showed gene expression patterns consistent with loss of function at ERG3, is best explained by loss of heterozygosity and the delayed exposure of ERG3 to selection as homozygotes. MATa/α diploids did not segregate for resistance; all progeny had MICs of 256 μg/ml FLC (data not shown). The requirement for mitotic recombination, in the form of either mitotic crossing over or local gene conversion, imposes an extra step on diploids relative to haploids and this further retards the rate of adaptation.
The advantages and disadvantages associated with haploidy and diploidy seen here were dependent on conditions, primarily the drug concentration, which determined the kinds of resistance mutations that were favored in the experimental populations. The absence of a general rule for the advantages and disadvantages of a particular ploidy state is consistent with previous studies, which have demonstrated both diploid and haploid advantages in the rate of adaptation. For example, diploid populations had a clear advantage over haploid populations in adapting to glucose limitation in chemostats (Paquin and Adams 1983), while haploid populations had at least a transient advantage over diploid populations in adapting to a minimal medium in serially transferred batch cultures (Zeyl et al. 2003). In these previous studies, however, the conditions for selection were different and the mutations responsible for increased fitness were of smaller effect than those observed here.
In the short-term evolution experiments with a maximum of 22 generations, the populations showed clear differences in their trajectories of adaptation based on their ploidy, but these populations were not necessarily all fixed for single mutations. To examine the spectrum of mutations favored in haploid and diploid populations at a low concentration of FLC, we next evolved populations in batch culture with daily dilution and transfer to encourage the fixation of single mutations that could then be characterized genetically and at the nucleotide sequence level. In these experiments, there was a clear difference between haploids and diploids even in the mutations in PDR1 and PDR3, where the availability of these mutations is greatest for both haploids and diploids. Consistent with expectation, the haploids showed a greater diversity of mutations than diploids, with a greater range of dominance (16 recessive, 13 dominant) than that in diploids (all 29 dominant). Although the potential mutational spectrum was probably not saturated in these experiments, a number of independent changes in the same nucleotide site were observed. Most striking was the frequency of fixation of the Val945Phe mutation in diploids in 17 of 27 diploid populations for which mutations were identified at the sequence level. Although two haploids also fixed this same mutation, they had a much greater diversity of mutation at PDR3.
What are the general implications of our results for the evolution of antifungal drug resistance in fungal populations infecting patients? In opportunistic fungal pathogens ploidy is well known to vary among species. For example, Candida albicans is diploid (Berman and Sudbery 2002), while C. glabrata is haploid (Fidel et al. 1999; Dodgson et al. 2003). Because fungal pathogens of humans live in highly structured environments, the effective size of their populations is likely much lower than those of well-mixed, planktonic, yeast cultures. Waiting time could well be a rate-limiting step in the evolution of resistance in the host environment and this may favor diploid pathogens if sufficiently dominant mutations for resistance are available in their populations. It would be interesting to specifically compare the kinds of resistance arising in the haploid C. glabrata and the diploid C. albicans across uniform clinical settings and drug-treatment regimens; from the present study, our prediction is a more frequent occurrence of loss-of-function ERG3 mutations in C. glabrata than in C. albicans.
A second implication of our results is that antifungal drugs could potentially be deployed to manage resistance in fungal pathogens if the fitness effects of their resistance mutations in the host mirror those of S. cerevisiae seen here. For example, as noted above, haploid populations may be expected to evolve high resistance in one step in high drug concentrations through loss of function at ERG3 much more readily than diploids. Alternatively, at the lowest drug concentrations, both haploids and diploids most frequently accumulate mutations at PDR1 and PDR3. Although these mutations provide resistance at low drug concentrations, they carry a fitness deficit at the highest concentrations. Resistance might therefore be channeled to a weak form of resistance, with pathogen populations becoming highly vulnerable to extinction with a subsequent exposure to a high drug concentration. For antifungal drug resistance in general, molecular characterization of mutations and resistance mechanisms is only half the story; the ploidy of the fungal pathogen and the fitness profiles of resistance mutations in different environments may be determining factors in how the fungal pathogens adapt to the presence of antifungal drugs.
Acknowledgments
This work was supported by a research grant from the Natural Sciences and Engineering Research Council of Canada to J.B.A. Fluconazole was a gift from Pfizer Canada.
References
- Anderson, J. B., C. Sirjusingh, A. B. Parsons, C. Boone, C. Wickens et al., 2003. Mode of selection and experimental evolution of antifungal drug resistance in Saccharomyces cerevisiae. Genetics 163: 1287–1298. [DOI] [PMC free article] [PubMed] [Google Scholar]
- Berman, J., and P. E. Sudbery, 2002. Candida albicans: a molecular revolution built on lessons from budding yeast. Nat. Rev. Genet. 3: 918–930. [DOI] [PubMed] [Google Scholar]
- Dodgson, A. R., C. Pujol, D. W. Denning, D. R. Soll and A. J. Fox, 2003. Multilocus sequence typing of Candida glabrata reveals geographically enriched clades. J. Clin. Microbiol. 41: 5709–5717. [DOI] [PMC free article] [PubMed] [Google Scholar]
- Fidel, Jr., P. L., J. A. Vazquez and J. D. Sobel, 1999. Candida glabrata: review of epidemiology, pathogenesis, and clinical disease with comparison to C. albicans. Clin. Microbiol. Rev. 12: 80–96. [DOI] [PMC free article] [PubMed] [Google Scholar]
- Kolaczkowska, A., M. Kolaczkowski, A. Delahodde and A. Goffeau, 2002. Functional dissection of Pdr1p, a regulator of multidrug resistance in Saccharomyces cerevisiae. Mol. Genet. Genomics 267: 96–106. [DOI] [PubMed] [Google Scholar]
- Kondrashov, A. S., 1993. Classification of hypotheses on the advantage of amphimixis. J. Hered. 84: 372–387. [DOI] [PubMed] [Google Scholar]
- Kondrashov, A. S., and J. F. Crow, 1991. Haploidy or diploidy: Which is better? Nature 351: 314–315. [DOI] [PubMed] [Google Scholar]
- Lupetti, A., R. Danesi, M. Campa, M. Del Tacca and S. Kelly, 2002. Molecular basis of resistance to azole antifungals. Trends Mol. Med. 8: 76–81. [DOI] [PubMed] [Google Scholar]
- Nourani, A., M. Wesolowski-Louvel, T. Delaveau, C. Jacq and A. Delahodde, 1997. Multiple-drug-resistance phenomenon in the yeast Saccharomyces cerevisiae: involvement of two hexose transporters. Mol. Cell. Biol. 17: 5453–5460. [DOI] [PMC free article] [PubMed] [Google Scholar]
- Orr, H. A., and S. P. Otto, 1994. Does diploidy increase the rate of adaptation? Genetics 136: 1475–1480. [DOI] [PMC free article] [PubMed] [Google Scholar]
- Paquin, C., and J. Adams, 1983. Frequency of fixation of adaptive mutations is higher in evolving diploid than haploid yeast populations. Nature 302: 495–500. [DOI] [PubMed] [Google Scholar]
- Sanglard, D., and F. C. Odds, 2002. Resistance of Candida species to antifungal agents: molecular mechanisms and clinical consequences. Lancet Infect. Dis. 2: 73–85. [DOI] [PubMed] [Google Scholar]
- Sanglard, D., F. Ischer, D. Calabrese, M. de Micheli and J. Bille, 1998. Multiple resistance mechanisms to azole antifungals in yeast clinical isolates. Drug Resist. Updates 1: 255–265. [DOI] [PubMed] [Google Scholar]
- Wahl, L. M., and D. C. Krakauer, 2000. Models of experimental evolution: the role of genetic chance and selective necessity. Genetics 156: 1437–1448. [DOI] [PMC free article] [PubMed] [Google Scholar]
- White, T. C., K. A. Marr and R. A. Bowden, 1998. Clinical, cellular, and molecular factors that contribute to antifungal drug resistance. Clin. Microbiol. Rev. 11: 382–402. [DOI] [PMC free article] [PubMed] [Google Scholar]
- Zeyl, C., T. Vanderford and M. Carter, 2003. An evolutionary advantage of haploidy in large yeast populations. Science 299: 555–558. [DOI] [PubMed] [Google Scholar]