

Abstract
Animal-mediated pollination is essential in the reproductive biology of many flowering plants and tends to be associated with pollination syndromes, sets of floral traits that are adapted to particular groups of pollinators. The complexity and functional convergence of various traits within pollination syndromes are outstanding examples of biological adaptation, raising questions about their mechanisms and origins. In the genus Petunia, complex pollination syndromes are found for nocturnal hawkmoths (P. axillaris) and diurnal bees (P. integrifolia), with characteristic differences in petal color, corolla shape, reproductive organ morphology, nectar quantity, nectar quality, and fragrance. We dissected the Petunia syndromes into their most important phenotypic and genetic components. They appear to include several distinct differences, such as cell-growth and cell-division patterns in the basal third of the petals, elongation of the ventral stamens, nectar secretion and nectar sugar metabolism, and enzymatic differentiation in the phenylpropanoid pathway. In backcross-inbred lines of species-derived chromosome segments in a transposon tagging strain of P. hybrida, one to five quantitative trait loci were identified for each syndrome component. Two loci for stamen elongation and nectar volume were confirmed in introgression lines and showed large allelic differences. The combined data provide a framework for a detailed understanding of floral syndromes from their developmental and molecular basis to their impact on animal behavior. With its molecular genetic tools, this Petunia system provides a novel venue for a pattern of adaptive radiation that is among the most characteristic of flowering plants.
SEXUAL reproduction in flowering plants is dependent on the correct delivery of pollen grains to con-specific stigmata. In nature, the vectors for this delivery are often animals that forage for pollen and nectar. Many flowers have evolved complex syndromes of morphological and physiological characters to attract and reward pollinators and thereby to enhance the efficiency and accuracy of pollen deposition (e.g., Proctor et al. 1996). Pollinators are important factors for the evolution of variety in floral display among angiosperms and in some cases can contribute to reproductive isolation by differential visitation (e.g., Grant 1994).
In many unrelated taxa, visitation-associated floral characters often fit broad patterns that reflect the animal(s) that visit them most frequently (pollination syndromes, Faegri and Van der Pijl 1979). For example, nocturnal moth syndromes typically involve heavy nocturnal fragrance, copious nectar production, and a tubular, white corolla. Flowers visited by bees have various scents and colors and open structures that are accessible to the insect's body. Other examples include systems for pollination by birds, bats, butterflies, or flies, each with distinct characteristics (Proctor et al. 1996). Pollination syndromes are outstanding examples of biological adaptation, involving a variety of developmental and physiological systems. They raise questions about their genetic basis and the mutational steps that lead from one pollination syndrome to another.
Different pollination syndromes can often be seen among closely related and sexually compatible sister species, enabling their genetic dissection. For example, interspecific crosses of bird- and bee-pollinated species of the genus Mimulus (Bradshaw et al. 1995; Bradshaw et al. 1998) have suggested a relatively simple genetic basis of major quantitative trait loci (QTL) that can influence pollinator foraging (Schemske and Bradshaw 1999; Bradshaw and Schemske 2003). Molecular studies by Dudareva et al. (1996) revealed that floral scent in moth-pollinated Clarkia breweri has been acquired by novel expression patterns of S-linalool synthase, as compared to the nonscented C. concinna. Whereas striking natural variation for pollination syndromes can be found in these and many other plant genera, a systematic clarification of the various underlying genetic mechanisms would require detailed studies in model plants with sufficient molecular tools.
One potential model is the genus Petunia, which comprises at least 10 species (Ando et al. 1995). In Petunia, typical examples of syndromes for hawkmoth (P. axillaris) and bee (P. integrifolia) pollination are found. Differential insect visitation of these species has been confirmed by direct observation in sympatric populations (Ando et al. 2001), suggesting an important biological meaning of the floral differences. Natural hybrids of sympatric P. axillaris and P. integrifolia have not been reported, although artificial crosses can produce fertile hybrid offspring (Ando et al. 2001). It is clear that insect visitation is not the only reproductive barrier among Petunia species, since genetic incompatibilities between pairs of ecotypes can be considerable (Ando et al. 2001). However, the extensive divergence in pollination syndrome indicates that insect visitation is central in the reproductive biology of Petunia and has profoundly shaped the evolutionary histories of its species.
Petunia has a considerable body of genetic information and molecular tools. Its classical linkage maps comprise >100 markers (Gerats et al. 1993), and it was among the first plants to be transformed by Agrobacterium (Horsch et al. 1985). A nonautonomous transposable element (dTph1) has been used extensively for reverse genetics and cloning of tagged mutations (Koes et al. 1995; Souer et al. 1996; Stuurman et al. 2002; Vandenbussche et al. 2003) and ranks among the most aggressive mobile elements known in plants. Many flower color genes have been isolated, including the regulatory locus that underlies the white color of P. axillaris (Quattrocchio et al. 1999). These attributes provide the tools necessary for molecular investigations into the floral syndromes.
Here, we explore the Petunia syndromes by quantitative genetic and phenotypic characterization. We specifically aimed to identify and specify the most characteristic phenotypic differences between the Petunia syndromes and to transfer quantitative trait loci for these differences into a P. hybrida strain commonly used for transposon mutagenesis. This approach provides a first framework to make the pollination syndromes amenable for analyses in terms of molecular genetics and animal behavior, which should lead to new insight into a pattern of adaptive radiation that is among the most characteristic of flowering plants.
MATERIALS AND METHODS
Plant material, backcross recombinant inbred/introgression line derivation, and evaluation:
P. a. parodii and P. i. inflata were obtained from the Department of Genetics at Free University, Amsterdam. P. a. parodii has been inbred for many generations and is referred to as P. parodii S7 by Wijsman (1983) and Quattrocchio et al. (1999). P. i. inflata is identical to P. inflata S6, described by Wijsman (1983), and is maintained by sib mating. W138 is a laboratory inbred with large numbers of active transposable elements such that independent, selfed lineages may diverge considerably over time. For crosses and backcrosses, a single W138 plant was used as a father to fertilize P. a. parodii, P. i. inflata, or F1 hybrids. The BC1F5 inbred line collections were started from 120 BC1 plants per population and produced by single seed descent. In every generation, seeds were sown in flats and the center-most seedling was used to produce the next generation. In later stages of backcross recombinant inbred (BIL) derivation, some lines had to be selected for vigor, due to accumulating inbreeding depression. Many of the 240 founder lines were lost by sterility or general weaknesses. A total of 75 WI-BILs and 63 WP-BILs remained healthy in BC1F5.
Introgression lines for STA1 and VOL2 were constructed by genotyping a BC1 population of a cross of W138 (recurrent parent) to the inbred line WI-95, which carries an intact homozygous substitution of P. i. inflata chromosome VI in a W138 genetic background plus a small P. i. inflata segment of chromosome II. Recombinants in chromosome VI were identified first by PCR-based selection for homozygous W138 alleles at AN2, followed by amplified fragment length polymorphism (AFLP) analyses using all primer combination as used for map construction. Introgression lines (ILs) were then selfed for two generations and selected against introgressions other than that on chromosome VI, and homozygous ILs were phenotyped.
Traits in BIL populations were measured in two independent experiments. Growing stand 1 was in open soil in polyethylene-tunnel greenhouses that were made inaccessible to insects. Stand 2 was in 15-cm diameter pots in a greenhouse. To produce line means, essentially all phenotypic data were averaged over at least 5 flowers/line. For nectar volumes in stand 1, four plants per line were grown and 10–40 flowers/plant were used to obtain quantitative measures. Nectar concentration and sugar composition were determined from pooled nectars of 7–10 flowers of a single plant grown in stand 2. For QTL analysis, D1 data from the WP-BIL population were base-10 log transformed to improve normality of the distribution. D1 and nectar volume data in the WI-BILs were square root transformed to improve normality.
QTL analyses and statistics:
Composite interval mapping (CIM) was performed for each trait and experiment individually using the computer program QTL Cartographer (Basten et al. 2002; Wang et al. 2004). The population type was SF7 (seven self-generations), which allows for some level of residual heterozygosity. Cofactors were selected using forward/backward (P in-out = 0.01) regression in model 6 of QTL Cartographer. The exclusion window was reduced stepwise down from 10 cM, until the localization and LOD scores were optimized. Empirical significance thresholds were determined by 1000 permutations in QTL Cartographer, using a simple interval mapping model and invariably ranged from LOD 2.94 to 2.98. For this reason, the LOD threshold is not directly applicable to CIM and must be considered an approximation.
QTL mapping of non-normally distributed traits was performed using a Kruskal-Wallis rank-test procedure. Every nonredundant marker on the linkage maps was tested independently. Dominant AFLP markers were selected along chromosomes with significant associations to set the significance levels at P < 0.05 (χ2 = 3.84, 1 d.f.).
QTL additive effects and their standard errors, as well as the proportions of phenotypic variance that they explained, were estimated in multiple QTL models using multiple linear regression. To produce linear models, QTL were represented by their most closely linked markers as independent categorical variables. All markers predicted from CIM were incorporated in the models for their respective traits and significantly contributed to the overall fit (P < 0.01). This procedure takes account of our BC1F5 population structures, which result in unequal group sizes for alternative genotypes (3:1, unless distorted), while approaching interval mapping in accuracy, as marker-QTL distances are short. Analysis of covariance with continuous traits was performed by stepwise multiple linear regression, adding continuous traits as first covariates to estimate the effect of individual QTL in subsequent, complete multiple QTL models.
Genome-wide searches for pairwise interactions among all AFLP loci were performed using the computer program MapManager QTXb17 (Manly et al. 2001) at a significance level of P = 10−6. Although a few significant interactions were found at this level, they were rejected because they were not consistent between the independent experiments in stands 1 and 2. In addition, pairwise interactions between QTL with significant main effects were analyzed using a general linear model with closely linked markers as proxies for QTL. QTL by environment (G × E) interactions were evaluated by repeated measures ANOVA for each trait and growing stand, using the markers most closely linked to the QTL as between subject factors. All standard statistical analyses were done using SPSS 11.0 for Windows.
Markers and linkage mapping:
Generation of AFLP markers was done essentially as described by Vos et al. (1995), using the enzyme combination EcoRI-MseI. AFLPs were scored codominantly if they consisted of a clearly identifiable pair of bands that differed in one or a few bases and if the intensities of these bands decreased by a factor two in the apparent heterozygous genotypes. All AFLP data including gel images are available upon request.
Chromosome-specific polymorphic PCR markers were generated for the genes Hf1 (Hf1-F, 5′-gaaatggatcaagtcattggaaga-3′; Hf1-R, 5′-catgcaatgcgcttcatgtactc-3′), GRP (5′ grpF, 5′-gagttaactctaatattccatgc-3′; grpR, 5′-tcagccaagttgacaagttaagg-3′), ADH2 (adh2F, 5′-tgagttggcctcaacttcatgtcc-3′, adh2R, 5′-acgaatgacttggccaacagtgc-3′), ADH1 (adh1-F, 5′-gatagtcaagtcaagacgtgc-3′; adh1-R, 5′-ctcgacattgttgttgctagc-3′), PO (po-F, 5′-cacctacaattagtgagcattctg-3′; po-R, 5′-tgcattttagtaacggacactggag-3′, AN2 (an2F, 5′-cttctaatgcatcaacatcaggag-3′; an2R, 5′-ctttcagcatttaccgatggtgctg-3′), FBP1 (fbp1-F, 5′-tcggacttcaagagtcacac-3′; fbp1-R, 5′-catgcatcttgccagagctagc-3′), and S-RNAse (SoF, 5′-tcgaacttcagaatgtttcag-3′; SoR, 5′-ccatgttctcttcgaagttcg-3′).
Linkage mapping was performed using the computer program MapManager QTXb17 (Manly et al. 2001), which optimizes the sum of adjacent LOD scores and local order permutations (ripple). Linkage groups were assembled by first placing chromosome-specific gene markers in seven predefined linkage groups. All other markers were distributed over these groups in the F2 recombinant inbred line (F2 RIL) mode, first at a stringency of P = 10−6 for false linkages, followed by distribution at P = 10−5. At this level, few markers remained unlinked. No major linkage groups other than those prespecified were found. Markers with ambiguous chromosome associations that inflated map lengths were removed. In some cases, W138-derived markers with dual linkage group associations (by pseudolinkage) were shared between the populations. If such markers had a clear chromosomal position in one map, this was used to infer its chromosomal association in the other map.
For both genome maps (WI-BIL and WP-BIL) the mapping process was repeated multiple times for each chromosome to evaluate the stability of the orders. We then settled on the most stable order and considered it the best approximation with the current data set. Plants containing heterozygosities at particular markers were omitted from the data set for calculation of marker orders of the chromosome that contained this heterozygosity, but were retained in the data set for the other chromosomes. This procedure was necessary to avoid artificial clustering of coupling-phase markers, due to the dominant-only scoring of AFLPs. To correct the centimorgan distances from F2 RIL to BC1F5 RIL, data were analyzed by the mapping program MAPL98. Marker interval lengths were then manually adjusted in MapManager QTXb17. Genotypes of all markers in all inbred lines were stored and graphically analyzed using the computer program GGT (van Berloo 1999).
Nectar volume and sugar composition:
Nectar was collected by placing 2 cm of corolla tube, including a short piece of pedicel, upside down into a standard 500-μl PCR reaction vial. A hole was punched into the bottom of the vial, which was hung into a 1.5-ml eppendorf tube, and centrifuged at 12,000 rpm for 10 sec. Volume was then determined with a graded pipette tip.
Sucrose, glucose, and fructose in pooled nectar samples were separated by high-performance anion-exchange chromatography and quantified with a pulsed amperometric detector (HPAEC-PAD, Bio-LC, Dionex, Sunnyvale. CA). A CarboPa PA-100 column was used with isocratic elution in 115 mm NaOH, 50 mm NaAcetate. Peak areas were determined using Chromelion software and compared with standard curves for the pure sugars.
For histological sections, ovaries and their nectaries were embedded in epon (Fluka, Buchs, Switzerland), sectioned, and stained in 0.05% toluidine blue in water.
Morphometric analyses:
Quantitation of supravascular epidermal cells was performed by scanning electron microscopy. Fresh tissue from floral stages 7 and 14 (Reale et al. 2002) was glued with silver adhesive (Plano GMBH item no. G302) to the cooling stage of a Hitachi S-3500N electron microscope. Overlapping images of the frozen tissue were collected under semivacuum conditions and exported to Photoshop 6.0 (Adobe Systems) for assembly and accounting of cell dimensions. Three independent reads along each axis were averaged for this analysis.
Analysis of floral fragrances:
Plants were grown in a climate chamber at 20°, 70% relative humidity, an with a light intensity of 14,500 L/m2 under a 12-hr light-dark regime (light at 6 am, dark at 6 pm). Using a glass cylinder to encapsulate the flowers, air was pushed (1.1 liter/min) through a charcoal filter and introduced from the top of each cylinder over the flower. Super-Q traps (25 mg, 80/100 MESH, Alltech, Deerfield, IL) were attached at the base of each cylinder. Traps were connected to flowmeters (Automated Volatile Collection System-ASU, ARS, Gainesville, FL) through which the air was pulled out at 0.8 liter/min during 4 hr in the early dark period (6 pm–10 pm). In this period, P. a. parodii reaches peak emission levels within a circadian rhythm (M. E. Hoballah et al., unpublished results). Because P. i. inflata is not circadianly rhythmic, quality and quantity of its fragrance is minimally affected.
Traps were rinsed with 150 μl methylene chloride and 200 ng n-octane and nonyl acetate were added as internal standards. Three-microliter aliquots were injected into a Hewlett Packard HP 6890 gas chromatograph equipped with a flame ionization detector and an apolar capillary column (HP-1, 30 m, 0.25 mm internal diameter, 0.25 m film thickness, Alltech). Helium (24 cm/sec) was used as carrier gas. Hewlett Packard GC-Chemstation software was used to quantify all major components on the basis of the response to the internal standards. Confirmation of identity by comparison of retention times with synthetic samples was obtained for benzaldehyde (Aldrich, Milwaukee), benzylalcohol (Sigma, St. Louis), methylbenzoate (Aldrich), methyl salicylate (Fluka), eugenol (Sigma), vanillin (Fluka), isoeugenol (Fluka), and benzylbenzoate (Sigma). Other compounds were analyzed using the Wiley library after mass spectrometry analysis (Agilent 5973, transfer line 230°, source 230°, quadrupole 150°, ionization potential 70 eV, scan range 0–400 amu). These identifications are regarded as tentative.
RESULTS
Linkage maps of interspecific BIL lines:
We set out to produce linkage maps of distinctive Petunia genomes. Petunia axillaris has three subspecies: P. axillaris axillaris, P. axillaris subandina, and P. axillaris parodii (Ando 1996). All three subspecies are white flowering with a tubular corolla and a long style that exserts the stigma from the corolla tube (e.g., P. a. parodii, Figure 1, A–C). P. integrifolia is subdivided into several subspecies (Ando et al. 1995), all having a violet or reddish-purple and bell-shaped corolla with two ventral stamens extended above the style (e.g., P. i. inflata, Figure 1, D–F).
Figure 1.—
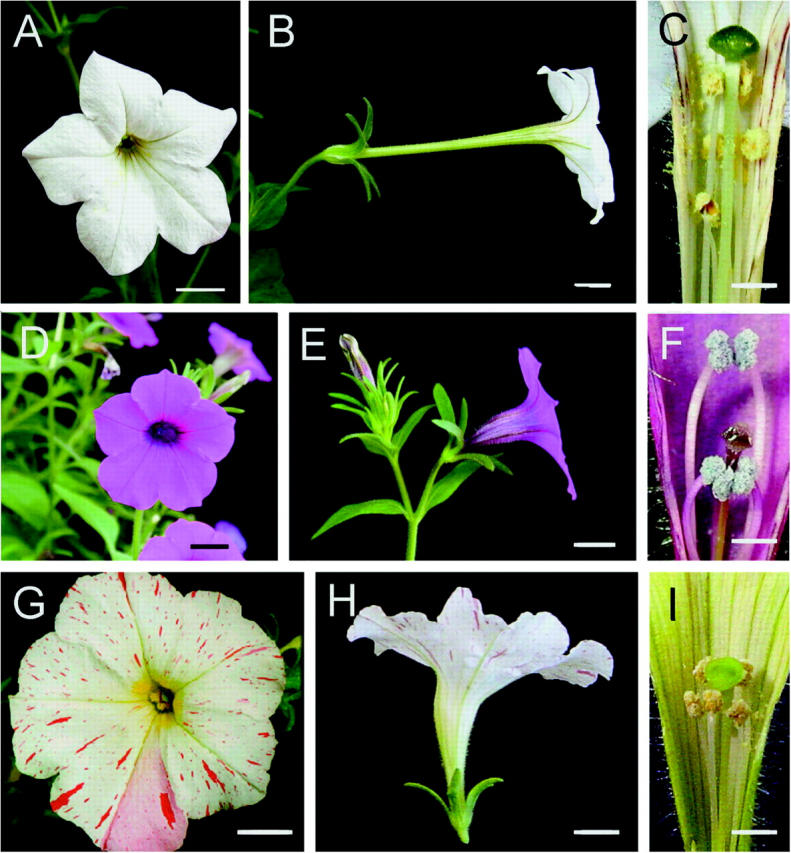
Petunia species accessions. P. a. parodii flower in front view (A), side view (B), and internal (C). P. i. inflata flower in front view (D), side view (E), and internal (F). W138 flower in front view (G), side view (H), and internal (I). Bars in A, B, D, E, G, and H are 1 cm; bars in C, F, I are 0.5 cm.
To create material suitable for linkage mapping and QTL analysis of floral differences, two populations of BILs were constructed from crosses of either P. i. inflata or P. a. parodii accessions of Figure 1, and P. hybrida strain W138 (Figure 1, G–I). W138 is a standard laboratory inbred, which contains up to 200 copies of active dTph1 transposable elements (de Keukeleire et al. 2001).
The breeding scheme involved a single backcross of the primary F1 hybrids to W138 as recurrent parent, followed by five generations of self-fertilization through single-seed descent (BC1F5). This should result in the fixation of wild genome segments in a W138 genetic background in a 1:3 genomic ratio. The two populations allow for a comparative phenotypic analysis of species-specific genome introgressions in a common genetic background. Each population of BILs (WP-BILs for the P. a. parodii cross, WI-BILs for the P. i. inflata cross) was founded by 120 BC1 individuals. During each generation of inbreeding, a number of lines were lost due to sterility and general weakness. The final populations contained 75 (WI-BILs) and 63 (WP-BILs) healthy inbred lines.
The populations were genotyped to produce linkage maps of 264 AFLP markers for the WI-BILs, and 201 AFLP markers for the WP-BILs. In both maps, we obtained seven major linkage groups (Figure 2), which were assigned to the seven chromosomes of the haploid genome by PCR markers for previously mapped genes in the WI-BILs (Strommer et al. 2000, 2002). Figure 2 gives the nonredundant marker positions only, to visualize the lengths and numbers of genetic intervals (for a full version of the maps, see supplementary Figure 1 at http://www.genetics.org/supplemental/). WI-BIL and WP-BIL maps were aligned using W138-derived AFLP polymorphisms that were shared between the populations. Within the resolution obtained, this indicated a generally congruent marker order. Maps were remarkably short, as seen before (Strommer et al. 2002).
Figure 2.—

AFLP linkage maps of the inbred populations. The seven linkage groups are designated I–VII and represent the chromosomes of the haploid genome. WP-BIL linkage groups are white; WI-BIL are gray. Unique map positions are given as horizontal lines. Connecting lines between linkage groups denote positions of shared AFLP markers that were derived from the common parent, W138. Distances in centimorgans are given at the left as a scale bar.
Two chromosome-specific PCR markers and eight AFLP markers were scored codominantly in the WI-BILs, estimating a residual heterozygosity of 5–12%. Residual heterozygosity in the WP-BILs, estimated from 11 codominantly scored AFLP markers, was 0–10%. These percentages are higher than the expected ∼2% for BC1F5 inbreds and suggests selection against certain homozygous genotypes. There was significant segregation distortion in several positions along both maps (not shown). It is noteworthy that P. i. inflata is a self-incompatible outcrosser. The region surrounding the S-locus was distorted (P < 0.01), with an overrepresentation of the W138-derived allele.
For the inheritance of color, Quattrocchio et al. (1999) have shown that various mutations in the single-gene AN2 cause a color shift from violet P. integrifolia to white P. axillaris flowers. In accordance with this, the P. a. parodii an2 allele (chromosome VI) conferred pale-white colors to any of 17 WP-BILs that were homozygous for it. In contrast, all 25 WI-BILs homozygous for the P. i. inflata AN2 allele were fully pigmented (data not shown) with their color shade affected by an unknown number of modifier loci.
Cellular distinctions in the basal third of the petal control tube morphology:
The most conspicuous morphological character that distinguishes P. a. parodii from P. i. inflata is a long tubular corolla (see Figure 1, B and E). Long and constricted tubes maximize stigma exposure to moth pollinators, which insert a long, slender proboscis into the floral tube to reach the nectar at the base. The bell-shaped P. i. inflata corolla allows bees to enter the flower and to reach the nectar with their short proboscis.
We sought to define segments along the proximal-distal axis of the petals that may reveal localized differences between species. The Petunia corolla has traditionally been divided into tube and limb (Figure 3A), the latter being the distal domain that deflects and forms the floral display in front view. These floral domains are genetically distinct, as judged by independent pigmentation patterns (Martin and Gerats 1993). We divided the petals into three subdomains. Domain 3 (D3) is equivalent to the limb, while the tube is divided in D1 and D2 (Figure 3A). In all Petunia, the stamen filaments are fused to the petals in the proximal part of the corolla tube, measured from the ovary, and become detached more distally. D1 is the petal tube segment fused to the stamen filaments. D2 is the distal tube domain between D1 and D3.
Figure 3.—

Architecture of Petunia flowers. (A) Schematic of a Petunia flower showing the traditional division into tube and limb and the subdivision in domains D1, D2, and D3. (B) Cell-number and cell-length measures in a mature P. a. parodii flower (top) and a mature P. i. inflata flower (bottom). Right of the flowers is the division into D1, D2, D3, and the number of cells in each of the domains. Left of the flowers the length of the cells in a bottom-top (longitudinal) dimension is given. The length of flowers at the given developmental stage is given above the image in centimeters. Cell numbers and sizes were determined by low vacuum scanning electron microscopy. (C) As in B but for immature flowers. The length of flowers at the given developmental stage is given above the image in centimeters.
D1 length differed vastly between P. a. parodii and P. i. inflata (see Table 1) by 24.4 environmental standard deviations. The W138 line differed from both species in D1 tending toward P. i. inflata (Table 1). Analysis of variance among a collection of additional subspecies revealed that P. integrifolia and P. axillaris are easily distinguished on the basis of D1 length (Games-Howell test after ANOVA, P < 0.001), but not D2 length (P > 0.05). This demonstrates that D1 is the most important site of species differences in tube length. It is noteworthy that the species can also be distinguished on the basis of length in D3 (not shown). Because this domain does not contribute to tube length, we will not consider it here.
TABLE 1.
Summary of the phenotypic data of the parents used for BIL derivation
| Trait | Unit | N | W138: μ (SD) |
P. i. inflata: μ (SD) |
P. a. parodii: μ (SD) |
|---|---|---|---|---|---|
| D1 length | Centimeter | 10 | 1.05 (0.06) | 0.41 (0.05) | 3.82 (0.14) |
| Nectar volume | Microliter | 10 | 7.21 (2.53) | 1.21 (0.92) | 12.81 (2.57) |
| Nectar concentration | Molar | 10 | 1.55 (1.06) | 1.92 (0.62) | 0.36 (0.13) |
| Sucrose/hexose ratio | U | 10 | 0.93 (0.47) | 0.30 (0.06) | 2.85 (2.79) |
Measures are given as averages (μ) plus or minus standard deviations (SD), including the number of flowers (N) on which they were determined.
To determine the cellular basis of the difference in D1 length, cell sizes and cell numbers were recorded along the midrib of the petal of P. i. inflata and P. a. parodii. In mature flowers of P. i. inflata, D1 cells were about three times shorter than in P. a. parodii (Figure 3B) while cell width was not appreciably different (not shown). Cell-length differences were also found in D2, but these were less pronounced than in D1. In young floral buds, differences in cell length along the petal, and in D1 in particular, are minor compared to mature flowers (compare Figures 3B and 3C). However, cell number was different in D1 at this stage. P. a. parodii had ∼4.5 times as many cells as P. i. inflata, leading to a more tubular shape (Figure 3C). No such cell-number differences were found in D2. Notably, cell numbers did not appreciably increase from the young bud to the mature flower in any of the domains.
Thus, the tube-length difference of mature flowers, as measured along the midrib, is controlled by a combination of cell length and cell number, with cell number the most important contributor. The cell-number differences are laid down in D1 early in floral development, while differential cell elongation takes place in later stages.
Five Tube Elongation loci for corolla tube length:
To identify genetic factors underlying D1 length differences, we performed QTL mapping in the WI-BILs and WP-BILs. Because the relatively small sizes of our populations and localized segregation distortion reduce QTL detection power and may introduce bias in effect estimation (see, e.g., Broman 2001), we mapped QTL twice in independent experiments with BILs in different growing stands (pots or open soil; see materials and methods). QTL and possible epistatic interactions were inferred only when consistently detected in the two experiments, thereby limiting sampling bias in effect estimation.
In the WI-BILs, two D1 QTL were detected (Tube Elongation 1 (TBE1) and TBE2; Figure 4, B and C; Table 2). Profiles are given only for growing stand 1. Those of stand 2 were essentially the same with slight differences in peak height only. P. i. inflata alleles had a negative effect, as expected. Analysis of two-way interactions between these loci revealed essentially complete additivity (data not shown). No other loci were found to interact with the QTL in a genome-wide search. The two additive effects of P. i. inflata D1 QTL were roughly equal and together explained 58% of total phenotypic difference (in centimeters) between the parents.
Figure 4.—

QTL maps of D1 length loci. (A) Diagram to show how a length increase of D1 (red) affects floral tube shape, if D2 length remains constant. The resulting difference in shape is essentially that of P. a. parodii (top) and P. i. inflata. (B–F) QTL likelihood profiles for chromosomes with significant associations with D1 length. Profiles are given only for the experiment in growing stand 1. Profiles for stand 2 were essentially the same, with slight differences in peak height only. TBE1 and TBE2 are derived from the WI-BIL population; TBE3-5 is derived from the WP-BILs. The chromosome maps are given below the images, with black tick marks indicating the position of markers. The chromosome numbers are given below the maps. The marker closest to the QTL likelihood maximum is named below the chromosome. The x-axes are given in centimorgans; the y-axes are given in LOD units. The horizontal lines around LOD = 3 are the significance thresholds as determined by permutations.
TABLE 2.
Comparisons and summaries of QTL for all traits analyzed in replicated trials
| Stand 1
|
Stand 2
|
||||||||||
|---|---|---|---|---|---|---|---|---|---|---|---|
| WI nectar volume [N = 60 × 4 × (10–40)]
|
WI nectar volume (N = 48 × 1 × 5)
|
||||||||||
| Chromosome | Marker | 2a | Standard error |
P | % PVE | ΔP (% μl) | 2a | Standard error |
P | % PVE | ΔP (% μl) |
| VI | W27 | −2.91 | 0.59 | <0.001 | 33.3 | 48.5 | −2.88 | 0.95 | 0.006 | 17.7 | 48.0 |
| II | W87 | −2.42 | 0.62 | <0.001 | 16.6 | 40.3 | −1.94 | 0.81 | 0.02 | 10.7 | 32.0 |
| ∑ −5.33 μl | 49.9 | 88.8 | ∑ −4.82 μl | 28.4 | 80.0 | ||||||
| WI D1 length (N = 74 × 1 × 5)
|
WI D1 length (N = 56 × 1 × 5)
|
||||||||||
| Chromosome | Marker | 2a | Standard error |
P | % PVE | ΔP (% cm) | 2a | Standard error |
P | % PVE | ΔP (% cm) |
| VII | S81 | −0.19 | 0.04 | <0.001 | 28.6 | 29.6 | −0.18 | 0.05 | 0.001 | 24.5 | 28.0 |
| III | S131 | −0.18 | 0.06 | 0.004 | 11.8 | 28.0 | −0.19 | 0.07 | 0.009 | 11.5 | 29.6 |
| ∑ −0.37 cm | 40.4 | 57.6 | ∑ −0.37 cm | 36.0 | 57.6 | ||||||
| WP D1 length (N = 63 × 1 × 5)
|
WP D1 length (N = 63 × 1 × 5)
|
||||||||||
| Chromosome | Marker | 2a | Standard error |
P | % PVE | ΔP (% cm) | 2a | Standard error |
P | % PVE | ΔP (% cm) |
| II | P58 | +0.57 | 0.07 | <0.001 | 34.1 | 20.5 | +0.54 | 0.08 | <0.001 | 33.6 | 19.5 |
| IV | P63 | +0.51 | 0.08 | <0.001 | 18.0 | 18.4 | +0.42 | 0.09 | <0.001 | 15.2 | 15.2 |
| VI | P51 | +0.36 | 0.07 | <0.001 | 17.8 | 12.9 | +0.30 | 0.08 | <0.001 | 14.1 | 10.8 |
| ∑ +1.44 cm | 69.9 | 51.8 | ∑ +1.26 cm | 62.9 | 45.5 | ||||||
QTL nomenclature is given as in the likelihood profiles. PVE denotes the percentage of total phenotypic variance explained by the QTL. The additive effect (2a) is the phenotypic difference conferred by homozygous replacement of a W138 allele for a wild species allele. The sum of QTL additive effects is denoted as ∑. Standard errors are given for the estimate of 2a. The P-values give the probability of a locus contributing to the multiple regression model fit, according to an F distribution. The difference between parental lines accounted for by a QTL is given as ΔP, in units of measurement.
The WP-BILs revealed three QTL for D1 length (TBE3, TBE4, TBE5, Figure 4, D–F, Table 2). Profiles are given only for growing stand 1. Those of stand 2 were essentially the same with slight differences in peak height only. At each QTL, P. a. parodii alleles increased length. Together, D1 QTL explained 52% of total difference (in centimeters) between the parental strains, with the two strongest ones accounting for 21% (TBE3) and 18% (TBE4). The three QTL acted additively in analysis of two-way interactions. A genome-wide search failed to detect epistatic interactions of TBE3-5 with any other locus.
All five loci are on different chromosomes, allowing the extrapolation that tube-length difference between P. a. parodii and P. i. inflata can be explained by at least five genetic changes. Although total flower size and D1 were significantly larger in open soil trials as compared to pots, no genotype by environment (G × E) interaction was evident for any of the TBE loci. Finally, in genome-wide analysis of epistasis in WI-BIL and WP-BIL populations, no additional TBE loci that acted in pairs but had no main effects on their own were identified.
Internal morphology is controlled by a major QTL for growth of the ventral stamens:
The position of the style vs. the stamens is a characteristic difference between P. a. parodii and P. i. inflata (Figure 1, C and F) and more generally between subspecies of P. axillaris and P. integrifolia. It is likely that the exserted stigma in P. axillaris maximizes exposure to a hovering moth pollinator, whereas the shorter style and extended ventral stamens of P. integrifolia may facilitate a bee's entry into the flower and the deposition of pollen on its body.
We investigated the inheritance of this trait by QTL mapping in the WI-BILs and WP-BILs. The separation of style and stamens was ranked between 0 (W138 condition) and +2 (P. inflata condition) in five flowers per line, and a line-specific score was obtained by averaging. The pure P. axillaris condition would classify as −1 in this system, but this arrangement was not fully penetrant in our inbred populations and could not be reliably scored. Scorable phenotypic variation was observed only in the WI-BILs, and its distribution was highly negatively skewed and noncontinuous. Therefore, we employed standard CIM in conjunction with nonparametric Kruskal-Wallis mapping to localize significant QTL.
A single QTL (STA1) was observed on chromosome VI (Figure 5A). Because a reliable estimate of additive effects and phenotypic variance could not be obtained by statistical means, we produced an IL that substituted a portion of chromosome VI around the maximum-likelihood position obtained by CIM. As can be seen in Figure 5B, this IL reproduced a considerable part of the style-stamen arrangement. Most notably, this phenotype appears to be produced by extension growth of two ventral stamens only, leaving the length of the style and the other three stamens unaffected.
Figure 5.—
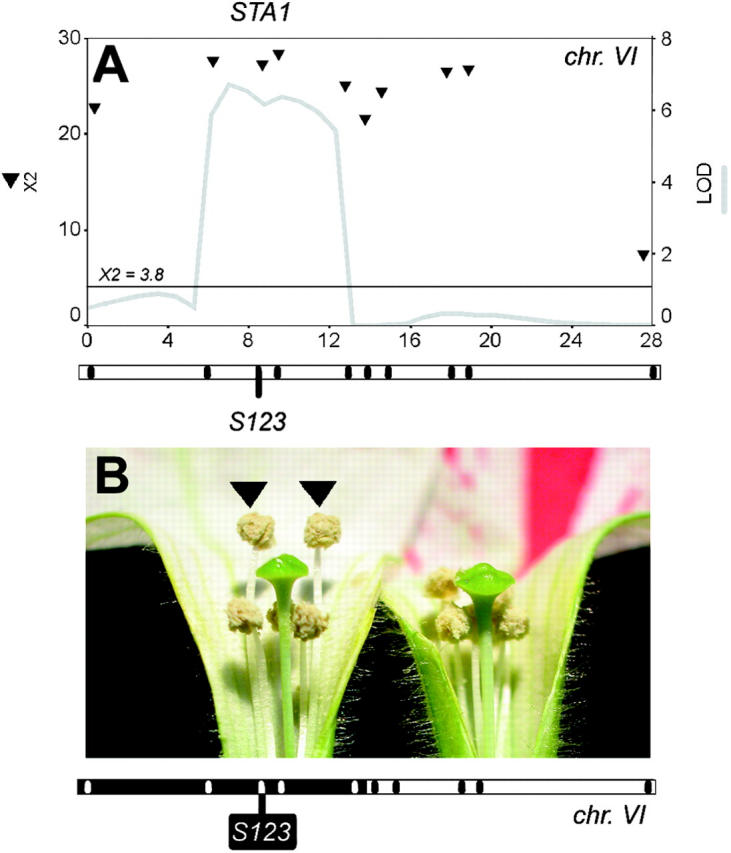
Mapping and effects of the STA1 locus for style-stamen arrangement. (A) QTL map for stamen style-stamen arrangement in the WI-BIL population. Likelihood profiles as obtained by CIM are given as a gray line. χ2 scores obtained by Kruskal-Wallis mapping are given as black triangles. Chromosome maps are below the images, with black tick marks indicating the position of markers. The marker closest to the QTL likelihood maximum is named below the chromosomes. The chromosome numbers are given below the maps. The x-axes are given in centimorgans the y-axes are given in LOD units (right axis) or χ2 values. The horizontal line at X2 = 3.8 gives the significance threshold of a χ2 distribution with 1 d.f. (B) Phenotype of the STA1 introgression line. The position of the P. i. inflata chromosome segment introgressed into W138 is given in black on the chromosome map below the graph. Note that in the IL, the two ventral stamens extend above the style (arrows), an arrangement that is typical of P. i. inflata.
We conclude that much of the characteristic arrangement of reproductive organs in whorls three and four is under control of at least one QTL of major effect that controls growth of the stamen filaments. This QTL is likely to be subordinate to a more generally operating system that controls dorsal-ventral asymmetry.
Physiological distinctions in nectar volume and composition:
It is well known that hawkmoth flowers produce larger quantities of nectar than bee flowers (Baker and Baker 1983). This difference probably relates to a hawkmoth's larger body weight and hovering feeding habit, which are energy demanding. In addition, two parameters of sugar composition appear to distinguish these types of flowers (Baker and Baker 1983). First, hawkmoth flowers usually have more dilute nectars, whereas bee nectars tend to be concentrated. Second, hawkmoth flowers are often rich in sucrose, while bee flowers are usually rich in the sucrose monomers glucose and fructose.
We determined nectar volumes in individual flowers of P. i. inflata, P. a. parodii, and W138. We used inflorescences of which the youngest open flower had its anthers dehisced and collected only nectar from the flower that was one plastochron older. The standing nectar volumes were strikingly different between P. i. inflata and P. a. parodii (Table 1). W138 was significantly different from both wild species (Table 1).
The size or internal histological structure of nectaries of P. a. parodii and P. i. inflata revealed no obvious differences that could explain this observation (Figure 6A). We did a number of simple tests to identify possible other origins of nectar volume differences. One might be floral shape, which could affect evaporation. When flowers were kept closed to prevent evaporation, nectar volumes did not appreciably differ from open conditions (not shown). We reciprocally grafted branches of P. a. parodii or P. i. inflata onto untrimmed stocks. Scions always produced their species-characteristic nectar volumes, regardless of the direction of grafting (Figure 6B) or the size of the scion relative to the foliage of the stock (not shown). Thus, there are most likely physiological distinctions of the nectaries themselves that affect nectar production. These data do not, however, assess a possible influence of floral size (biomass) on nectar volume (see next section).
Figure 6.—

Nectar characteristics and QTL mapping. (A) Transverse section through a mature, secreting nectary of P. i. inflata and P. a. parodii. The scale of the pictures is identical. (B) Reciprocal grafting experiment with either P. i. inflata as scions on a P. a. parodii stock (I-scion) or vice versa (P-scion). Scions 1–2 denote independent grafts. The pure, untreated species are labeled I (P. i. inflata) or P (P. a. parodii). The dots give the mean of the sample (sample indicated as N), and the lines give the 95% confidence interval. (C–E) Likelihood maps for nectar volume QTL VOL1 and VOL2 and sugar ratio QTL RAT1. For VOL1 and VOL2, profiles are given only for the experiment in growing stand 1. Profiles for stand 2 were essentially the same, with some differences in peak height due to difference in power of the experiment (see text and Table 2). The RAT1 profile represents the single experiment done for this trait. The chromosome maps are given below the images, with black tick marks indicating the position of markers. The marker closest to the QTL likelihood maximum is named below the chromosome. The chromosome numbers are given below the maps. The x-axes are in centimorgans; the y-axes are in LOD units. The horizontal line around LOD = 3 is the significance threshold as determined by permutations. (F) Confirmation of the predicted effect of the nectar volume QTL, VOL2. The position of the P. i. inflata chromosome segment introgressed into W138 is given in black on the chromosome map below the graph. Dots give the means of the samples from the IL or its control (W138). Sample size is indicated with N; lines give the 99% confidence interval.
With regard to composition, three sugars (glucose, fructose, and sucrose) were identified in the nectars. In average concentration (as the sum of the three sugars), P. a. parodii nectar was approximately five times more dilute than P. i. inflata nectar or W138 nectar (Table 1), indicating that part of the volume difference is in relative water contributions. The ratios of sucrose vs. the hexoses (Table 1, sugar-index U) differed between P. a. parodii and P. i. inflata. W138 was intermediate, with a tendency toward P. i. inflata (Tables 1 and 2). Both concentration and sugar index showed a substantial environmental variability. Consequently, statistical differences between parental strains of the BILs were relatively small.
Nectar analyses on a wider range of subspecies of both P. axillaris and P. integrifolia (not shown) gave very similar conclusions and indicate that the nectar distinctions between P. a. parodii and P. i. inflata are representative for their species as a whole.
Two VOLUME loci control nectar volume by distinct mechanisms:
QTL analyses were used to identify genetic loci that control nectar volume (VOLUME, or VOL, loci). The same replication strategy with different growing stands was taken as for D1 morphology, so as to limit sampling bias in QTL-effect estimation. In addition, environmental variance was kept under control by analyzing larger numbers of plants per line and 10–40 flowers per plant in stand 1.
In the WI-BILs, two nectar-volume QTL were detected, at which the P. i. inflata allele had a decreasing effect (VOL1 and VOL2, Figure 6, C and D, Table 2). Likelihood profiles are given only for growing stand 1. Those of stand 2 were essentially the same but with differences in peak height (see also Table 2). The stand 1 experiment was more powerful, as expected, and explained more of total phenotypic variance. A homozygous allelic substitution at VOL2 explained up to 49% of total difference (in microliters) between the parental strains. VOL1 explained up to 40% of parental difference. No epistatic interactions were detected either between VOL1 and VOL2 or with any other locus in a genome-wide screen. No G × E interactions were found for VOL1 and VOL2. In the WP-BILs, no putative QTL met the statistical criteria (not shown).
To address how the loci VOL1 and VOL2 may control nectar volume, we assessed their contribution to a multiple-regression model in analysis of covariance with total flower size, measured as the diameter of the floral limb as indicator. In such models, VOL2 explained highly significant proportions of phenotypic variance (17%, P < 0.001), whereas the contribution of VOL1 was completely eliminated (1%, P = 0.235). Because flower size is positively correlated with nectar volume (r = 0.58, P < 0.01), these data suggest that VOL1 affects volume pleiotropically by decreasing flower size. We indeed found that VOL1 colocalizes with a flower-size QTL (not shown). In contrast, VOL2 is more likely to affect nectary physiology.
The summed additive effects of both P. i. inflata QTL (up to 89% parental difference in microliters) are large, considering that substantial environmental variance and measurement error is typical of nectar volume data in inbred strains (see Table 1). We independently confirmed the effect of VOL2 in an introgression line that contains a segment of P. i. inflata chromosome VI around VOL2 in an otherwise pure W138 genetic background. This line is the same as in Figure 5B and was a large-flowered, vigorous plant. As shown in Figure 6F, the homozygous IL had an average nectar volume that matched the predictions from QTL mapping, decreasing the standing volume by ∼50%. Moreover, the 99% confidence intervals of nectar volumes in the IL did not overlap with those of W138.
The RATIO locus controls sucrose-hexose ratios:
Sugar concentration and composition were analyzed by QTL mapping. Sugar-ratio and total sugar concentration were analyzed in a single trial on pooled nectars of 7–10 different flowers from a single plant.
For total sugar concentration, no significant QTL could be detected. For the sugar-index (U), a single QTL RATIO (RAT1) was detected on chromosome IV in the WI-BIL population (Figure 6E, Table 2). This locus explained 57% of parental difference (measured in U) and 41.5% of total phenotypic variance. The P. i. inflata allele decreased the ratio as expected, which is consistent with the activity of, e.g., an invertase. No such QTL could be detected in the WP-BIL population. RAT1 does not coincide with the volume loci VOL1 and VOL2. Thus, volume has no apparent genetic correlation with sugar composition. This could be confirmed by direct volume-composition correlation (r = 0.147, P = 0.334). In analysis of covariance, controlling for variation in sugar ratio did not affect the model fit for nectar volume or any of the VOL loci.
We conclude that the typical volume and sugar composition differences of the Petunia syndromes have evolved convergently, not correlatively. Because of the substantial variance in sugar-ratio data (Table 1) and the single replication of the mapping experiment, the estimated contribution of RAT1 to the total phenotypic variance must be taken as a first indication.
Fragrance differences are controlled by enzymatic differentiation in the phenylpropanoid pathway:
Night-pollinated flowers often emit heavy fragrances, which are under circadian control and peak in darkness (Loughrin et al. 1991; Kolosova et al. 2001; Verdonk et al. 2003). This is consistent with nocturnally active pollinators, for which olfactory cues may be of particular importance.
We determined the components of floral scent in P. i. inflata, P. a. parodii, and W138. P. a. parodii produced a complex fragrance of various phenylpropanoids and a large total output (Figure 7A). In contrast, P. i. inflata produced only a single major volatile phenylpropanoid (benzaldehyde) yielding a lower total output (Figure 7A). The fragrance composition of W138 resembled P. a. parodii in terms of complexity, with some qualitative differences, but it was of low intensity (note the log scale in Figure 7A). Fragrance analyses gave similar results for a variety of P. axillaris and P. integrifolia accessions (M. E. Hoballah, unpublished results), indicating that P. a. parodii and P. i. inflata are representative for their species.
Figure 7.—

Fragrance. (A) Floral fragrance composition of species and lines. Odors were collected from the headspace of individual flowers and analyzed by gas chromatography coupled to mass spectrometry. Note that the scale is logarithmic (log com). The total amount of volatile produced (average ± SE in nanograms/flower/4 hr) is indicated in the top right of the panels: 1, benzaldehyde; 2, benzylalcohol; 3, methylbenzoate; 4, phenylethylalcohol; 5, methylsalicilate; 6, eugenol; 7, vanillin; 8, isoeugenol 1; 9, isoeugenol 2; 10, benzylbenzoate; 11, benzoic acid; 2, hydroxy, phenyl methyl ester. (B and C) QTL maps for fragrance intensity per flower on WI-BILs chromosome VI (B) or WP-BILs chromosome VII (C). Likelihood profiles obtained by CIM are indicated by a shaded line. Solid lines and dashed lines in B denote profiles obtained by independent observers. χ2 scores per marker from Kruskal-Wallis mapping are given as solid triangles or solid dots. Dots or triangles denote scores obtained by independent observers. The chromosome maps are given below the images, with black tick marks indicating the position of markers. The marker closest to the QTL likelihood maximum is named below the chromosomes. The chromosome numbers are given below the maps. The x-axes are given in centimorgans; the y-axes are given in LOD units (right axis) or χ2 values. The horizontal line at X2 = 3.8 gives the significance threshold of a χ2 distribution with 1 d.f.
To gain insight into the inheritance of fragrance differences, we performed a QTL analysis in the WI-BILs and WP-BILs. In the WI-BILs, fragrance intensity was assayed by nose by two independent observers scoring multiple flowers per inbred line on a scale from 0 (not fragrant) to 2 (clearly fragrant). These were averaged into a line-specific score, which was used for QTL analyses. In the WP-BILs, experiments were performed similarly, but by a single experimenter in a single trial. These led to highly negatively skewed, discontinuous distributions in both populations. We therefore searched for QTL by nonparametric Kruskal-Wallis mapping, in addition to CIM.
The WI-BILs revealed a single QTL on chromosome VII (SCE1, Figure 7B). It is notable that SCE1 localized at very similar positions in the two independent data sets, providing confidence that fragrance mapping is relatively resistant to subjective odor perception. In the WP-BILs, a single QTL (SCE2) was detected on chromosome VII as well (Figure 7C). Remarkably, both the P. i. inflata and P. a. parodii QTL alleles enhanced the fragrance. Thus, both species carry a functional allele at a readily detectable scent-output locus, which must be lacking from W138.
Taking these observations together suggests that P. i. inflata carries a functional fragrance system (SCE1), but that it lacks a few biosynthetic enzymes in comparison to P. axillaris (simple fragrance). To test this, we selected one particular WI-BIL inbred line (WI-25) that contained a largely complete P. i. inflata genome (80% of the genetic map) except for chromosomes III and IV, which were intact substitutions from W138. Retaining the scent locus SCE1, this line produced a fragrance that resembled P. a. parodii in both complexity and intensity (Figure 7A). The qualitative composition was the same with regard to the three major compounds (benzaldehyde, methylbenzoate, and benzylalcohol), but differed in a few others. These other compounds (e.g., methylsalicylate, eugenol, vanillin) were typically detected in accessions of subspecies P. axillaris axillaris (M. E. Hoballah, unpublished results). It is likely that components of their biosynthetic pathways are carried by W138 from an ancient P. a. axillaris ancestry and that these were inherited through chromosomes III and IV.
These data show a pattern of genetic complementation, in which biosynthetic pathways are contributed by W138, while the ability to functionally use them is contributed by P. i. inflata. P. a. parodii carries both functional systems.
DISCUSSION
The Petunia species integrifolia and axillaris show a remarkable degree of divergence in pollination syndromes, which are typical for bee and hawkmoth flowers in each tested aspect. The present-day difference is large enough for P. axillaris to have once been classified as subgenus pseudonicotiana (Fries 1911), its floral resemblance to Nicotiana subgenus petunioides being more conspicuous than to P. integrifolia. While a detailed species-based phylogeny of Petunia is not yet available, mutations in the AN2 gene suggest that a colored ancestor has given rise to white P. axillaris types at least twice independently (Quattrocchio et al. 1999). If so, one might expect the pollination syndromes to have arisen relatively quickly through mutations of large effect. This study aimed to specify the most important phenotypic characters that distinguish these Petunia species and to transfer genetic loci for these differences into inbred strains with active transposable elements. Although outstanding examples of pollination syndromes can be found in many families of plants (Proctor et al. 1996), genetic studies have been restricted to species with few molecular tools (e.g., Bradshaw et al. 1998). Conversely, the most commonly used genetic models, such as Arabidopsis, maize, and Antirrhinum, lack divergence for pollination syndromes. The approach described here for Petunia should unlock genetic variation for pollination syndromes for molecular investigation.
Petunia pollination syndromes are defined by four general aspects: color, morphology, nectar, and fragrance. For all traits, our QTL analyses reveal loci of large additive effect, relative to variances seen in inbred parental strains. This may appear at first glance as a genetic architecture of major QTL, as has been proposed for Mimulus pollination syndromes (Bradshaw et al. 1998). However, this study requires some caution in declaring QTL to be of major effect. QTL effects in small populations, like ours, can be subject to substantial overestimation by selection bias (Beavis 1994; Broman 2001). This effect concerns mainly weak QTL that are at the detection limit or stronger QTL with large nongenetic variances. The consequence would be an erroneous impression of major QTL underlying the bulk of trait variation. In addition, our QTL may consist of multiple smaller loci in genetically unresolved clusters. This is a pertinent issue in our system, where linkage maps are of limited resolution.
To minimize selection bias, we have accepted QTL only when consistently detected in different environments and in replicated genotypes (BILs), because these represent strong effects that can be reliably estimated. The nectar volume locus VOL2 particularly underscores this, as its effect in an introgression line precisely matches prediction from QTL mapping, despite the large variances that characterize this trait. It is also noteworthy that QTL effects in the different trials were very similar, with modest standard errors, indicating that the estimates are reliable (Table 2). The problem of short linkage maps for QTL analyses cannot be addressed at this point. Recombination suppression presents a biological reality in Petunia (see also Strommer et al. 2002), which may be of interest in itself if genome rearrangements between the species underlie it. With the caveats of population size and map resolution taken into consideration, the effect estimates of the loci reported here can serve as solid guidelines. Whether they represent major QTL for specific developmental and physiological processes requires detailed phenotypic analyses and, ultimately, molecular cloning.
The summed additive effects of the TBE loci span half the D1-length difference between parental strains of each BIL population. Judging from our morphometric data, the TBE loci control cell length and cell number, both temporally and spatially. Such distinct cellular differences argue in favor of a relatively simple genetic model in which the TBE loci encode a few genes for specific developmental processes, rather than many genes of small effect. Although the definition of D1 as a floral subdomain remains ad hoc within the context of this study, from a developmental genetic standpoint one may speculate on a homology to the petiole of the leaf. The same argument applies to the STA1 locus, which appears to control growth of only the two ventral stamens in an introgression line. This phenotype is not congruent with a multi-gene genetic model, but is more likely to involve a specific growth parameter within a dorsal-ventral asymmetry system, such as that controlled by the CYCLOIDEA-like genes (Luo et al. 1999). In-depth studies of the TBE and STA loci should identify further details of the phenotypes that they confer, which may allow the design of transposon-tagging screens for molecular cloning.
The additive effects of nectar volume loci VOL1 and VOL2 amount to almost the entire difference between P. i. inflata and W138. It is clear that nectar volume is sensitive to environmental fluctuation and that only large allelic differences will stand out from background variation. VOL2 particularly appears to be of major effect, with a confirmed 50% parental difference in an introgression line. We could not identify nectar QTL in the WP-BIL population. We suspect that larger populations are necessary to detect these. Our reciprocal grafting and mapping studies indicate that nectar volume has a pleiotropic component with total floral size (VOL1) and a physiological component that probably resides in the nectaries themselves (VOL2). Although we cannot exclude that the correlation of VOL1 with flower size is due to genetic linkage, pleiotropy makes logical sense and is at this point the most parsimonious assumption. With regard to nectary physiology, the only known gene implicated in nectar secretion, Petunia NEC1, has been hypothesized to mediate sugar transport into the apoplast, creating an osmotic gradient that drives the flow of water (Ge et al. 2000). It is notable that VOL2 and the sugar-index locus (RAT1) do not colocalize, which suggests that volume and sugar composition can be uncoupled. A careful analysis of nearly isogenic lines for VOL2 should provide valuable insight into the physiology of nectar secretion, a process that is poorly understood despite its general importance for plant-animal interactions.
Fragrance analysis shows an increased qualitative complexity and intensity in P. a. parodii as compared to P. i. inflata. This results from addition of several volatile phenylpropanoids to a basic P. i. inflata scent that has benzaldehyde as the single major compound. Although the role of fragrance complexity in pollinator foraging remains to be established, a complex odor may serve as a species-specific fingerprint and recognition mark for olfactory-oriented nocturnal pollinators. Surprisingly, P. i. inflata supported production of a P. a. parodii-like fragrance in terms of both complexity and total output when two of its chromosomes were replaced by W138 copies. This suggests that the difference between the species is not very extensive and may involve a limited number of enzymatic activities. The major compounds of P. a. parodii (benzaldehyde, benzylalcohol, and methylbenzoate) are direct derivatives of a common precursor (benzoic acid; Dudareva and Pichersky 2000). Differences are likely to be found in enzymes such as benzoic acid salicylic acid methyltransferase (Negre et al. 2003) and benzaldehyde reductase. The scent QTL, SCE1 and SCE2, appear to control fragrance on the level of general output and are easily detected by the human nose. Because the low alleles at these loci are both of W138 origin (chromosome VII), they may correspond to a single locus that carries a mutation in W138. A role for this locus in the evolution of the species difference is doubtful, although it will be of considerable interest for the dissection of genetic pathways that lead to floral scent.
The breeding scheme we used to analyze QTL in a P. hybrida (W138) genetic background anticipates the use of dTph1 transposons as molecular tools (Koes et al. 1995; Stuurman et al. 2002; Vandenbussche et al. 2003). In the absence of extensive genomic information, insertion mutagenesis will be important for identification, verification, or modification of genes associated with QTL effects. Direct forward mutation screens or reverse inactivation of candidate genes and genes differentially expressed in near-isogenic lines can be envisaged. The use of forward mutagenesis for cloning QTL requires that mutants can be identified within the normal phenotypic variance of the trait. The strategy would require QTL of strong effect and carefully defined phenotypes. In addition, dTph1 elements should be stabilized to reduce variance from excisions and background mutations. A two-element dTph1 system within a W138 genetic background has been constructed (Huits et al. 1995; J. Stuurman, unpublished results), which should enable quantitative genetic analyses in stabilized insertion stocks. A definition of QTL in W138 allows the direct comparison of QTL alleles, natural or induced, in a single reference genetic background.
It must be noted that W138 has most probably been derived from crosses between P. integrifolia and P. axillaris ancestors. Fixation of alleles from these ancestors at QTL loci may have precluded their detection in the BIL populations described here. The extent to which this has influenced our study remains unclear. However, the use of reciprocal inbred line populations should have allowed QTL detection in at least one of the BIL populations. Another caveat may be that QTL detected in this study may represent peculiarities of W138, rather than genuine species differences. Analysis of QTL in crosses of pure wild species will be required to investigate their effects and interactions in biologically relevant genotypes. Nonetheless, all the species-derived QTL alleles in the crosses of this study have the additive effects expected from their donor parent. A pattern this clear can serve as an indication that most of these loci will also distinguish the species.
One of the major tenets of pollination biology is that complex floral syndromes differentially attract animals and/or optimize the efficiency of pollen carryover that results from visitation. A large body of theoretical and empirical work has been addressing this topic (Proctor et al. 1996; Chittka and Thomson 2001). However, finding out how genetic modifications cause change requires the construction of specialized strains that differ in separate components of the syndromes to be tested in pollinator foraging assays or field studies (Bradshaw and Schemske 2003). Given the genetics that we have described and the technical possibilities of a Petunia model, it should now be possible to investigate the individual biological roles of syndrome components in detail.
Acknowledgments
We thank Ronald Koes (Free University, Amsterdam) for providing plant materials (P. parodii S7 and P. inflata S6) and Tom Gerats (University of Nijmegen) for advice on maps and markers. We also thank Ted Turlings (University of Neuchatel) for providing access to gas-chromatography-coupled mass-spectrometry equipment. Thanks go to Sam Zeeman (University of Bern) for help and advice with HPLC. We thank Christopher Ball for help in housing and growing plants. This work was supported by the Swiss National Science Foundation through the National Centre for Competence in Research “Plant Survival” and by the Canton of Bern.
References
- Ando, T., 1996. Distribution of Petunia axillaris (Solanaceae) and its new subspecies in Argentina and Bolivia. Acta Phytotax. Geobot. 47: 19–30. [Google Scholar]
- Ando, T., M. Kurata, S. Sasaki, Y. Ueda, G. Hashimoto et al., 1995. Comparative morphological studies on infraspecific taxa of Petunia integrifolia (Hook.) Schinz et Thell. (Solanaceae). J. Jpn. Bot. 70: 205–217. [Google Scholar]
- Ando, T., M. Nomura, J. Tsukahara, H. Watanabe, H. Kokubun et al., 2001. Reproductive isolation in a native population of Petunia sensu Jussieu (Solanaceae). Ann. Bot. 88: 403–413. [Google Scholar]
- Baker, H. G., and I. Baker, 1983 Chemistry of floral nectar, pp. 126–152 in The Biology of Nectaries, edited by B. Bentley and T. Elias. Columbia University Press, New York.
- Basten, C. J., B. S. Weir and Z-B. Zeng, 2002 QTL cartographer, version 1.16. Department of Statistics, North Carolina State University, Raleigh, NC.
- Beavis, W. D., 1994 49th Annual Corn and Sorghum Research Conference, pp. 252–268. American Seed Trade Association, Washington, DC.
- Bradshaw, H. D., and D. W. Schemske, 2003. Allele substitution at a flower colour locus produces a pollinator shift in monkeyflowers. Nature 426: 176–178. [DOI] [PubMed] [Google Scholar]
- Bradshaw, H. D., S. M. Wilbert, K. G. Otto and D. W. Schemske, 1995. Genetic mapping of floral traits associated with reproductive isolation in monkeyflowers (Mimulus). Nature 376: 762–765. [Google Scholar]
- Bradshaw, H. D., K. G. Otto, B. E. Frewen, J. K. McKay and D. W. Schemske, 1998. Quantitative trait loci affecting differences in floral morphology between two species of monkeyflower (Mimulus). Genetics 149: 367–382. [DOI] [PMC free article] [PubMed] [Google Scholar]
- Broman, K., 2001. Review of statistical methods for QTL mapping in experimental crosses. Lab Anim. 30: 44–52. [PubMed] [Google Scholar]
- Chittka, L., and J. D. Thomson, 2001 Cognitive Ecology of Pollination. Cambridge University Press, Cambridge, UK.
- De Keukeleire, P., T. Maes, M. Sauer, J. Zethof, M. van Montagu et al., 2001. Analysis by transposon display of the behaviour of the dTph1 element family during ontogeny and inbreeding of Petunia hybrida. Mol. Gen. Genomics 265: 72–81. [DOI] [PubMed] [Google Scholar]
- Dudareva, N., and E. Pichersky, 2000. Biochemical and molecular genetic aspects of floral scents. Plant Physiol. 122: 627–633. [DOI] [PMC free article] [PubMed] [Google Scholar]
- Dudareva, N., L. Cseke, V. M. Blanc and E. Pichersky, 1996. Evolution of floral scent in Clarkia: novel patterns of S-linalool synthase gene expression in the C. breweri flower. Plant Cell 8: 1137–1148. [DOI] [PMC free article] [PubMed] [Google Scholar]
- Faegri, K., and L. Van der Pijl, 1979 The Principles of Pollination Ecology. Pergamon, New York/Oxford.
- Fries, R. E., 1911. Die Arten der Gattung Petunia. Kungl. Svensk. Vetensk. Akad. Handl. 46: 1–72. [Google Scholar]
- Ge, Y. X., G. C. Angenent, P. E. Wittich, J. Peters, J. Franken et al., 2000. NEC1, a novel gene, highly expressed in nectary tissue of Petunia hybrida. Plant J. 24: 725–734. [DOI] [PubMed] [Google Scholar]
- Gerats, A. G. M., E. Souer, J. Kroon, M. McLean, E. Farcy et al., 1993 Petunia hybrida, pp. 6.13–6.23 in Genetic Maps: Locus Maps of Complex Genomes, Ed. 6, edited by S. O'Brien. Cold Spring Harbor Laboratory Press, New York.
- Grant, V., 1994. Modes and origins of mechanical and ethological isolation in angiosperms. Proc. Natl. Acad. Sci. USA 91: 3–10. [DOI] [PMC free article] [PubMed] [Google Scholar]
- Horsch, R. B., J. E. Fry, N. L. Hoffmann, D. Eichholtz, S. G. Rogers et al., 1985. A simple and general method for transferring genes into plants. Science 227: 1229–1231. [DOI] [PubMed] [Google Scholar]
- Huits, H. S. M., H. J. W. Wijsman, R. E. Koes and A. G. M. Gerats, 1995. Genetic characterisation of Act1, the activator of a non-autonomous transposable element from Petunia hybrida. Theor. Appl. Genet. 91: 110–117. [DOI] [PubMed] [Google Scholar]
- Koes, R., E. Souer, A. Van Houwelingen, L. Mur, C. Spelt et al., 1995. Targeted gene inactivation in Petunia by PCR-based selection of transposon insertion mutants. Proc. Natl. Acad. Sci. USA 92: 8149–8153. [DOI] [PMC free article] [PubMed] [Google Scholar]
- Kolosova, N., N. Gorenstein, C. M. Kish and N. Dudareva, 2001. Regulation of circadian methyl benzoate emission in diurnally and nocturnally emitting plants. Plant Cell 13: 2333–2347. [DOI] [PMC free article] [PubMed] [Google Scholar]
- Loughrin, J. H., T. R. Hamilton-Kemp, R. A. Andersen and D. F. Hildebrand, 1991. Circadian rhythm of volatile emission from flowers of Nicotiana sylvestris and N. suaveolens. Physiol. Plant 83: 492–496. [Google Scholar]
- Luo, D., R. Carpenter, L. Copsey, C. Vincent, J. Clark et al., 1999. Control of organ asymmetry in flowers of Antirrhinum. Cell 99: 367–376. [DOI] [PubMed] [Google Scholar]
- Manly, K. F., R. H. Cudmore, Jr. and J. M. Meer, 2001. MapManager QTX, cross-platform software for genetic mapping. Mamm. Genome 12: 930–932. [DOI] [PubMed] [Google Scholar]
- Martin, C., and T. Gerats, 1993. Control of pigment biosynthesis genes during petal development. Plant Cell 5: 1253–1264. [DOI] [PMC free article] [PubMed] [Google Scholar]
- Negre, F., C. M. Kish, J. Boatright, B. Underwood, K. Shibuya et al., 2003. Regulation of methylbenzoate emission after pollination in snapdragon and petunia flowers. Plant Cell 15: 2992–3006. [DOI] [PMC free article] [PubMed] [Google Scholar]
- Proctor, M., P. Yeo and A. Lack, 1996 The Natural History of Pollination. Timber Press, Portland, OR.
- Quattrocchio, F., J. Wing, K.van der Woude, E. Souer, N. de Vetten, et al. 1999. Molecular analysis of the anthocyanin2 gene of Petunia and its role in the evolution of flower color. Plant Cell 11: 1433–1444. [DOI] [PMC free article] [PubMed] [Google Scholar]
- Reale, L., A. Porceddu, L. Lanfaloni, C. Moretti, S. Zenoni et al., 2002. Patterns of cell division and expansion in developing petals of Petunia hybrida. Sex. Plant Reprod. 15: 123–132. [Google Scholar]
- Schemske, D. W., and H. D. Bradshaw, Jr., 1999. Pollinator preference and the evolution of floral traits in monkeyflowers. Proc. Natl. Acad. Sci. USA 96: 11910–11915. [DOI] [PMC free article] [PubMed] [Google Scholar]
- Souer, E., A. van Houwelingen, D. Kloos, J. Mol and R. Koes, 1996. The no apical meristem gene of Petunia is required for pattern formation in embryos and flowers and is expressed at meristem and primordia boundaries. Cell 85: 159–170. [DOI] [PubMed] [Google Scholar]
- Strommer, J., A. G. M. Gerats, M. Sanago and S. J. Molnar, 2000. A gene-based RFLP map of Petunia. Theor. Appl. Genet. 100: 899–905. [Google Scholar]
- Strommer, J., J. Peters, J. Zethof, P. de Keukeleire and T. Gerats, 2002. AFLP maps of Petunia hybrida: building maps when markers cluster. Theor. Appl. Genet. 105: 1000–1009. [DOI] [PubMed] [Google Scholar]
- Stuurman, J., F. Jäggi and C. Kuhlemeier, 2002. Shoot meristem maintenance is controlled by a GRAS-gene mediated signal from differentiating cells. Genes Dev. 16: 2213–2218. [DOI] [PMC free article] [PubMed] [Google Scholar]
- Van Berloo, R., 1999. GGT: software for the display of graphical genotypes. J. Hered. 90: 328–329. [Google Scholar]
- Vandenbussche, M., J. Zethof, E. Souer, R. Koes, G. B. Tornielli et al., 2003. Toward the analysis of the Petunia MADS box gene family by reverse and forward transposon insertion mutagenesis: B, C and D floral organ identity functions require SEPALLATA-like MADS box genes in petunia. Plant Cell 15: 2680–2693. [DOI] [PMC free article] [PubMed] [Google Scholar]
- Verdonk, J., R. de Vos, H. A. Verhoeven, M. A. Haring, A. J. van Tunen et al., 2003. Regulation of floral scent production in petunia revealed by targeted metabolomics. Phytochemistry 62: 997–1008. [DOI] [PubMed] [Google Scholar]
- Vos, P., R. Hogers, M. Bleeker, T. Reijans, M. van de Lee et al., 1995. AFLP: a new technique for DNA fingerprinting. Nucleic Acids Res. 23: 4407–4414. [DOI] [PMC free article] [PubMed] [Google Scholar]
- Wang, S., C. J. Basten and Z-B. Zeng, 2004 Windows QTL cartographer 2.0. Department of Statistics, North Carolina State University, Raleigh, NC.
- Wijsman, H. J. W., 1983. On the interrelationships of certain species of Petunia. II. Experimental data: crosses between different taxa. Acta Bot. Neerlandica 32: 97–107. [Google Scholar]