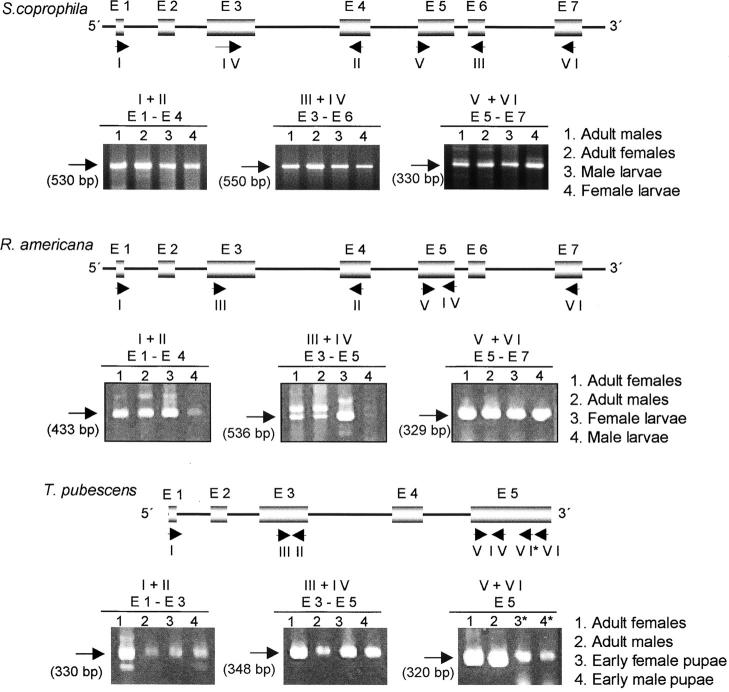
Figure 4.—
Sxl transcription at different developmental stages. The molecular organization of each Sxl gene is provided at the top, showing the products of the RT-PCR reactions. Boxes represent exons (indicated by E), thin lines represent introns, and the locations of the primers are shown by short arrows and identified by Roman numerals. The predicted size of the amplified Sxl fragments is indicated in parentheses under the long arrows. The RT-PCR products were subcloned and sequenced (four subclones for each RT-PCR product were analyzed). The sequence revealed that in those cases where two RT-PCR fragments were produced, only one corresponded to gene Sxl (indicated by the long arrow); the second was nonspecific.

