

Abstract
The complex hexaploid wheat genome offers many challenges for genomics research. Expressed sequence tags facilitate the analysis of gene-coding regions and provide a rich source of molecular markers for mapping and comparison with model organisms. The objectives of this study were to construct a high-density EST chromosome bin map of wheat homoeologous group 2 chromosomes to determine the distribution of ESTs, construct a consensus map of group 2 ESTs, investigate synteny, examine patterns of duplication, and assess the colinearity with rice of ESTs assigned to the group 2 consensus bin map. A total of 2600 loci generated from 1110 ESTs were mapped to group 2 chromosomes by Southern hybridization onto wheat aneuploid chromosome and deletion stocks. A consensus map was constructed of 552 ESTs mapping to more than one group 2 chromosome. Regions of high gene density in distal bins and low gene density in proximal bins were found. Two interstitial gene-rich islands flanked by relatively gene-poor regions on both the short and long arms and having good synteny with rice were discovered. The map locations of two ESTs indicated the possible presence of a small pericentric inversion on chromosome 2B. Wheat chromosome group 2 was shown to share syntenous blocks with rice chromosomes 4 and 7.
HEXAPLOID common wheat (Triticum aestivum L.) is one of the most important staple crops globally. The hexaploid wheat genome is composed of three related diploid genomes designated A, B, and D with seven chromosomes each (2n = 6x = 42). Extensive genetic and cytogenetic characterization of diploid, tetraploid, and hexaploid wheat relatives has made it a model system for the study of allopolyploid evolution.
Due to its extremely large genome size (∼16,000 Mb), whole-genome sequencing is not currently feasible for gene discovery and genome evolution analysis in hexaploid wheat. Expressed sequence tags (ESTs) are segments of sequences from cDNA clones that correspond to mRNA (Adams et al. 1991). The EST sequencing approach targets sequencing of the expressed portions of the genome and is particularly useful for gene discovery and major genomics studies in large-genome species. ESTs can be isolated from a broad range of libraries to maximize the number of genes identified. As of January 2004, 577,538 wheat ESTs were cataloged in the public database at NCBI (http://www.ncbi.nlm.nih.gov/dbEST/dbEST_summary.html). Large-scale EST mapping provides valuable insights into the structure and evolution of genomes. EST mapping studies can be used to assess gene density and distribution, duplication, structural rearrangements, colinearity with related species, and function through comparative genomics (Akhunov et al. 2003a; Sorrells et al. 2003; Qi et al. 2004).
The triplication of genomic content allows wheat to tolerate the loss of chromosomes, arms, and segments (Sears 1954, 1966; Sears and Sears 1978; Endo and Gill 1996). The use of nullisomic-tetrasomic, ditelosomic, and deletion lines missing successive terminal segments allows for the mapping of molecular markers to chromosomes, arms, and chromosome bins within arms. In recent years, aneuploids and deletion lines have been used extensively in mapping studies (Anderson et al. 1992; Gill et al. 1993, 1996a,b; Delany et al. 1995; Faris et al. 2000; Qi and Gill 2001; Sandhu et al. 2001; Weng and Lazar 2002; Akhunov et al. 2003a; Qi et al. 2004). A high proportion of DNA fragments can be mapped within subchromosomal regions using deletion lines because intragenomic polymorphism is not required. Deletion bins along the chromosome arms have been defined as chromosome segments lying between the breakpoints of two deletion lines (Endo and Gill 1996). A National Science Foundation-funded wheat EST project was undertaken with a goal of mapping 10,000 ESTs to chromosome bins in the wheat genome by Southern hybridization using nullisomic-tetrasomic, ditelosomic, and deletion lines. The chromosome karyotypes detailing breakpoints and chromosome bins for the cytogenetic stocks used in the wheat EST mapping project can be found online at http://wheat.pw.usda.gov/west/binmaps/.
The rice (Oryza sativa L.) genome sequence (Goff et al. 2002; Yu et al. 2002; http://rgp.dna.affrc.go.jp/cgi-bin/statusdb/irgsp-status.cgi; http://www.gramene.org/) provides a useful reference for comparative genomics in the cereals. The deletion mapping system of wheat provides a tool to examine colinearity with rice at the subchromosome level. Sorrells et al. (2003) conducted a whole-genome comparative mapping study of wheat and rice using wheat EST and rice sequence data and found that BAC/PAC clones from one or a few rice chromosomes have homology to each wheat homoeologous chromosome group.
The group 2 chromosomes contain several genes of great agronomic importance, including the photoperiod response genes Ppd1, Ppd2, and Ppd3 (Scarth and Law 1983), numerous genes conferring resistance to leaf, stem, and stripe rust and to powdery mildew (McIntosh et al. 2003), the two semidwarfing genes Rht 7 (Worland et al. 1980) and Rht 8 (Worland and Law 1986), the gametocidal genes Gc1-B1a and Gc1-B1b (Tsujimoto and Tsunewaki 1988), and a QTL involved in resistance to preharvest sprouting (Anderson et al. 1993).
The objectives of this study were to (1) construct a high-density EST chromosome bin map of wheat homoeologous group 2 chromosomes, (2) analyze the distribution of EST loci among the genomes and along the chromosome arms, (3) construct a consensus map of group 2, (4) investigate synteny among the group 2 chromosomes, (5) examine patterns of duplication, and (6) assess the colinearity of ESTs mapped on the group 2 consensus map with the rice genome sequence.
MATERIALS AND METHODS
Wheat ESTs were sequenced at the U.S. Department of Agriculture-Agricultural Research Service Western Regional Research Center in Albany, California, from 42 libraries representing a wide range of tissues, developmental stages, and environmental stresses and distributed to the 10 mapping laboratories. Information on the cDNA libraries is available in Zhang et al. (2004) and the development of EST singletons has been described by Lazo et al. (2004). ESTs were mapped to chromosome bin locations on the chromosomes via Southern analysis using a set of deletion lines (Endo and Gill 1996; Qi et al. 2003). DNA for the Southern blots was digested with EcoRI enzyme. The group 2 cytogenetic stocks used were the Chinese Spring nullisomic-tetrasomic (N2AT2B, N2BT2D, and N2DT2A), ditelosomic (Dt2AS, Dt2BL, Dt2DS, Dt2DL), and 11 deletion lines (2AS5, 2AL1, 2BS1, 2BS4/2BL4, 2BS3, 2BL2, 2BL6, 2DS1, 2DS5, 2DL3, and 2DL9) dividing the group 2 chromosomes into 18 bins (Figure 1). Bins are designated by their bounding breakpoints, which in turn are designated by fraction length (FL) values derived from the ratio of the arm with the deletion to the whole chromosome arm (Gill et al. 1996a). Chromosome bin mapping and data verification procedures have been described by Lazo et al. (2004). Loci mapped to group 2 chromosomes by any of the 10 mapping labs were confirmed by the University of Minnesota lab on the basis of the autoradiogram image available in the online database (http://wheat.pw.usda.gov/cgi-bin/westsql/map_locus.cgi).
Figure 1.—

Distribution of EST loci among group 2 chromosome bins. Italicized numbers indicate the gene density ratios (mean over all bins is 1.0); numbers outside parentheses are the observed number of loci; within parentheses are the expected number based on the physical size of the bin. The bin fraction is indicated to the right of each chromosome. The solid horizontal bands on each chromosome depict heterochromatic regions. Hatched horizontal bands are heterochromatic regions not consistently observed (Gill et al. 1991). The figure is based on 854 loci generated from only those ESTs having all restriction fragments mapped and assigned to chromosome bins.
Gene distribution among the genomes and within the chromosome arms:
Tests for random distribution of EST loci among the three genomes and along the chromosome arms were assessed by chi-square analysis of the confirmed set of loci mapping to the chromosomes of homoeologous group 2 (mapping data are available online at http://wheat.pw.usda.gov/cgi-bin/westsql/map_locus.cgi). The analysis was repeated using the subset of 986 loci generated from the 337 group 2 ESTs having all restriction fragments mapped to reduce any bias due to unmapped restriction fragments and different intergenomic polymorphism frequencies. The null hypothesis assumed a proportional distribution of EST loci among each of the three group 2 chromosomes on the basis of their physical length (Gill et al. 1991). Expected values for the number of EST loci between the long and short arms were calculated on the basis of the arm ratio values (1.3, 1.2, and 1.3 for 2A, 2B, and 2D, respectively) from physical measurement of C-banded mitotic chromosomes (Gill et al. 1991). Analysis of the distribution of EST loci between the long and short arms was performed on the subset of 965 loci mapped to chromosome arms or bins (excluding loci mapped only to chromosomes), generated from only those ESTs with all restriction fragments mapped. Analysis of EST distribution along the chromosome arms was performed on the subset of 854 EST loci mapped to chromosome bins (excluding loci mapped only to chromosomes or chromosome arms); generated from only those ESTs with all restriction fragments mapped. To assess EST locus distribution along the chromosome arms, the expected number of EST loci per micrometer for each group 2 chromosome was calculated by dividing the total number of EST loci in the data subset mapping to the particular chromosome by its physical length (Gill et al. 1991). These expectation values were multiplied by the physical length of each bin to determine the expected number of EST loci in the bins. Gene density ratios were calculated by dividing the observed number of EST loci in a particular chromosome, arm, or bin by the expected number.
Construction of group 2 consensus EST map:
ESTs mapped to bins in two or three group 2 chromosomes were assigned to 14 consensus bins, designated CS, 1S, 2S, 3S, 4S, 5S, and 6S on the short arm and CL, 1L, 2L, 3L, 4L, 5L, and 6L on the long arm from the centromere to the telomere (Figure 2; see also supplemental online materials at http://wheat.pw.usda.gov/pubs/2004/Genetics/). Deletion bins were ordered for each homoeologous group 2 chromosome, and ESTs were grouped according to their bin locations in each genome. The consensus bins were defined by ESTs sharing a common mapping pattern, on the basis of restriction fragments from the different genomes being located in syntenous bins. For example, consensus bin CS was defined by ESTs mapped to chromosome deletion bins C-2AS5-0.78, C-2BS1-0.53, and C-2DS1-0.33, while neighboring consensus bin 1S was defined by ESTs mapped to chromosome deletion bins C-2AS5-0.78, C-2BS1-0.53, and 2DS1-0.33-0.47. Some ESTs with loci in only two group 2 chromosomes were mapped to combined consensus bins if the map locations of the loci spanned more than one consensus bin. For example, an EST having mapped loci in chromosome bins C-2AS5-0.78 and C-2BS1-0.53, but no map location for chromosome 2D, could map to consensus bins CS, 1S, or 2S and was therefore assigned to the combined bin CS-2S. However, an EST with mapped loci in chromosome bins C-2BS1-0.53 and C-2DS1-0.33, but no 2A location, could still be assigned to bin CS, because the map locations in 2B and 2D are entirely contained within the bin C-2AS5-0.78. Because all consensus bins, except 4S, were bounded by the superimposed fraction lengths of the chromosome deletion bins onto a single consensus group 2 chromosome (Figure 2), consensus bin fraction lengths were estimated by the superimposed breakpoints of the deletion bins among the three group 2 chromosomes. Distribution of EST loci along the consensus map was assessed by chi-square analysis using the subset of loci mapped to specific consensus bins and generated from ESTs having all restriction fragments mapped to reduce bias due to unmapped fragments. The expected density of EST loci for each consensus bin was calculated by multiplying the total number of loci assigned to all consensus bins by the proportional length of the bin.
Figure 2.—
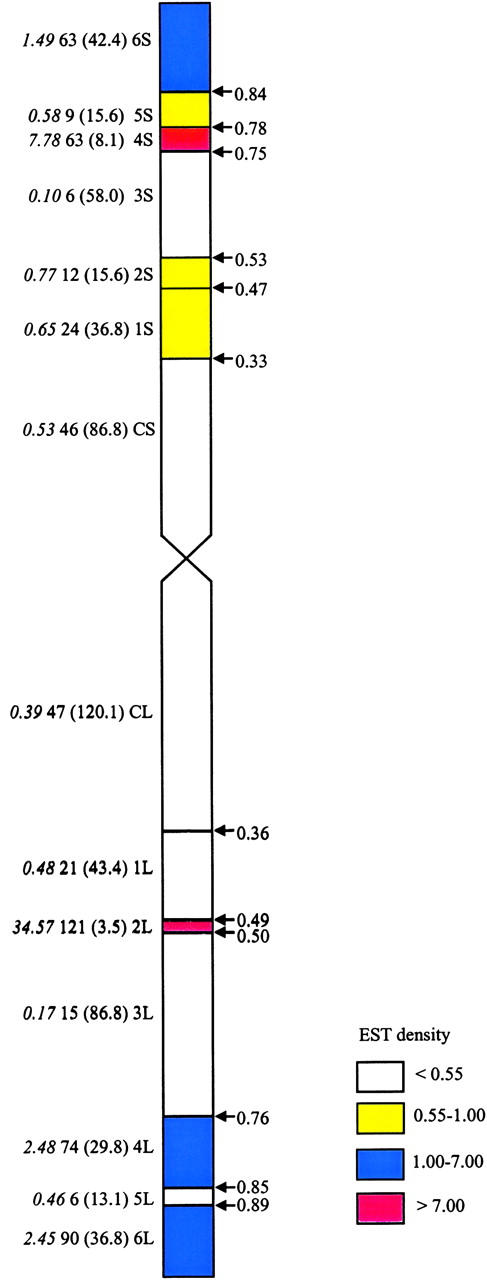
Distribution of EST loci on the group 2 consensus map. Italicized numbers indicate the gene density ratios; numbers outside parentheses are the observed number of loci; within parentheses are the expected numbers based on the physical size of the bin. Consensus bin designations are indicated to the left of the chromosome, and bin fraction is indicated to the right. The figure is based on the subset of ESTs having all restriction fragments mapped and assigned to specific consensus bins.
Detecting anomalies:
ESTs that did not fit into consensus bins due to nonsyntenous map locations among the group 2 chromosomes were sorted by type of anomaly. The autoradiography images were examined for clarity and for unmapped fragments that could confound the interpretation of the anomaly. Anomalies with clear mapping data were investigated for possible explanations, such as (i) unmapped restriction fragments, (ii) structural rearrangement, or (iii) technical error. In the first case, the unmapped restriction fragments may have been located in syntenous bins, while the nonsyntenous mapped fragments may have been interbin duplication events.
Duplications:
ESTs with mapped loci in two different bins within one chromosome were considered interbin duplication events. These were assigned to the consensus map if at least two chromosomes had loci in syntenous bins. ESTs with a minimum of one group 2 locus and at least one locus mapping to a non-group 2 location were considered interchromosome duplication events. This analysis did not take into account differences in hybridization intensity among the restriction fragments. Among ESTs having at least one fragment mapped to a group 2 chromosome and at least one fragment mapped to another homoeologous group, the total number of loci for each non-group 2 bin throughout the hexaploid wheat genome was counted. Chi-square analysis was used to test the randomness of distribution of group 2 ESTs duplicated in the other homoeologous groups. The null hypothesis was a proportional distribution of duplicate EST loci among the other homoeologous groups, such that the number of duplicate loci would be based on the physical size of each chromosome group. Chi-square analysis was also used to test the randomness of the distribution of duplicates among non-group 2 chromosome bins. The null hypothesis was that the frequency of duplicate loci from group 2 in each bin would be equal to the total frequency of all loci mapped to that bin. The expected number of duplicate loci was calculated by multiplying the frequency of all loci occurring in that bin by the total number of duplicate loci mapping to non-group 2 chromosomes. Chi-square analysis was used to test the probability of finding the observed number of duplicate loci in each bin under the null hypothesis.
Wheat-rice comparisons:
The 552 ESTs assigned to the chromosome group 2 consensus map were used to analyze wheat-rice colinearity. The wheat EST nucleotide sequences were compared against the rice BAC/PAC DNA sequences using blastN at NCBI. The statistics of all the high-scoring pairs for any given query-subject pair were calculated and summarized, with the following cutoff parameters: E-value < 1E−15, and 80% sequence identity over at least 100 bp. A binomial distribution was used to test the probability of finding the observed number of matches under the null hypothesis. The null hypothesis was no colinearity (i.e., the matches to rice would be randomly distributed throughout the rice genome). For each bin, the rice chromosome with the largest number of matches was identified. To test for the possibility of colinearity with more than one rice chromosome within a wheat bin, the binomial calculation was repeated for the rice chromosome with the second highest number of matches, after eliminating matches from the most colinear chromosome and then assuming an equal probability of matches occurring on each of the remaining 11 chromosomes.
RESULTS
Distribution of EST loci among the three homoeologous group 2 chromosomes:
As of March 17, 2003, 1110 ESTs generating 2600 confirmed loci were mapped to homoeologous group 2 chromosomes (available online at http://wheat.pw.usda.gov/cgi-bin/westsql/map_locus.cgi), of which 2239 were mapped to specific chromosome bins, with the remaining 361 mapped to chromosomes or chromosome arms. Of the 2600 confirmed loci mapping to homoeologous group 2 chromosomes, 769 loci (29.6%) from 651 EST probes mapped to 2A, 959 loci (36.9%) from 728 probes mapped to 2B, and 872 loci (33.5%) from 725 probes mapped to 2D (Table 1). The chi-square analysis using the confirmed set of data mapping to the chromosomes of homoeologous group 2 indicated a highly significant (P < 0.001) nonrandom distribution of EST loci among the three chromosomes of homoeologous group 2 on the basis of the assumption of proportional distribution of EST loci among the three group 2 chromosomes based on their physical length. Chromosome 2D had a larger than expected number of loci, while 2A had a smaller number. The chi-square analysis was repeated using the subset of 986 confirmed loci generated from the 337 ESTs having all restriction fragments mapped. A total of 302 loci from 253 EST probes mapped to 2A, 360 loci from 265 probes mapped to 2B, and 324 loci from 266 probes mapped to 2D (Table 1). Density ratios and chi-square analyses were similar to the analysis using all ESTs.
TABLE 1.
Number and distribution of EST loci among group 2 chromosomes in wheat
| All ESTs
|
ESTs with all fragments mapped
|
|||||||
|---|---|---|---|---|---|---|---|---|
| Chromosome
|
Chromosome
|
|||||||
| Item | 2A | 2B | 2D | Total | 2A | 2B | 2D | Total |
| Observed | 769 | 959 | 872 | 2600 | 302 | 360 | 324 | 986 |
| Expecteda | 915.5 | 944.8 | 739.7 | 2600 | 347.2 | 358.3 | 280.5 | 986 |
| Deviation | −146.5 | 14.2 | 132.3 | −45.2 | 1.7 | 43.5 | ||
| χ2b | 47.32*** | 12.64** | ||||||
| Density ratioc | 0.84 | 1.02 | 1.18 | 0.87 | 1.00 | 1.16 | ||
** and ***, significant at 0.01 and 0.001 probability levels, respectively.
Based on the assumption of proportional distribution of ESTs among the group 2 chromosomes based on their physical length (Gill et al. 1991).
Probability of a departure from the expected number of loci.
Ratio of observed to expected number of loci.
Distribution of EST loci between the chromosome arms:
Chi-square analysis of the subset of 965 confirmed EST loci having all restriction fragments mapped revealed significant deviations from the expectation that the number of loci on long vs. short chromosome arms was proportional to their physical lengths (Gill et al. 1991; Table 2). EST loci mapped to a chromosome but not to an arm or bin were excluded from this analysis, reducing the data subset from 986 to 965 loci. Some ESTs mapping to homoeologous group 2 were hybridized to a mapping filter that did not include N2AT2B. Therefore, any EST loci located in the C-2AS5-0.78 bin, which spans the majority of the short arm, could not be mapped. Loci in the C-2AL1-0.85 bin could be mapped due to the presence of ditelosomic 2AS on the mapping filters. The missing N2AT2B stock could have skewed the results of the EST distribution between the arms of 2A and in the bins along the short arm of 2A. For this reason, the 337 group 2 ESTs having all restriction fragments mapped were used to analyze EST distributions between and along the chromosome arms. Ratios of mapped loci on the long vs. short arms were 1.8, 1.6, and 1.8 for chromosomes 2A, 2B, and 2D, respectively. All three group 2 chromosomes had higher than expected numbers of EST loci on the long arm with significance levels of P < 0.01 for 2A and 2D and P < 0.05 for 2B.
TABLE 2.
Distribution of EST loci between the group 2 chromosome arms and among the chromosome bins
| No. of loci
|
|||||
|---|---|---|---|---|---|
| Chromosome segment | Physical length (μm)a |
Observed | Expectedb | Density ratioc | χ2d |
| Arme | |||||
| 2AS | 5.43 | 105 | 127.4 | 0.82 | 6.96** |
| 2AL | 7.07 | 190 | 167.6 | 1.13 | |
| 2BS | 5.86 | 138 | 161.5 | 0.85 | 6.28* |
| 2BL | 7.04 | 215 | 191.6 | 1.12 | |
| 2DS | 4.39 | 115 | 138.1 | 0.83 | 6.85** |
| 2DL | 5.71 | 202 | 178.9 | 1.13 | |
| Binf | |||||
| 2AS5-0.78-1.00 | 1.19 | 50 | 24.6 | 2.03 | 26.22*** |
| C-2AS5-0.78 | 4.24 | 43 | 87.5 | 0.49 | 22.63*** |
| C-2AL1-0.85 | 6.01 | 127 | 124.0 | 1.02 | 0.07 |
| 2AL1-0.85-1.00 | 1.06 | 38 | 21.9 | 1.74 | 11.84*** |
| 2BS3-0.84-1.00 | 0.94 | 41 | 22.7 | 1.81 | 14.75*** |
| 2BS4-0.75-0.84 | 0.53 | 5 | 12.8 | 0.39 | 4.75* |
| 2BS1-0.53-0.75 | 1.29 | 40 | 31.1 | 1.29 | 2.55 |
| C-2BS1-0.53 | 3.11 | 36 | 75.0 | 0.48 | 20.28*** |
| C-2BL2-0.36 | 2.53 | 36 | 61.0 | 0.59 | 10.25** |
| 2BL2-0.36-0.50 | 0.99 | 72 | 23.9 | 3.01 | 96.80*** |
| 2BL4-0.50-0.89 | 2.75 | 32 | 66.3 | 0.48 | 17.74*** |
| 2BL6-0.89-1.00 | 0.77 | 49 | 18.6 | 2.63 | 49.69*** |
| 2DS5-0.47-1.00 | 2.33 | 63 | 65.7 | 0.96 | 0.11 |
| 2DS1-0.33-0.47 | 0.61 | 15 | 17.2 | 0.87 | 0.28 |
| C-2DS1-0.33 | 1.45 | 22 | 40.9 | 0.54 | 8.73** |
| C-2DL3-0.49 | 2.80 | 46 | 79.0 | 0.58 | 13.78*** |
| 2DL3-0.49-0.76 | 1.54 | 63 | 43.5 | 1.45 | 8.74** |
| 2DL9-0.76-1.00 | 1.37 | 76 | 38.7 | 1.96 | 36.95*** |
*, **, and ***, significant at 0.05, 0.01, and 0.001 probability levels, respectively.
From Endo and Gill (1996).
Determined from arm ratio value (Gill et al. 1991) for arms and from the physical length of the bin for bins.
Ratio of observed to expected number of loci.
Test for probability of departure of observed from expected number of loci.
A total of 965 EST loci mapped to chromosome arms generated from only those ESTs having all restriction fragments mapped.
A total of 854 EST loci mapped to chromosome bins generated from only those ESTs having all restriction fragments mapped.
Distribution of EST loci along the chromosome arms:
Analysis of the subset of 854 confirmed group 2 loci, mapped to chromosome bins from the ESTs having all restriction fragments mapped, revealed highly significant (P < 0.001) deviations from the expected number of EST loci for 10 of the 18 group 2 chromosome bins (Figure 1, Table 2). EST loci mapped to a chromosome or chromosome arm but not to a chromosome bin were excluded from this analysis, resulting in a data set of 854 loci. Gene densities were expressed as a ratio of observed vs. expected loci on the basis of physical length. The interstitial bin 2BL2-0.36-0.50 had the highest gene density with a ratio of 3.01. The most distal bins of both arms for all three group 2 chromosomes had high EST densities (P < 0.001), ranging from ratios of 1.74 to 2.63, with the exception of 2DS5-0.47-1.00, which did not differ significantly from the expectation. The most proximal bins did not contain a high density of ESTs: C-2AS5-0.78, C-2BS1-0.53, C-2DS1-0.33, C-2BL2-0.36, and C-2DL3-0.49 had fewer loci than expected (P < 0.01). The centromeric bin C-2AL1-0.85, spanning 85% of the fraction length of the long arm, did not differ significantly from the expectation.
Group 2 consensus EST map:
Of the 1110 ESTs with mapped loci, 552 ESTs mapped to overlapping chromosome bins in two or three genomes were assigned to consensus bins with 225 ESTs located on the short arm and 327 on the long arm (see supplemental online materials at http://wheat.pw.usda.gov/pubs/2004/Genetics/). Of the 552 ESTs assigned to the consensus map, 376 were mapped to specific consensus bins, with 151 and 225 ESTs located to bins in the short and long arms, respectively. An additional 176 ESTs were mapped to larger, combined bins due to missing data in one of the homoeologous group 2 chromosomes, allowing only the interval, but not the specific bin, to be identified.
The consensus bin 4S was bounded by nonoverlapping fractions between chromosomes 2A and 2B. One EST, BF482723, with loci mapped to bins C-2AS5-0.78 and 2BS4-0.75-0.84, fit into the expected fraction (0.75–0.78); however, this EST had a highly complex banding pattern, with 14 total loci mapping to four different homoeologous groups and seven unmapped fragments. This EST was treated as an anomaly, while the 37 ESTs mapping to the syntenous bins of nonoverlapping fractions 2AS5-0.78-1.00, 2BS1-0.53-0.75, and 2DS5-0.47-1.00 defined consensus bin 4S. For the purpose of this study, the consensus bin 4S was defined by the 2BS1 0.75 breakpoint at its proximal end and the 2AS5 0.78 breakpoint at its distal end.
Chi-square analysis was performed using loci generated from ESTs having all restriction fragments mapped and assigned to specific consensus bins to analyze further the distribution of loci contained in smaller intervals (Figure 2, Table 3). Small interstitial consensus bins on the long arm (2L, estimated FL 0.49-0.50) and on the short arm (4S, estimated FL 0.75-0.78) had the highest EST density ratios of 34.6 and 7.8, respectively (P < 0.001). Bin 2L contained 32.4% of the long-arm EST loci mapped to consensus bins, yet constituted only ∼1% of the physical arm. This bin was flanked by bins 1L (estimated FL 0.36-0.49) and 3L (estimated FL 0.50-0.76), which contained significantly fewer than expected EST loci (P < 0.001). Bin 4S contained 28.3% of the EST loci mapping to short-arm consensus bins, yet accounted for <3% of the length of the arm. Adjacent bin 3S (estimated FL 0.53-0.75) was extremely sparse (P < 0.001) with a gene density ratio of only 0.10. The other neighboring consensus bin also had a low density ratio of 0.58, although there were only a small number of loci discovered. The most distal bins, 6S and 6L, had significantly higher than expected numbers of EST loci (P < 0.01 and P < 0.001, respectively). Consensus bin 4L, with estimated fraction length 0.76–0.85, was also highly EST rich (P < 0.001). Both centromeric consensus bins CS and CL were regions of lower than expected EST density (P < 0.001).
TABLE 3.
Distribution of EST loci along the group 2 chromosome consensus map
| No. of loci
|
|||||||
|---|---|---|---|---|---|---|---|
| Bin | Fraction | Fraction length |
Mean physical length (μm)a |
Observed | Expectedb | Density ratioc |
χ2d |
| 6S | 0.84–1.00 | 0.16 | 0.84 | 63 | 42.4 | 1.49 | 10.01** |
| 5S | 0.78–0.84 | 0.06 | 0.31 | 9 | 15.6 | 0.58 | 2.79 |
| 4S | 0.75–0.78 | 0.03 | 0.16 | 63 | 8.1 | 7.78 | 372.10*** |
| 3S | 0.53–0.75 | 0.22 | 1.15 | 6 | 58.0 | 0.10 | 46.62*** |
| 2S | 0.47–0.53 | 0.06 | 0.31 | 12 | 15.6 | 0.77 | 0.83 |
| 1S | 0.33–0.47 | 0.14 | 0.73 | 24 | 36.8 | 0.65 | 4.45* |
| CS | 0.00–0.33 | 0.33 | 1.72 | 46 | 86.8 | 0.53 | 19.18*** |
| CL | 0.00–0.36 | 0.36 | 2.38 | 47 | 120.1 | 0.39 | 44.49*** |
| 1L | 0.36–0.49 | 0.13 | 0.86 | 21 | 43.4 | 0.48 | 11.56*** |
| 2L | 0.49–0.50 | 0.01 | 0.07 | 121 | 3.5 | 34.57 | 3944.64*** |
| 3L | 0.50–0.76 | 0.26 | 1.72 | 15 | 86.8 | 0.17 | 59.39*** |
| 4L | 0.76–0.85 | 0.09 | 0.59 | 74 | 29.8 | 2.48 | 65.56*** |
| 5L | 0.85–0.89 | 0.04 | 0.26 | 6 | 13.1 | 0.46 | 3.85* |
| 6L | 0.89–1.00 | 0.11 | 0.73 | 90 | 36.8 | 2.45 | 76.91*** |
Only loci from ESTs with all restriction fragments mapped and assigned to specific consensus bins were included in this analysis. *, **, and ***, significant at 0.05, 0.01, and 0.001 probability levels, respectively.
From Gill et al. (1991).
Number of loci based on the physical length of the bin.
Ratio of observed to expected number of loci.
Test for departure of observed from expected number of loci.
Anomalies:
Sixty-seven ESTs (6.0%) that mapped to two or three homoeologous group 2 chromosomes could not be assigned to consensus bins because they had fragments that mapped to nonoverlapping chromosome bins in the different genomes. These 67 ESTs detected 30 different types of anomaly, of which 43 had unmapped restriction fragments. Furthermore, nearly one-half of anomalous ESTs had more than six restriction fragments, and approximately one-third had fragments mapped to other homoeologous groups. Therefore, many of these anomalies occurred in higher-copy ESTs with complex patterns of duplication. One-half of the various types of anomalies were detected by only one EST. One such anomaly, BE604879, had fragments mapped to bins 2BS3-0.84-1.00, 6AS5-0.65-1.00, and 6DS6-0.99-1.00. The distal locations of these bins suggest the possible presence of a 6BS-2BS translocation.
Structural rearrangements:
A possible pericentric inversion on chromosome 2B was detected by two ESTs: BE404630 and BE500625. Missing restriction fragments in N2BT2D, N2AT2B, and N2DT2A and ditelosomic lines indicated map locations on the opposite arm of chromosome 2B vs. 2A and 2D. Due to the absence of restriction fragments in the group 2 nullisomic-tetrasomic and ditelosomic lines and the presence of all loci in all group 2 deletion lines, the loci were mapped to bins nearest the centromere. The two EST probes involved in the possible inversion constitute 2.9% of the 70 EST probes that detected loci in the centromeric consensus bins, including probes mapped to consensus bins CS and CL, plus the two probes involved in the inversion.
Duplication:
The colocalization of separate restriction fragments detected by an EST probe to the same bin could be due to duplication of genetic material or to other factors such as intragenic restriction sites. These factors confound the analysis of duplication of genetic material within chromosome bins. For this reason, duplication analysis was restricted to duplication to other group 2 bins and to other homoeologous groups. Only 25 ESTs (2.3%, based on the confirmed set of ESTs with loci mapping to homoeologous group 2 chromosomes) detected loci in two or more bins within a homoeologous group 2 chromosome, 15 of which involved duplication to bins on opposite arms. The 25 ESTs generated eight duplicate loci on 2A, 14 on 2B, and 6 on 2D.
Three hundred sixty ESTs (32.4%) had at least one locus mapped to a homoeologous group 2 chromosome and at least one locus mapped to a different homoeologous group chromosome. On a whole-chromosome basis, no significant deviations from random distribution were detected by chi-square analysis (see supplemental online materials at http://wheat.pw.usda.gov/pubs/2004/Genetics/).
On a chromosome-bin basis, the number of duplicate loci mapping within each non-group 2 bin ranged from 0 to 20. No highly significant pattern of duplication to non-group 2 chromosome bins was found. However, significant duplication (P < 0.01) was found in the chromosome bin C-1BL6-0.32, with 14 duplicated loci generated from 10 EST probes. Eight additional chromosome bins had more duplicate loci than expected with a significance level of P < 0.05 (see supplemental online materials at http://wheat.pw.usda.gov/pubs/2004/Genetics/).
Wheat-rice comparisons:
The sequences of the 552 ESTs assigned to the consensus map were compared against the rice BAC/PAC sequences at NCBI using blastN for analysis of wheat-rice colinearity. Highly significant colinearity was found between the short arm of the wheat consensus group 2 chromosome (W2) and rice chromosome 7 (R7) and between the long arm of W2 and rice chromosome 4 (R4) (Table 4). Of the 122 short-arm ESTs having matches to rice, 70.5% matched sequences on R7, and of the 158 long-arm ESTs with rice matches, 64.6% matched sequences on R4. Additionally, the most distal consensus bin on the short arm of W2 (6S) had highly significant colinearity with R4, but also had significant colinearity with R7. Of the 18 matches in bin 6S, 10 went to R4 and 5 went to R7. Colinearity between the ESTs of W2 and R7 extended into the proximal region of the long arm of W2 with consensus bin CL having good colinearity with the short arm of R7 and bin CS having good colinearity with both the short- and long-arm centromeric regions of R7. Of the 31 matches in bin CL (estimated FL C-0.36) and combined bin CL-1L (estimated FL C-0.49), 16 matched sequences on R7 and 9 matched sequences on R4. The majority of disruptions in colinearity occurred in the most distal bins of the consensus map. Although the order of wheat ESTs within bins is unknown, those ESTs mapped to specific consensus bins with matches to rice chromosomes determined to have significant colinearity were assigned to putative orders within bins on the basis of comparison with the ordered rice BAC/PAC positions along the rice chromosomes (Figure 3; supplemental online materials http://wheat.pw.usda.gov/pubs/2004/Genetics/). ESTs mapped to combined bins were excluded from Figure 3. Of the 146 ESTs mapped to specific consensus bins having matches to rice colinear chromosomes 4 and 7, 6 were excluded from the figure because the rice BACs that they matched were not included in the map of ordered rice BACs (http://www.tigr.org/tigr-scripts/IRGSP/assignMap.pl?chr=4&site=All&markerSource=All; http://www.tigr.org/tigr-scripts/IRGSP/assignMap.pl?chr=7&site=All&markerSource=All). Of the 140 ESTs (11.4%) included in Figure 3, 16 detected disruptions in wheat-rice synteny at the W2 consensus bin level. Of the 5 ESTs with matches to R4 in bin CL, 3 showed disruptions in synteny. Distal bin 6S contained four synteny disruptions, and 6L contained three. Wheat consensus bins tended to correspond to blocks of ordered rice BACs/PACs.
TABLE 4.
Colinearity between the wheat group 2 consensus map and the rice genome
| Rice chromosomea
|
||||||||||||||||
|---|---|---|---|---|---|---|---|---|---|---|---|---|---|---|---|---|
| Wheat chromosome 2 consensus bin |
1 | 2 | 3 | 4 | 5 | 6 | 7 | 8 | 9 | 10 | 11 | 12 | No match |
Total matches |
Probability (1st)b |
Probability (2nd)c |
| 6S | 1 | 10 | 5 | 1 | 1 | 30 | 18 | <0.001 | <0.001 | |||||||
| 4S-6S | 1 | 4 | 1 | 1 | 14 | 7 | 0.001 | 0.249 | ||||||||
| 2S-6S | 1 | 1 | 4 | 2 | 0.153 | 0.091 | ||||||||||
| 5S | 2 | 2 | 2 | 0.007 | — | |||||||||||
| 4S-5S | 1 | 0 | 1 | 0.083 | — | |||||||||||
| 4S | 1 | 16 | 1 | 19 | 18 | <0.001 | 0.174 | |||||||||
| 3S-4S | 1 | 1 | 8 | 1 | 6 | 11 | <0.001 | 0.249 | ||||||||
| 2S-4S | 1 | 0 | 1 | 0.083 | — | |||||||||||
| 3S | 1 | 2 | 1 | 0.083 | — | |||||||||||
| 2S-3S | 1 | 5 | 1 | 2 | 7 | <0.001 | 0.174 | |||||||||
| CS-3S | 4 | 1 | 4 | <0.001 | — | |||||||||||
| 2S | 1 | 1 | 2 | 3 | 3 | 7 | 0.014 | 0.044 | ||||||||
| CS-2S | 1 | 1 | 6 | 1 | 2 | 9 | <0.001 | 0.249 | ||||||||
| 1S | 1 | 8 | 6 | 9 | <0.001 | 0.091 | ||||||||||
| CS-1S | 2 | 0 | — | — | ||||||||||||
| CS | 1 | 1 | 1 | 21 | 10 | 24 | <0.001 | 0.249 | ||||||||
| CL | 4 | 5 | 11 | 1 | 12 | 21 | <0.001 | 0.001 | ||||||||
| CL-1L | 4 | 1 | 5 | 11 | 10 | <0.001 | <0.001 | |||||||||
| CL-4L | 3 | 3 | 3 | <0.001 | — | |||||||||||
| 1L | 1 | 1 | 7 | 1 | 7 | 10 | <0.001 | 0.249 | ||||||||
| 1L-2L | 5 | 1 | 8 | 6 | <0.001 | 0.091 | ||||||||||
| 1L-5L | 1 | 0 | — | — | ||||||||||||
| 2L | 5 | 3 | 1 | 27 | 1 | 2 | 31 | 39 | <0.001 | 0.003 | ||||||
| 2L-3L | 1 | 12 | 1 | 10 | 14 | <0.001 | 0.174 | |||||||||
| 2L-6L | 1 | 0 | — | — | ||||||||||||
| 3L | 1 | 1 | 6 | 2 | 0.153 | 0.091 | ||||||||||
| 2L-4L | 1 | 0 | — | — | ||||||||||||
| 3L-4L | 3 | 2 | 3 | <0.001 | — | |||||||||||
| 4L | 1 | 1 | 10 | 1 | 1 | 16 | 14 | <0.001 | 0.317 | |||||||
| 3L-5L | 1 | 0 | — | — | ||||||||||||
| 4L-5L | 2 | 1 | 6 | 3 | 0.019 | 0.091 | ||||||||||
| 4L-6L | 2 | 2 | 2 | 0.007 | — | |||||||||||
| 5L | 2 | 2 | 2 | 0.007 | — | |||||||||||
| 5L-6L | 2 | 1 | 1 | 11 | 4 | 0.035 | 0.174 | |||||||||
| 6L | 3 | 19 | 3 | 38 | 25 | <0.001 | 0.012 | |||||||||
| Total | 9 | 9 | 20 | 114 | 2 | 0 | 104 | 8 | 0 | 4 | 0 | 10 | 272 | 280 | <0.001 | <0.001 |
Underlining indicates rice chromosomes with greatest colinearity with each wheat consensus bin.
Numbers within each column are the number of ESTs with significant matches between the wheat consensus bin and the rice chromosome.
Binomial probability of finding the observed number of ESTs in the rice chromosome showing the greatest colinearity in wheat.
Binomial probability of finding the observed number of ESTs in the rice chromosome showing the second greatest colinearity.
Figure 3.—
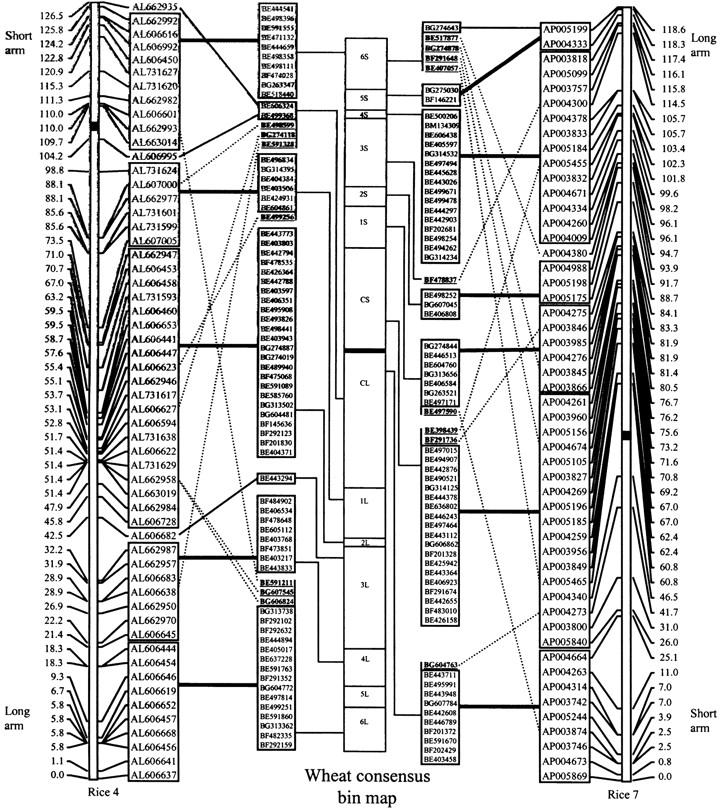
Depiction of wheat consensus group 2 and rice syntenous blocks. Wheat group 2 ESTs are listed in their putative order within consensus bins on the basis of comparison with ordered rice BAC/PAC clones. The wheat EST consensus map showing loci with matches to the rice colinear chromosomes is flanked by the genetic maps of rice BAC/PAC clones for rice chromosomes 4 (left) and 7 (right). Solid lines connect syntenous blocks between wheat ESTs and rice BAC/PAC clones. Dotted lines indicate significant blast matches between a wheat EST and rice BAC/PAC showing synteny disruptions at the consensus bin level. ESTs involved in synteny disruptions are shown in boldface, underlined type. Thin solid lines connect EST-rice BAC/PAC matches that are syntenous at the bin level, but have only one match to the syntenous region in rice. Centromeres are indicated by thick solid horizontal lines. Cumulative centimorgan distances are given on the side of each rice chromosome. Information on genetic mapping of rice chromosomes 4 and 7 BAC/PAC clones was obtained at http://www.tigr.org/tigr-scripts/IRGSP/assignMap.pl?chr=4&site=All&markerSource=All and http://www.tigr.org/tigr-scripts/IRGSP/assignMap.pl?chr=7&site=All&markerSource=All.
DISCUSSION
Distribution of EST loci:
Chromosome 2D is a highly EST-rich chromosome with an overall density ratio of 1.18 (1.16 using the subset of data having all restriction fragments mapped). Although chromosome 2B had more EST loci than 2A or 2D, analysis showed that, on the basis of its size, it had the expected number of EST loci. Therefore, the larger physical size of chromosome 2B accounted for its large number of EST loci. It is notable that chromosome 2B had an average gene density, while 2A had fewer loci than expected, especially in light of the fact that chromosome 2B is the most heterochromatic of the group 2 chromosomes (Gill et al. 1991; Figure 1).
As reported elsewhere (Akhunov et al. 2003a; Qi et al. 2004), chi-square analysis revealed numerous bins with significantly higher or lower densities than expected. The tendency for deletion line breakpoints to coincide with interstitial gene-rich clusters (Endo and Gill 1996), possibly due to loose packing of transcriptionally active regions, has been reported for wheat group 1 (Gill et al. 1996b; Sandhu et al. 2001) and group 5 (Gill et al. 1996a; Faris et al. 2000). Consensus bins 4S and 2L were defined by breakpoints in neighboring regions between the A and B and B and D genomes, respectively. The extremely high gene density in these small consensus bins provided additional supporting evidence for the coincidence of deletion line breakpoints and gene-rich clusters. The long-arm chromosome bin 2BL2-0.36-0.50 was unique due to its extremely high gene density ratio, >3.0, despite its location in the proximal one-half of the chromosome arm. The consensus bin 2L with the estimated fraction length 0.49–0.50 had a gene density ratio exceeding 34 times the expectation. Therefore, on the basis of their consensus map location (2L, estimated FL 0.49-0.50), the majority (85%) of the loci mapping to 2BL2-0.36-0.50 were concentrated around the distal 1% of the bin. There appeared to be an inaccuracy in the measurement of deletion fraction lengths involving consensus bin 4S, as evidenced by the 37 ESTs having loci in syntenous bins with nonoverlapping breakpoint fractions between chromosomes 2A and 2B. The bin 2BS4-0.75-0.84 was an EST-poor region (the gene density ratio was 0.39). This is inconsistent with the finding that part of this bin was contained in an EST-rich region (gene density ratio was 7.78) on the consensus map. The bin 2BS1-0.53-0.75 had a slightly above-average gene density (1.29). This evidence, as well as the large number of ESTs exhibiting the mapping pattern 2AS5-0.78-1.00; 2BS1-0.53-0.75; 2DS5-0.47-1.00, supported the adjustment of the 2AS5 breakpoint from 0.78 to the vicinity of 0.75. For the purpose of this article, the 37 ESTs were placed into consensus bin 4S, and the breakpoint for 2AS5 was thus assumed to be somewhat proximal of 0.78. The extreme concentration of EST loci into very small fractions of the group 2 consensus map provided evidence for a pattern of genome organization consisting of interstitial gene-rich islands, surrounded by large, gene-poor oceans. Such gene islands provide potential targets for sequencing, mapping, and gene discovery, and BAC clones from dense, syntenous regions can be used in blast searches (i) to design molecular markers, (ii) to assess function on the basis of sequence comparison, and (iii) for genomic evolutionary studies.
Consensus bins provided a higher resolution framework than individual chromosome deletion bins did for ordering blocks of ESTs along the chromosomes. However, our mapping data have shown that the homoeologous group 2 chromosomes were not perfectly conserved (see Structural rearrangements in the results and discussion) and, given the resolution of the chromosome deletion bins (two to four per chromosome arm), it is likely that many deviations in gene order and content have remained undetected.
While the number of predicted genes in eukaryotic organisms has been shown to be relatively constant, genome sizes are known to vary over five orders of magnitude (Gregory 2001). The main difference in genome structure between species with large and small genomes appears to be the size of the gene-poor regions separating gene-rich islands. It has been estimated that ∼80% of genomic content in the Triticeae consists of repetitive DNA sequences (Smith and Flavell 1975). A comparative study of the Sh2/A1 orthologous region in rice, sorghum (Sorghum vulgare L.), maize (Zea mays L.), and the Triticeae revealed massive expansions in certain intergenic regions in the Triticeae. The intergenic distances of wheat in comparison with rice varied from 4-fold for one gene pair to an estimated 195-fold for another gene pair (Li and Gill 2002). Therefore, we conclude that genome expansion in the Triticeae did not occur uniformly throughout the genome.
Genome expansion events caused by insertions of repetitive sequences such as retrotransposable elements (RTEs) are subject to natural selection (SanMiguel et al. 1996) and would be dependent on the availability of nondeleterious insertion sites (Petrov 2001). In maize, periodic insertions of retrotransposons usually occur within other RTEs (SanMiguel et al. 1998; Gaut et al. 2000). Walbot and Petrov (2001) theorized that periodic retrotransposable element expansions, tempered locally by tolerance for insertions, were highly likely to produce the observed extreme unevenness in gene density due to the preferential accumulation of insertions in less gene-dense regions. Thus, the clustering of genes on small, interstitial islands within each group 2 chromosome arm, surrounded by vast regions of noncoding DNA, could reduce the probability that deleterious mutations will occur within coding regions.
Wheat-rice comparisons:
The results of the wheat-rice colinearity analysis were consistent with the findings of good colinearity between wheat homoeologous group 2 and rice chromosomes 4 and 7 by Sorrells et al. (2003) and with previous RFLP-based comparative maps of wheat and rice (Kurata et al. 1994; Van Deynze et al. 1995). The consensus bins along the homoeologous group 2 consensus map also had generally good colinearity with blocks of ordered BACs/PACs matching ESTs in each bin. At the bin level, the highest frequency of synteny disruptions occurred in the most distal consensus bins, 6S and 6L. These results were consistent with previous findings that synteny levels tend to decrease with distance from the centromere (Akhunov et al. 2003b). However, disruptions in synteny were also observed in the centromeric bin CL, which will be discussed in the next section. Bennetzen et al. (1998) observed the maintenance of colinearity in gene-rich regions of rice and sorghum, despite their evolutionary distance of ∼50 million years. Similarly, the highly EST-rich consensus bins 4S and 2L appeared to have the best overall synteny with rice with a large number of ESTs matching with blocks of rice-ordered BAC/PAC clones and no synteny disruptions observed at the bin level.
Structural rearrangements:
The detection of a small putative pericentric inversion in chromosome 2B was supported by the bin mapping of BE404630 and BE500625 and to our knowledge has not been previously reported. Due to its small size and close proximity to the centromere, a region of low recombination, this inversion would have been difficult to detect using genetic mapping systems that rely on intragenic polymorphism. Akhunov et al. (2003b) reported decreased synteny levels with increased distance from the centromere, correlating with higher levels of recombination. However, they also reported that a greater number of unique loci occur in the proximal region of the B genome than in the same regions of the A and D genomes. Figure 3 indicates disruptions in synteny in the centromeric bins, as well as significant colinearity with both rice chromosomes 7 and 4 for consensus bin CL (Table 4). The EST BE404630 involved in the inversion had a significant blast match to the rice BAC AP004384 in the block colinear with consensus bin CS. Because this EST was an anomaly, with loci mapped to the centromeric chromosome bins in 2AL, 2DL, and 2BS, it was not placed on the consensus map and was not included in Figure 3. In Figure 3, three of the five ESTs with matches to rice chromosome 4 and mapped to CL showed bin-level synteny disruptions. Additionally, Figure 3 shows two disruptions in synteny between consensus bin CS and rice chromosome 7 and one for consensus bin CL. The lack of synteny in the centromeric region among the homoeologous group 2 chromosomes detected by the two wheat ESTs involved in the pericentric inversion, as well as the disruptions in synteny between consensus bin CL and rice, suggest that this has been a region subject to rearrangement during the evolution of the grasses.
A translocation involving the short arms of chromosomes 2B and 6B had previously been proposed on the basis of genetic mapping data (Devos et al. 1993). This rearrangement also was reported in tetraploid wheat (T. turgidum L.) from the mapping of the cDNA clone PSR899 with orthologous loci on 6S–2BS (Blanco et al. 1998). However, deletion mapping revealed markers Xpsr899-6A and Xpsr899-6D to be physically located in interstitial bins 6AS4-0.65-0.67 and 6DS2-0.45-0.79 (Weng and Lazar 2002). The anomalous mapping pattern of EST BE604879 with loci on 6AS5-0.65-1.00, 2BS3-0.84-1.00, and 6DS6-0.99-1.00 supported previous reports that there may be a small portion of genetic material native to the distal region of 6BS and colinear with 6AS5-0.65-1.00 and 6DS6-0.99-1.00 on the distal region of chromosome 2B. The most distal consensus bin 6S (estimated FL 0.84-1.00) had highly significant colinearity with both rice chromosomes 4 and 7 (P < 0.001). It is likely that there was a shift in colinearity within consensus bin 6S, with the distal portion of the bin colinear with rice chromosome 4 and the proximal portion colinear with rice chromosome 7. Bins 6S and CL, unique in having highly significant colinearity (P < 0.001) with two different rice chromosomes, both contained ESTs having anomalous mapping patterns, indicative of structural rearrangement. Such regions within chromosomes that change from being syntenous with one region of a related species to another could indicate genomic segments more susceptible to fracture or rearrangement.
Conclusions:
High-density chromosome bin maps of ESTs provide insights into the evolution of the hexaploid wheat genome. The overall preservation of synteny relationships with rice supports the use of rice as a model organism to facilitate the study of the wheat genome. The EST approach has facilitated the discovery of two interstitial gene-rich islands and a putative pericentric inversion on chromosome 2B. The two gene-rich islands having well-preserved synteny with rice provide targets for future mapping and comparative genomics studies.
Acknowledgments
Special thanks go to Sixin Liu, Kari McGowan, Carrie Beckenbach, Brandon Carriere, Charissa Lewis, Mike Pumphrey, and David Bowen for their assistance with this project. This material is based upon work supported by the National Science Foundation under Cooperative Agreement no. DBI-9975989.
References
- Adams, M. D., J. M. Kelley, J. D. Gocayne, M. Dubnick, M. H. Polymeropoulos et al., 1991. Complementary DNA sequencing: expressed sequence tags and human genome project. Science 252: 1651–1656. [DOI] [PubMed] [Google Scholar]
- Akhunov, E. D., A. W. Goodyear, S. Geng, L. L. Qi, B. Echalier et al., 2003. a The organization and rate of evolution of wheat genomes are correlated with recombination rates along chromosome arms. Genome Res. 13: 753–763. [DOI] [PMC free article] [PubMed] [Google Scholar]
- Akhunov, E. D., A. R. Akhunova, A. M. Linkiewicz, J. Dubcovsky, D. Hummel et al., 2003. b Synteny perturbations between wheat homoeologous chromosomes caused by locus duplications and deletions correlate with recombination rates. Proc. Natl. Acad. Sci. USA 100: 10836–10841. [DOI] [PMC free article] [PubMed] [Google Scholar]
- Anderson, J. A., Y. Ogihara, M. E. Sorrells and S. D. Tanksley, 1992. Development of a chromosomal arm map for wheat based on RFLP markers. Theor. Appl. Genet. 83: 1035–1043. [DOI] [PubMed] [Google Scholar]
- Anderson, J. A., M. E. Sorrells and S. D. Tanksley, 1993. RFLP analysis of genomic regions associated with resistance to preharvest sprouting in wheat. Crop Sci. 33: 453–459. [Google Scholar]
- Bennetzen, J. L., P. San Miguel, M. Chen, A. Tikhonov, M. Francki et al., 1998. Grass genomes. Proc. Natl. Acad. Sci. USA 95: 1975–1978. [DOI] [PMC free article] [PubMed] [Google Scholar]
- Blanco, A., M. P. Bellomo, A. Cenci, C. De Giovanni, R. D'Ovidio et al., 1998. A genetic linkage map of durum wheat. Theor. Appl. Genet. 97: 721–728. [Google Scholar]
- Delany, D. E., S. Nasuda, T. R. Endo, B. S. Gill and S. H. Hulbert, 1995. Cytologically based physical maps of the group-2 chromosomes of wheat. Theor. Appl. Genet. 91: 568–573. [DOI] [PubMed] [Google Scholar]
- Devos, K. M., T. Millan and M. D. Gale, 1993. Comparative RFLP maps of homoeologous group 2 chromosomes of wheat, rye and barley. Theor. Appl. Genet. 85: 784–792. [DOI] [PubMed] [Google Scholar]
- Endo, T. R., and B. S. Gill, 1996. The deletion stocks of common wheat. J. Hered. 87: 295–307. [Google Scholar]
- Faris, J. D., K. M. Haen and B. S. Gill, 2000. Saturation mapping of a gene-rich recombination hot spot region in wheat. Genetics 154: 823–835. [DOI] [PMC free article] [PubMed] [Google Scholar]
- Gaut, B. S., M. Le Thierry d'Ennequin, A. S. Peek and M. C. Sawkins, 2000. Maize as a model for the evolution of plant nuclear genomes. Proc. Natl. Acad. Sci. USA 97: 7008–7015. [DOI] [PMC free article] [PubMed] [Google Scholar]
- Gill, B. S., B. Friebe and T. R. Endo, 1991. Standard karyotype and nomenclature system for description of chromosome bands and structural aberrations in wheat (Triticum aestivum). Genome 34: 830–839. [Google Scholar]
- Gill, K. S., B. S. Gill and T. R. Endo, 1993. A chromosome region-specific mapping strategy reveals gene-rich telomeric ends in wheat. Chromosoma 102: 374–381. [Google Scholar]
- Gill, K. S., B. S. Gill, T. R. Endo and E. V. Boyko, 1996. a Identification and high-density mapping of gene-rich regions in chromosome group 5 of wheat. Genetics 143: 1001–1012. [DOI] [PMC free article] [PubMed] [Google Scholar]
- Gill, K. S., B. S. Gill, T. R. Endo and T. Taylor, 1996. b Identification and high-density mapping of gene-rich regions in chromosome group 1 of wheat. Genetics 144: 1883–1891. [DOI] [PMC free article] [PubMed] [Google Scholar]
- Goff, S. A., D. Ricke, T. H. Lan, G. Presting, R. L. Wang et al., 2002. A draft sequence of the rice genome (Oryza sativa L. ssp. japonica). Science 296: 92–100. [DOI] [PubMed] [Google Scholar]
- Gregory, T. R., 2001. Coincidence, coevolution, or causation? DNA content, cell size, and the C-value enigma. Biol. Rev. 76: 65–101. [DOI] [PubMed] [Google Scholar]
- Kurata, N., G. Moore, Y. Nagamura, T. Foote, M. Yano et al., 1994. Conservation of genome structure between rice and wheat. Biotechnology 12: 276–278. [Google Scholar]
- Lazo, G. R., S. Chao, D. D. Hummel, H. Edwards, C. C. Crossman et al., 2004. Development of an expressed sequence tag (EST) resource for wheat (Triticum aestivum L.): EST generation, unigene analysis, probe selection and bioinformatics for a 16,000-locus bin-delineated map. Genetics 168: 585–593. [DOI] [PMC free article] [PubMed] [Google Scholar]
- Li, W. L., and B. S. Gill, 2002. The colinearity of the Sh2/A1 orthologous region in rice, sorghum and maize is interrupted and accompanied by genome expansion in the Triticeae. Genetics 160: 1153–1162. [DOI] [PMC free article] [PubMed] [Google Scholar]
- McIntosh, R. A., Y. Yamazaki, K. M. Devos, J. Dubcovsky, W. J. Rogers et al., 2003 Catalogue of gene symbols for wheat, pp. 1–34 in Proceedings of the 10th International Wheat Genetics Symposium, Vol. 4, edited by N. E. Pogna, M. Romano, E. Pogna and G. Galterio. Instituto Sperimentale per la Cerealicotura, Rome.
- Petrov, D., 2001. Evolution of genome size: new approaches to an old problem. Trends Genet. 17: 23–28. [DOI] [PubMed] [Google Scholar]
- Qi, L. L., and B. S. Gill, 2001. High-density physical maps reveal that the dominant male-sterile gene Ms3 is located in a genomic region of low recombination in wheat and is not amenable to map-based cloning. Theor. Appl. Genet. 103: 998–1006. [Google Scholar]
- Qi, L. L., B. Echalier, B. Friebe and B. S. Gill, 2003. Molecular characterization of a set of wheat deletion stocks for use in chromosome bin mapping of ESTs. Funct. Integr. Genomics 3: 39–55. [DOI] [PubMed] [Google Scholar]
- Qi, L. L., B. Echalier, S. Chao, G. R. Lazo, G. E. Butler et al. 2004. A chromosome bin map of 16,000 expressed sequence tag loci and distribution of genes among the three genomes of polyploid wheat. Genetics 168: 701–712. [DOI] [PMC free article] [PubMed] [Google Scholar]
- Sandhu, D., J. A. Champoux, S. N. Bondareva and K. S. Gill, 2001. Identification and physical localization of useful genes and markers to a major gene-rich region on wheat group 1S chromosomes. Genetics 157: 1735–1747. [DOI] [PMC free article] [PubMed] [Google Scholar]
- SanMiguel, P., A. Tikhonov, Y.-K. Jin, N. Motchoulskala, D. Zakharov et al., 1996. Nested retrotransposons in the intergenic regions of the maize genome. Science 274: 765–768. [DOI] [PubMed] [Google Scholar]
- SanMiguel, P., B. S. Gaut, A. Tikhonov, Y. Nakajima and J. L. Bennetzen, 1998. The paleontology of intergene retrotransposons of maize. Nat. Genet. 20: 43–45. [DOI] [PubMed] [Google Scholar]
- Scarth, R., and C. N. Law, 1983. The location of the photoperiod gene Ppd2 and an additional genetic factor for ear-emergence time on chromosome 2B of wheat. Heredity 51: 607–619. [Google Scholar]
- Sears, E. R., 1954. The aneuploids of common wheat. Univ. Mo. Agric. Exp. Stn. Bull. 572: 1–58. [Google Scholar]
- Sears, E. R., 1966 Nullisomic-tetrasomic combinations in hexaploid wheat, pp. 29–45 in Chromosome Manipulations and Plant Genetics, edited by R. Riley and K. R. Lewis. Oliver & Boyd, Edinburgh.
- Sears, E. R., and L. M. S. Sears, 1978 The telocentric chromosomes of common wheat, pp. 389–407 in Proceedings of the 5th International Wheat Genetics Symposium, edited by S. Ramanujam. Indian Society of Genetics and Plant Breeding, New Dehli.
- Smith, D. B., and R. B. Flavell, 1975. Characterisation of the wheat genome by renaturation kinetics. Chromosoma 50: 223–242. [Google Scholar]
- Sorrells, M. E., M. La Rota, C. E. Bermudez-Kandianis, R. A. Greene, R. Kantety et al., 2003. Comparative DNA sequence analysis of wheat and rice genomes. Genome Res. 13: 1818–1827. [DOI] [PMC free article] [PubMed] [Google Scholar]
- Tsujimoto, H., and K. Tsunewaki, 1988. Gametocidal genes in wheat and its relatives. III. Chromosome location and effects of two Aegilops speltoides-derived gametocidal genes in common wheat. Genome 30: 239–244. [Google Scholar]
- Van Deynze, A. E., J. C. Nelson, E. S. Yglesis, S. E. Harrington, D. P. Braga et al., 1995. Comparative mapping in grasses. Wheat relationships. Mol. Gen. Genet. 248: 744–754. [DOI] [PubMed] [Google Scholar]
- Walbot, V., and D. Petrov, 2001. Gene galaxies in the maize genome. Proc. Natl. Acad. Sci. USA 98: 8163–8164. [DOI] [PMC free article] [PubMed] [Google Scholar]
- Weng, Y., and M. D. Lazar, 2002. Comparison of homoeologous group-6 short arm physical maps of wheat and barley reveals a similar distribution of recombinogenic and gene-rich regions. Theor. Appl. Genet. 104: 1078–1085. [DOI] [PubMed] [Google Scholar]
- Worland, A. J., and C. N. Law, 1986. Genetic analysis of chromosome 2D of wheat. I. The location of genes affecting height, day length insensitivity, hybrid dwarfism and yellow rust resistance. Z. Pflanzenzücht. 96: 331–345. [Google Scholar]
- Worland, A. J., C. N. Law and A. Shakoor, 1980. The analysis of an induced height mutant in wheat. Heredity 45: 61–70. [Google Scholar]
- Yu, J., S. N. Hu, J. Wang, G. K. S. Wong, S. G. Li et al., 2002. A draft sequence of the rice genome (Oryza sativa L. ssp. indica). Science 296: 79–92. [DOI] [PubMed] [Google Scholar]
- Zhang, D., D. W. Choi, S. Wanamaker, R. D. Fenton, A. Chin et al., 2004. Construction and evaluation of cDNA libraries for large-scale expressed sequence tag sequencing in wheat (Triticum aestivum L.). Genetics 168: 595–608. [DOI] [PMC free article] [PubMed] [Google Scholar]