

Abstract
To localize wheat (Triticum aestivum L.) ESTs on chromosomes, 882 homoeologous group 6-specific ESTs were identified by physically mapping 7965 singletons from 37 cDNA libraries on 146 chromosome, arm, and sub-arm aneuploid and deletion stocks. The 882 ESTs were physically mapped to 25 regions (bins) flanked by 23 deletion breakpoints. Of the 5154 restriction fragments detected by 882 ESTs, 2043 (loci) were localized to group 6 chromosomes and 806 were mapped on other chromosome groups. The number of loci mapped was greatest on chromosome 6B and least on 6D. The 264 ESTs that detected orthologous loci on all three homoeologs using one restriction enzyme were used to construct a consensus physical map. The physical distribution of ESTs was uneven on chromosomes with a tendency toward higher densities in the distal halves of chromosome arms. About 43% of the wheat group 6 ESTs identified rice homologs upon comparisons of genome sequences. Fifty-eight percent of these ESTs were present on rice chromosome 2 and the remaining were on other rice chromosomes. Even within the group 6 bins, rice chromosomal blocks identified by 1–6 wheat ESTs were homologous to up to 11 rice chromosomes. These rice-block contigs were used to resolve the order of wheat ESTs within each bin.
COMMON wheat (Triticum aestivum L.) is an allohexaploid (2n = 6x = 42, AABBDD) containing three homoeologous genomes (Sears 1954). Among important cereals, the wheat genome with 16,000 Mb is the largest and rice (Oryza sativa L.) with 415 Mb is the smallest (Arumuganathan and Earle 1991). The wheat genome is ∼100 times larger than the model plant Arabidopsis. Even in Arabidopsis only ∼45% of the genome represents the gene-containing fraction that is interspersed with noncoding DNA primarily composed of retrotransposon-like repetitive sequences (Barakat et al. 1997; Bennetzen et al. 1998; Sidhu and Gill 2004).
Estimates for the gene-containing fraction of the wheat genome range from 1 to 5% obtained from the available sequence data comparisons with other plant genomes to 15% by DNA reassociation kinetics experiments (Flavell et al. 1974; Sandhu and Gill 2002; Sidhu and Gill 2004). Deletion mapping of ∼2000 gene marker loci showed that genes on wheat chromosomes are also unevenly distributed (Gill et al. 1996a,b; Faris et al. 2000; Sandhu et al. 2001; Sandhu and Gill 2002; Akhunov et al. 2003a,b). About 30% of the wheat genome appears to contain >85% of the genes (Erayman et al. 2004). The remaining 70% of the genome, present as large blocks interspersed by the gene-rich regions, appears to be gene empty. Therefore, targeting the expressed portion of the genome is particularly important for wheat.
Obtaining partial cDNA sequences [expressed sequence tags (ESTs)] from various developmental stages and in response to various biotic and abiotic stresses of the plant is an efficient, economical, and quick approach to target the expressed portion of any genome. About 19 million ESTs representing 600,000 unigenes from >80 organisms are available (http://www.ncbi.nlm.nih.gov; Adams et al. 1991). For wheat, >500,000 ESTs corresponding to ∼22,000 unigenes have been isolated. However, the full potential of the utility of ESTs in genomics cannot be realized without revealing their physical location on chromosomes. Physical mapping of ESTs is particularly important in wheat because of the highly uneven distribution of genes on chromosomes.
Physical mapping of DNA markers is relatively easy in wheat because a wealth of aneuploid stocks is available. A complete series of nullisomic-tetrasomic (NT; a line lacking a pair of chromosomes, loss of which is compensated for by an extra pair of one of its homoeologs) and ditelosomic (DT) lines (Sears 1954) can be used to reveal arm location of markers (Anderson et al. 1992). In addition, 436 chromosome deletion lines are available for the 21 wheat chromosomes that can be used for intrachromosomal mapping (Endo and Gill 1996). These stocks have been extensively used to physically map >2000 DNA markers (Werner et al. 1992; Gill et al. 1993; Kota et al. 1993; Hohmann et al. 1994; Delaney et al. 1995a,b; Mickelson-Young et al. 1995; Gill et al. 1996a,b; Faris et al. 2000; Weng et al. 2000; Sandhu et al. 2001; Dilbirligi et al. 2004; Erayman et al. 2004).
A National Science Foundation-funded collaborative project was initiated with a goal to physically map 10,000 wheat unigene ESTs using the aneuploid and deletion stocks. Wheat homoeologous group 6 data are reported in this article. Similar data for the other six homoeologous groups are presented in the accompanying articles in this issue. We also report identification of rice chromosomal regions homologous to wheat group 6 chromosomes and the use of rice to reveal EST order within each wheat bin.
MATERIALS AND METHODS
Genetic stocks:
Chromosome arm locations of the selected ESTs were revealed using 21 NT and 24 DT lines (Sears 1954, 1966; Sears and Sears 1978). For sub-arm localization of ESTs, 101 deletion lines carrying 120 breakpoints were selected (Endo and Gill 1996). Of these, 17 were for homoeologous group 6 that, along with 6 DT breakpoints, divided the group 6 chromosomes into 26 bins. All the aneuploid and deletion stocks used for the study were in cultivar Chinese Spring (CS) background. The deletion breakpoints were expressed as a fraction length (FL) value of the arm retained in the deletion chromosome. The stocks were provided by the Wheat Genetics Resource Center (WGRC), Kansas State University, Manhattan, KS.
EST selection:
As of February 2, 2004, 8318 singletons from ∼117,000 ESTs derived from ∼37 cDNA libraries were mapped by the whole project. Details concerning the cDNA libraries, ESTs, and singletons are given elsewhere (http://wheat.pw.usda.gov/NSF; Lazo et al. 2004; Zhang et al. 2004). For the analysis presented here and in the accompanying articles in this issue, the March 17, 2003, data set of 4485 mapped and verified ESTs was used. From this data set, 882 ESTs mapped to homoeologous group 6.
Deletion mapping:
Genomic DNA isolation, restriction enzyme digestion, and gel-blot analysis were performed as described by Sandhu et al. (2001). Gel-blot analysis was performed using 15 μg of genomic DNA digested with EcoRI enzyme. The NT, DT, and the deletion lines were used in a single hybridization reaction on a set of five filters. The lane order for the filters is provided at http:/wheat.pw.usda.gov/NSF. Each fragment band (locus) was mapped to a chromosome region (bin) flanked by breakpoints of the largest deletion possessing the fragment and the smallest deletion lacking it. The chromosome size data of CS were taken from B. S. Gill et al. (1991). The number of expected loci per arm was calculated on the basis of its physical length. The mapping data along with the gel-blot analysis images are available at http://wheat.pw.usda.gov/cgi-bin/westsql/map_locus.cgi.
Consensus physical map:
A consensus physical map of homoeologous group 6 chromosomes was constructed using the criteria described in Gill et al. (1996a)(b) except that only the ESTs that detected orthologous loci on all three chromosomes were used. The breakpoints of all group 6 deletions were placed on a hypothetical chromosome drawn to scale on the basis of the mean length of group 6 chromosomes. The deletion mapping data from the three chromosomes were then combined to position each EST to the shortest possible chromosome interval. In case of a discrepancy, a location consistent with two homoeologs was used.
Wheat-rice comparisons:
The 882 group 6 ESTs were compared with the rice genomic sequence using “blast” (http://www.ncbi.nih.gov/; Altschul et al. 1997). A cutoff E-value of E < 10−20 and sequence length >100 bases (for E-values < E < 10−20) were used to identify rice homologs that were equivalent to >65% nucleotide sequence homology. Rice bacterial artificial chromosome (BAC) and P1-derived artificial chromosome (PAC) contigs (http://rgp.dna.affrc.go.jp) corresponding to each group 6 bin were identified and used to order 385 group 6 wheat ESTs.
RESULTS
Distribution of ESTs:
Of the March 7, 2003 data set of 4485 mapped and verified project ESTs, 882 ESTs mapped to homoeologous group 6 chromosomes, using only the EcoRI enzyme. These group 6 ESTs detected 5154 restriction fragment bands, and each fragment band was considered as a locus. The NT and DT analyses mapped 2849 (55%) of these loci to specific chromosome arms. The remaining 2305 (45%) fragment bands were not mapped, as these were monomorphic among the NT lines. The 882 ESTs, mapped on homoeologous group 6, detected 2043 loci on group 6 and 806 loci on other homoeologous groups. Among the homoeologs, chromosome 6B had the highest number of loci and 6D had the lowest. Of the 882 ESTs, 518 detected 665 loci on chromosome 6A, 601 detected 777 loci on 6B, and 488 ESTs detected 601 loci on chromosome 6D (Figure 1).
Figure 1.—

Deletion maps of wheat chromosomes 6A, 6B, and 6D. The chromosomes are drawn to scale. Each centromere is marked by a constriction and the C-bands are shown as solid boxes. The deletion breakpoints along with fraction length (FL) are marked by arrows on the left of the chromosomes and the number of EST loci in each bin is on the right.
Distribution of the group 6-specific EST loci on the three homoeologous chromosomes showed that 264 EST probes detected 873 loci on all three homoeologs, 192 detected 472 on two, and the remaining 426 detected 698 loci on only one of the chromosomes (Figure 2). The number of loci mapping on the long arms was significantly higher than that on the short arms. The numbers of short-arm loci were 289, 311, and 255 for 6A, 6B, and 6D, respectively, compared to 369, 461, and 336 for the long arms (Figure 3). Twenty-two loci mapped in the centromeric region, of which 7 were on 6A, 5 on 6B, and 10 on 6D (Figure 1). A comparison of these numbers with the expected number based on the physical length of the arms showed significant differences (χ2, P = 0.012) between the observed and the expected numbers (Figure 3). In general, the observed number of loci for the short arms was lower than expected. For example, 46% of the loci were expected to be present on 6BS whereas only 40% were observed. Consequently, the long arm had ∼11% more loci than expected. Similar observations were made for the other two chromosomes.
Figure 2.—

Distribution of 2043 homoeologous group 6-specific EST loci by genome. The actual number of loci is shown at the top of each bar.
Figure 3.—

Comparison of observed and expected numbers of homoeologous group 6-specific EST loci. The shaded and solid bars represent the short and long arms, respectively. The actual numbers are given at the top of the bars; not counted are the 22 loci that mapped to centromere bins.
The distribution of ESTs was uneven along the group 6 chromosomes. Distal bins had more EST loci per unit size compared to the proximal bins (Figure 1). The bin proximal to deletion C-6DL-6 had the lowest EST density. This bin is ∼1.6 μm in length and that translates to ∼106 Mb DNA (B. S. Gill et al. 1991). The calculated EST density based on the 27 loci mapped to the bin was ∼0.25 loci/Mb. The bin distal to deletion 6DS-6 had the highest density, 16 loci/Mb, with 47 loci and a size of ∼3 Mb. Similarly, EST density in the 6A bin distal to deletion 6AL-8 was 4.38 loci/Mb compared to 0.63 loci/Mb for the bin proximal to deletion 6AL-4. Detailed mapping information for all the ESTs in each group 6 bin can be accessed from the GrainGenes database website (http://wheat.pw.usda.gov/wEST).
Copy number of expressed sequences:
On average, each EST detected 5.8 fragment bands with a range from 1 to 39. Frequency of loci detected by group 6 ESTs in comparison with other homoeologous groups showed that only 37% of the ESTs detected the expected 3 or 4 fragment bands (Figure 4). About 11% of the ESTs detected only 1–2 loci, suggesting deletion of homoeologous sequences. The remaining 52% of the ESTs detected 5 or more fragment bands. From the total 2849 loci, 2043 mapped to group 6 chromosomes and the remaining 806 mapped on the other chromosomes. Approximately 30% of loci were duplicated. Of these, 6% were intrachromosomal duplications and the remaining were on other chromosomes. Among the 30 intrachromosomal duplications, 15 were on opposite arms. No difference was observed among homoeologs for the rate of intrachromosomal duplications. However, >75% of these duplications were observed in the proximal 50% of the chromosomes. The proximal bins C-6AL4, C-6DS2, and C-6AS1 showed the greatest number of duplications.
Figure 4.—

Comparison of the frequency of the bands (fragments) detected by ESTs mapping on group 6 with that of those mapping on other wheat homoeologous groups. The percentage of ESTs detecting the number of fragments is given at the top of the bars.
Consensus physical map:
The consensus physical map containing 262 ESTs is presented in Figure 5. Location of 223 ESTs was consistent among the three homoeologs (Table 1). For the remaining 39 that showed discrepancies (marked by * in Table 1), the physical location consistent with two homoeologs was used. Of the 39 ESTs with discrepant map locations among homoeologs, 21 mapped to the adjacent bins, suggesting that the discrepancy was due to FL value variation among the homoeologs. The remaining 18 ESTs mapped to nonadjacent bins, of which 13 mapped on the opposite arm.
Figure 5.—
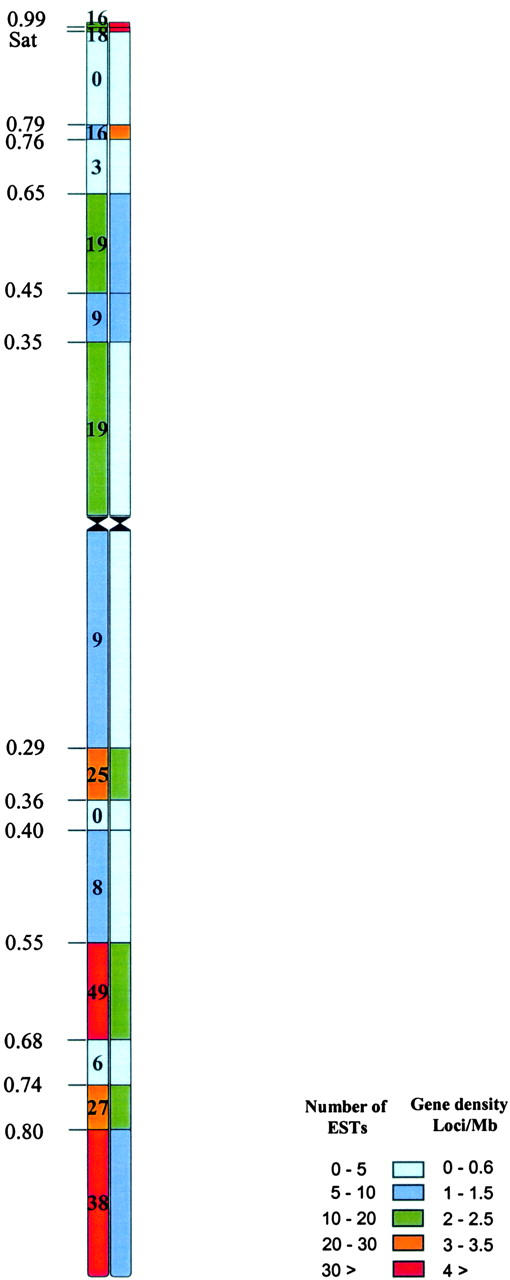
A consensus physical map of homoeologous group 6 chromosomes. The physical map on the left was generated on the basis of the actual number of ESTs per bin, whereas the map on the right was based on EST density. Deletion breakpoints are indicated by lines and FL values on the left. The numbers in the boxes and color scheme for the left side of the consensus physical chromosome represent the number of ESTs present in that region and the right side represents the gene density based on the percentage of the chromosome arm.
TABLE 1.
Order of wheat ESTs mapped on group 6 physical map determined from rice BAC/PAC comparison
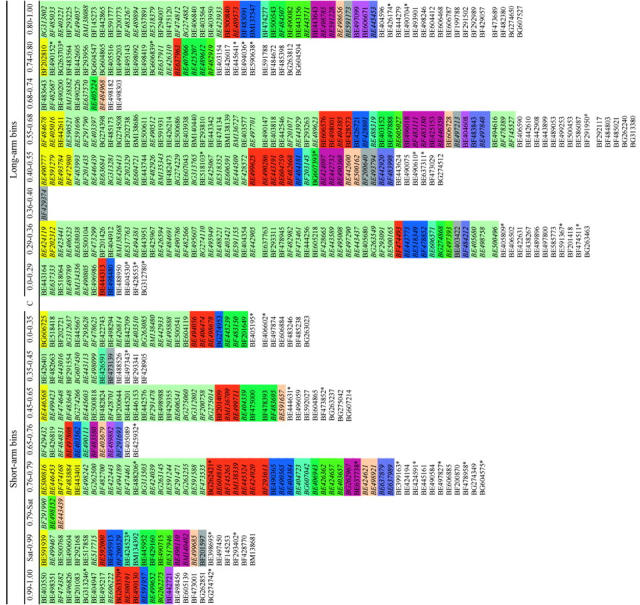
Colored boxes represent different rice chromosomes, 1–12, with colors as shown in Figure 6. ESTs with discrepant location are marked with an *. ESTs that are italicized are not mapped on the consensus map. ESTs with regular font but no color are mapped on the consensus map, but have no match with rice sequences. The order of the ESTs within a column from top to bottom corresponds to the order from distal to proximal within bins for the short arm and from proximal to distal on the long arm. The bin designations are the flanking deletion breakpoints, proximal to distal; see Figures 5 and 6.
Uneven distribution of ESTs was even more distinct on the consensus physical map. The distal 60% of the consensus map contained ∼80% of the ESTs (Figure 5). The number of ESTs per bin ranged from zero (in the long-arm bin 0.36-0.40 and the short-arm bin 0.79-Sat) to 49 (in the long-arm bin 0.55-0.68). Because of significant size differences among bins, EST density was calculated per unit size. The EST density per unit chromosome length ranged from 0% in consensus regions 0.36–0.40 of the long arm and 0.79–Satellite (Sat) of the short arm to 23% in the short-arm region Sat–0.99 (Figure 5). In general, the smaller-sized bins had a higher EST density. For example, the short-arm regions Sat–0.99 and 0.99–1.00 (∼3 Mb each) accounted for 20–23% of the ESTs.
Comparative mapping:
To find rice regions corresponding to each of the group 6 bins, 882 group 6 ESTs were compared against the available rice sequences. At the level of stringency used for comparison, only 385 (43%) of the 882 wheat ESTs identified rice homologs; of these, 225 (58%) showed homology to rice chromosome 2, whereas the remaining 160 (42%) corresponded to regions on the other 11 rice chromosomes. The percentage of the wheat ESTs mapping on the other rice chromosomes ranged from 1.3% on chromosome 11 to 8.3% on chromosome 3. With a mean of 6.5, the number of rice chromosomes represented in each wheat bin ranged from 1 (in the long-arm bin 0.36–0.40) to 11 (in the long-arm bin 0.80–1.00) (Figure 6). Within each wheat bin, rice chromosomes other than chromosome 2 were identified by ESTs ranging from 1 to 6 with an average of 2.7. However, chromosome-specific rice contigs corresponding to each wheat bin were discontinuous as homologs were not present for all BACs/PACs present in rice contigs.
Figure 6.—
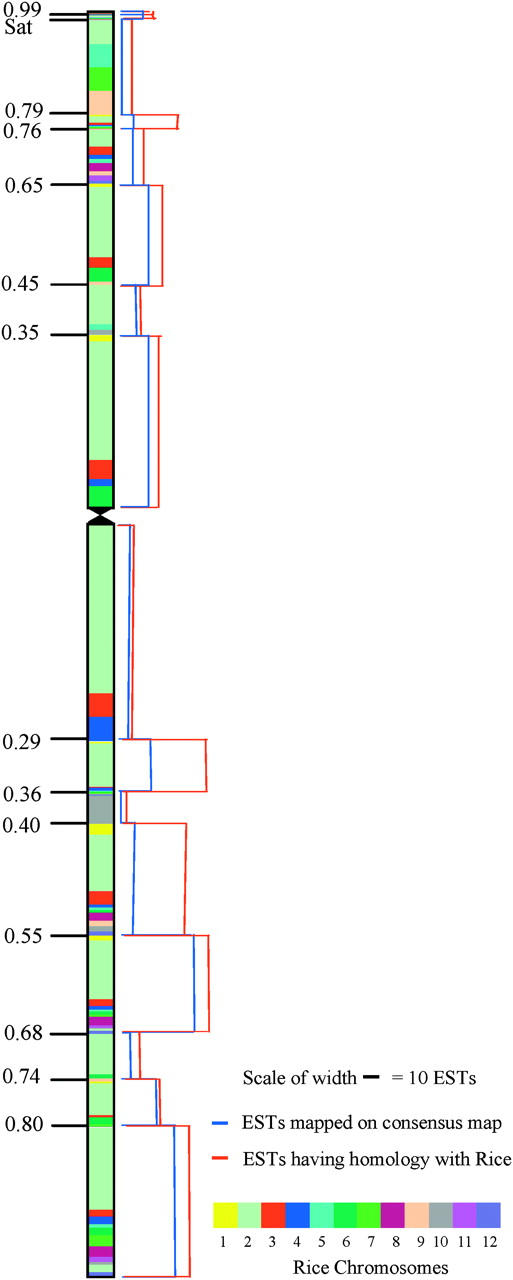
Comparative analysis of wheat group 6 ESTs with rice BAC/PAC sequences. The wheat consensus chromosome 6 is shown with deletion breakpoints and FL values on the left. Each deletion bin is color coded according to the rice chromosome with matching ESTs mapped to that bin. Each bin is spanned by red and blue bar charts on the right of the chromosome. The bar charts are drawn to scale using actual number of ESTs. The width of the red bar chart shows the number of wheat ESTs with homology to the rice chromosomes and the blue bar chart shows the number of ESTs on the consensus wheat group 6 map.
To examine differences among wheat bins for rice homology, the number of ESTs per consensus region (Figure 6, blue bar chart) was compared with that of ESTs showing homology to rice sequence (Figure 6, red bar chart). The width of the blue bar chart was drawn to scale on the basis of the location of 225 ESTs that were present on the consensus physical map. The width of the red bar chart was drawn to scale using 385 ESTs that identified rice homologs. Significant differences were observed among the wheat bins for their homology to rice. For example, wheat regions 0.29–0.36 and 0.55–0.68 on the long arm and 0.76–0.79 on the short arm showed the highest levels of homology with the rice chromosomes (Figure 6). On the other hand, the long-arm regions 0.36–0.40 and 0.68–0.74 and short-arm region 0.79–Sat possessed the least homology. Wheat ESTs mapping on all homoeologs identified rice homologs more frequently than others did. Of the 262 ESTs present on the consensus map, 143 (54%) detected rice homologs compared to 39% for the remaining ESTs.
Rice BAC/PAC contigs corresponding to each of the group 6 bins were used for intrabin ordering of ESTs (Table 1). The order of the 385 wheat ESTs present in the 16 bins of the consensus map was revealed using rice sequences. Of these, 219 were homologous to rice chromosome 2, 32 to chromosome 3, 17 to chromosome 1, and the remaining were homologous to other rice chromosomes.
DISCUSSION
Major cereal crops including wheat (T. aestivum L.), maize (Zea mays L.), barley (Hordeum vulgare L.), and rice (O. sativa L.) belong to the grass family Poaceae. Comparisons of genetic maps and DNA sequences have suggested that these grass genomes originated from a common ancestor 50–60 million years ago (Bennetzen and Freeling 1993; Kellogg 1998) and have similar gene composition and colinearity (Ahn and Tanksley 1993; Ahn et al. 1993). The number of functional genes in these crop plants is not known. The number of genes in rice estimated from genome sequence analysis ranges from 32,000 to 50,000 (Goff et al. 2002). In hexaploid wheat, the gene number estimates range from 75,000 to 150,000, or ∼10,000–20,000 gene loci per homoeologous group (Sidhu and Gill 2004). Here we report physical mapping of >2000 loci (10–20% of the total) for wheat homoeologous group 6. We also show the general distribution of genes on the chromosomes.
Deletion mapping revealed significant differences among group 6 homoeologs for the number of loci. The comparison between the expected and observed numbers of loci indicated that the number of loci is not always proportional of the size of the chromosome arm. Maximum number was observed for the 6B and minimum for 6D. This difference may partly be due to the variable sizes of the homoeologs, which are predicted to be 863, 673, and 667 Mb for 6B, 6D, and 6A, respectively (B. S. Gill et al. 1991). Another factor explaining this difference may be the number of duplicated loci that may differ among homoeologs.
Dramatic differences were observed for the number of loci per bin. These differences were more pronounced on the consensus physical map mainly because there were three times more breakpoints resulting in a finer resolution. The estimated bin size on the individual deletion maps ranged from ∼3 (the bin distal to deletion 6DS-6) to 299 Mb (C-6BS-5) with a mean of 88 Mb (Figure 1). On the other hand, consensus-map bin size ranged from 3 (for short-arm bin 0.99–1.00) to 119 Mb (for short-arm bin 0.0–0.35) with a mean of 43 Mb (Figure 5). More than a 30-fold difference was observed for gene density among bins on the consensus map compared to a 14-fold difference in size among individual bins. This comparison suggests that the difference in gene density may be even greater if additional breakpoints were available (Gill et al. 1996b; Erayman et al. 2004). The limitations of the consensus map construction are pointed out by the fact that ∼15% of the ESTs had discrepant locations among the homoeologs. Although order and colinearity are conserved among the three genomes for most of the genes, significant differences may be present due to differential amplification of the three genomes, chromosomal rearrangements, and gene copy number.
Using only one restriction enzyme, ∼30% of the ESTs detected loci on all three chromosomes, 22% detected loci on two, and the remaining ESTs detected loci only on one of the three homoeologs. This large number of ESTs mapping to only one of the chromosomes can be attributed to the use of only one restriction enzyme. By using two restriction enzymes for a similar physical mapping experiment, ∼81% (61/75) wheat group 1 gene markers detected loci on all three homoeologs, 12% (9/75) detected loci on two, and only 7% (5/75) detected loci on one of the three genomes (Sandhu et al. 2001). In the present study, ∼45% (2305/5154) of the fragments detected by group 6-specific ESTs were monomorphic and that may be resolved with the use of additional restriction enzymes.
The extent and distribution of EST duplication on group 6 chromosomes was similar to that reported for the wheat genome as a whole (Qi et al. 2004). About 21% of the wheat sequences have paralogous loci (Akhunov et al. 2003a). In this study, 32% (287) of the ESTs detected paralogous loci on other chromosomes ranging from 13% for group 4 to 20% for groups 2 and 7. About 4% of the ESTs detected paralogous loci on group 6, of which one-half were on the same chromosome. In barley, 20–30% of probes detected duplicated loci (Graner et al. 1991; Kleinhofs et al. 1993). Some of the other similar estimates obtained from the genetic linkage analysis were 28% of the cDNA clones and 34% of the PstI genomic clones in T. monococcum L. (Dubcovsky et al. 1996), and 31% in Aegilops tauschii Coss. (K. S. Gill et al. 1991). These duplicated loci could have resulted from interchromosomal exchanges, intergenomic invasions, and dispersion of specific DNA elements during genome evolution through polyploidization (Wendel 2000; Akhunov et al. 2003a).
Several wheat-rice comparisons have been made and slightly different results were observed, depending on methods and criteria. Genetic linkage-map comparisons between wheat and rice identified syntenic chromosomes between the two genomes (Ahn et al. 1993; Kurata et al. 1994; Devos et al. 1995; Sherman et al. 1995; Van Deynze et al. 1995; Saghai-Maroof et al. 1996; Devos and Gale 1997). Depending upon stringency, sequence comparisons between wheat and rice showed that 50–98% of the rice genes are similar to those of wheat. For example, Goff et al. (2002) reported ∼98% protein sequence homology among rice, maize, wheat, and barley. On the other hand, 65% of wheat ESTs identified rice homologs at E < 10−15 (Sorrells et al. 2003). Similar comparisons in the present study at a slightly higher stringency showed that only ∼43% of group 6 ESTs have rice homologs. Even at a liberal cutoff value (E < 10−1), only 67% (593/882) of the ESTs detected rice homologs. Therefore, we conclude that at least 33% of the wheat ESTs do not have rice homologs.
Previous studies using RFLP markers (Gale and Devos 1998) and wheat ESTs (Sorrells et al. 2003) have reported that wheat homoeologous group 6 chromosomes illustrate substantial homology to rice with the best conservation of gene order and content with rice chromosome 2 (Sorrells et al. 2003). In the present study, however, of the 43% group 6 ESTs that identified rice homologs, only 58% were on rice chromosome 2. The remaining were present as small blocks on the other rice chromosomes.
Individual bin comparisons with rice sequences showed that, in addition to chromosome 2, other rice chromosome segments were present in all the bins as 1–10 blocks of varying sizes. Each rice chromosomal block was identified by 1–6 wheat ESTs, suggesting that these blocks are not paralogous loci but are true homologs of wheat group 6 scattered on other rice chromosomes (Figure 6). Since most of the rice chromosomal blocks homologous to wheat group 6 bins have been identified, it should be possible to use the rice sequence information efficiently and accurately for wheat genomics. Furthermore, rice BAC/PAC contigs can be used to order wheat ESTs within bins. In this study, we resolved the order of 385 wheat ESTs within 16 bins (Table 1). However, the accuracy of this order needs to be determined.
Acknowledgments
The authors thank Anup Randhawa for her critical review of this manuscript. This is a contribution of the Agriculture Research Center, Washington State University, journal series no. 0301-04. This material is based upon work supported by the National Science Foundation under cooperative agreement no. DBI-9975989.
References
- Adams, M. D., J. M. Kelley, J. D. Gocayne, M. Dubnick, M. H. Polymeropoulos et al., 1991. Complementary DNA sequencing: expressed sequence tags and human genome project. Science 252: 1651–1656. [DOI] [PubMed] [Google Scholar]
- Ahn, S., and S. D. Tanksley, 1993. Comparative linkage maps of the rice and maize genomes. Proc. Natl. Acad. Sci. USA 90: 7980–7984. [DOI] [PMC free article] [PubMed] [Google Scholar]
- Ahn, S., J. A. Anderson, M. E. Sorrells and S. D. Tanksley, 1993. Homoeologous relationships of rice, wheat and maize chromosomes. Mol. Gen. Genet. 241: 483–490. [DOI] [PubMed] [Google Scholar]
- Akhunov, E. D., A. W. Goodyear, S. Geng, L. L. Qi, B. Echalier et al., 2003. a The organization and rate of evolution of wheat genomes are correlated with recombination rates along chromosome arms. Genome Res. 13: 753–763. [DOI] [PMC free article] [PubMed] [Google Scholar]
- Akhunov, E. D., A. R. Akhunova, A. M. Linkiewicz, J. Dubcovsky, D. Hummel et al., 2003. b Synteny perturbations between wheat homoeologous chromosomes caused by locus duplications and deletions correlate with recombination rates. Proc. Natl. Acad. Sci. USA 100: 10836–10841. [DOI] [PMC free article] [PubMed] [Google Scholar]
- Altschul, S. F., T. L. Madden, A. A. Schaffer, J. Zhang, Z. Zhang et al., 1997. Gapped BLAST and PSI-BLAST: a new generation of protein database search programs. Nucleic Acids Res. 25: 3389–3402. [DOI] [PMC free article] [PubMed] [Google Scholar]
- Anderson, J. A., Y. Ogihara, M. E. Sorrells and S. D. Tanksley, 1992. Development of a chromosomal arm map for wheat based on RFLP markers. Theor. Appl. Genet. 83: 1035–1043. [DOI] [PubMed] [Google Scholar]
- Arumuganathan, K., and E. D. Earle, 1991. Estimation of nuclear DNA content of plants by flow cytometry. Plant Mol. Biol. Rep. 9: 208–218. [Google Scholar]
- Barakat, A., N. Carels and G. Bernardi, 1997. The distribution of genes in the genomes of Graminae. Proc. Natl. Acad. Sci. USA 94: 6857–6861. [DOI] [PMC free article] [PubMed] [Google Scholar]
- Bennetzen, J. L., and M. Freeling, 1993. Grasses as a single genetic system: genome composition, colinearity and compatibility. Trends Genet. 9: 259–261. [DOI] [PubMed] [Google Scholar]
- Bennetzen, J. L., P. Sanmiguel, M. Chen, A. Tikhonov, M. Francki et al., 1998. Grass genomes. Proc. Natl. Acad. Sci. USA 95: 1975–1978. [DOI] [PMC free article] [PubMed] [Google Scholar]
- Delaney, D. E., S. Nasuda, T. R. Endo, B. S. Gill and S. H. Hulbert, 1995. a Cytologically based physical maps of the group-2 chromosomes of wheat. Theor. Appl. Genet. 91: 568–573. [DOI] [PubMed] [Google Scholar]
- Delaney, D. E., S. Nasuda, T. R. Endo, B. S. Gill and S. H. Hulbert, 1995. b Cytologically based physical maps of the group 3 chromosomes of wheat. Theor. Appl. Genet. 91: 780–782. [DOI] [PubMed] [Google Scholar]
- Devos, K. M., and M. D. Gale, 1997. Comparative genetics in the grasses. Plant Mol. Biol. 35: 3–15. [PubMed] [Google Scholar]
- Devos, K. M., J. Dubcovsky, J. Dvořák, C. N. Chinoy and M. D. Gale, 1995. Structural evolution of wheat chromosomes 4A, 5A, and 7B and its impact on recombination. Theor. Appl. Genet. 91: 282–288. [DOI] [PubMed] [Google Scholar]
- Dilbirligi, M., M. Erayman, D. Sandhu, D. Sidhu and K. S. Gill, 2004. Identification of wheat chromosomal regions containing expressed resistance genes. Genetics 166: 461–481. [DOI] [PMC free article] [PubMed] [Google Scholar]
- Dubcovsky, J., M. C. Luo, G. Y. Zhong, R. Bransteitter, A. Desai et al., 1996. Genetic map of diploid wheat, Triticum monococcum L., and its comparison with maps of Hordeum vulgare L. Genetics 143: 983–999. [DOI] [PMC free article] [PubMed] [Google Scholar]
- Endo, T. R., and B. S. Gill, 1996. The deletion stocks of common wheat. J. Hered. 87: 295–307. [Google Scholar]
- Erayman, M., D. Sandhu, D. Sidhu, M. Dilbirligi and K. S. Gill, 2004. Demarcating the gene-rich regions of the wheat genome. Nucleic Acids Res. 32: 3546–3565. [DOI] [PMC free article] [PubMed] [Google Scholar]
- Faris, J. D., K. M. Haen and B. S. Gill, 2000. Saturation mapping of a gene-rich recombination hot spot region in wheat. Genetics 154: 823–835. [DOI] [PMC free article] [PubMed] [Google Scholar]
- Flavell, R. B., M. D. Bennett, J. B. Smith and D. B. Smith, 1974. Genome size and the proportion of repeated nucleotide sequence DNA in plants. Biochem. Genet. 12: 257–269. [DOI] [PubMed] [Google Scholar]
- Gale, M. D., and K. M. Devos, 1998. Comparative genetics in the grasses. Proc. Natl. Acad. Sci. USA 95: 1971–1974. [DOI] [PMC free article] [PubMed] [Google Scholar]
- Gill, B. S., B. Friebe and T. R. Endo, 1991. Standard karyotype and nomenclature system for description of chromosome bands and structural aberrations in wheat (Triticum aestivum). Genome 34: 830–839. [Google Scholar]
- Gill, K. S., E. L. Lubbers, B. S. Gill, W. J. Raupp and T. S. Cox, 1991. A genetic linkage map of Triticum tauschii (DD) and its relationship to the D genome of bread wheat (AABBDD). Genome 34: 362–374. [Google Scholar]
- Gill, K. S., B. S. Gill and T. R. Endo, 1993. A chromosome region-specific mapping strategy reveals gene-rich telomeric ends in wheat. Chromosoma 102: 374–381. [Google Scholar]
- Gill, K. S., B. S. Gill, T. R. Endo and E. V. Boyko, 1996. a Identification and high-density mapping of gene-rich regions in chromosome group 5 of wheat. Genetics 143: 1001–1012. [DOI] [PMC free article] [PubMed] [Google Scholar]
- Gill, K. S., B. S. Gill, T. R. Endo and T. Taylor, 1996. b Identification and high-density mapping of gene-rich regions in chromosome group 1 of wheat. Genetics 144: 1883–1891. [DOI] [PMC free article] [PubMed] [Google Scholar]
- Goff, S. A., D. Ricke, T. H. Lan, G. Presting, R. Wang et al., 2002. A draft sequence of the rice genome (Oryza sativa L. ssp. japonica). Science 296: 92–100. [DOI] [PubMed] [Google Scholar]
- Graner, A., A. Jahoor, J. Schondelmaier, H. Siedler, K. Pillen et al., 1991. Construction of an RFLP map of barley. Theor. Appl. Genet. 83: 250–256. [DOI] [PubMed] [Google Scholar]
- Hohmann, U., T. R. Endo, K. S. Gill and B. S. Gill, 1994. Comparison of genetic and physical maps of group 7 chromosomes from Triticum aestivum L. Mol. Gen. Genet. 245: 644–653. [DOI] [PubMed] [Google Scholar]
- Kellogg, E., 1998. Relationships of cereal crops and other grasses. Proc. Natl. Acad. Sci. USA 95: 2005–2010. [DOI] [PMC free article] [PubMed] [Google Scholar]
- Kleinhofs, A., A. Kilian, M. A. Saghai-Maroof, R. M. Biyashev, P. Hayes et al., 1993. A molecular, isozyme and morphological map of the barley (Hordeum vulgare) genome. Theor. Appl. Genet. 86: 705–712. [DOI] [PubMed] [Google Scholar]
- Kota, R. S., K. S Gill, B. S. Gill and T. R. Endo, 1993. A cytogenetically based physical map of chromosome 1B in common wheat. Genome 36: 548–554. [DOI] [PubMed] [Google Scholar]
- Kurata, N., G. Moore, Y. Nagamura, T. Foote, M. Yano et al., 1994. Conservation of genomic structure between rice and wheat. Biotechnology 12: 276–278. [Google Scholar]
- Lazo, G. R., S. Chao, D. D. Hummel, H. Edwards, C. C. Crossman et al., 2004. Development of an expressed sequence tag (EST) resource for wheat (Triticum aestivum L.): unigene analysis, probe selection and bioinformatics for a 16,000-locus bin map. Genetics 168: 585–593. [DOI] [PMC free article] [PubMed] [Google Scholar]
- Mickelson-Young, L., T. R. Endo and B. S. Gill, 1995. A cytogenetic ladder-map of the wheat homoeologous group 4 chromosomes. Theor. Appl. Genet. 90: 1007–1011. [DOI] [PubMed] [Google Scholar]
- Qi, L. L., B. Echalier, S. Chao, G. R. Lazo, G. E. Butler et al. 2004. A chromosome bin map of 16,000 expressed sequence tag loci and distribution of genes among the three genomes of polyploid wheat. Genetics 168: 701–712. [DOI] [PMC free article] [PubMed] [Google Scholar]
- Saghai-Maroof, M. A., G. P. Yang, R. M. Biyashev, P. J. Maughan and Q. Zhang, 1996. Analysis of the barley and rice genomes by comparative RFLP linkage mapping. Theor. Appl. Genet. 92: 541–551. [DOI] [PubMed] [Google Scholar]
- Sandhu, D., and K. S. Gill, 2002. Gene-containing regions of wheat and the other grass genomes. Plant Physiol. 128: 803–811. [DOI] [PMC free article] [PubMed] [Google Scholar]
- Sandhu, D., J. A. Champoux, S. N. Bondareva and K. S. Gill, 2001. Identification and physical localization of useful genes and markers to a major gene-rich region on wheat group 1S chromosomes. Genetics 157: 1735–1747. [DOI] [PMC free article] [PubMed] [Google Scholar]
- Sears, E. R., 1954 The Aneuploids of Common Wheat. Bull. 572, University of Missouri Agricultural Experiment Station, Columbia, MO.
- Sears, E. R, 1966 Nullisomic-tetrasomic combinations in hexaploid wheat, pp. 29–45 in Chromosome Manipulations and Plant Genetics, edited by R. Riley and K. R. Lewis. Oliver & Boyd, Edinburgh.
- Sears, E. R., and L. M. S. Sears, 1978 The telocentric chromosomes of common wheat, pp. 389–407 in Proceedings of the 5th International Wheat Genetics Symposium, edited by S. Ramanujam. Indian Society of Genetics & Plant Breeding, New Delhi, India.
- Sherman, J. D., A. L. Fenwick, D. M. Namuth and N. L. V. Lapitan, 1995. A barley RFLP map: alignment of the three barley maps and comparisons to gramineae species. Theor. Appl. Genet. 91: 681–690. [DOI] [PubMed] [Google Scholar]
- Sidhu, D., and K. S. Gill, 2004. Distribution of genes and recombination in wheat and other eukaryotes. Plant Cell Tissue Organ Cult. (in press).
- Sorrells, M. E., M. La Rota, C. E. Bermudez-Kandianis, R. A. Greene, R. Kantety et al., 2003. Comparative DNA sequence analysis of wheat and rice genomes. Genome Res. 13: 1818–1827. [DOI] [PMC free article] [PubMed] [Google Scholar]
- Van Deynze, A. E., J. C. Nelson, E. S. Yglesias, S. E. Harrington, D. P. Braga et al., 1995. Comparative mapping in grasses. Wheat relationships. Mol. Gen. Genet. 248: 744–754. [DOI] [PubMed] [Google Scholar]
- Wendel, J. F., 2000. Genome evolution in polyploids. Plant Mol. Biol. 42: 225–249. [PubMed] [Google Scholar]
- Weng, Y., N. A. Tuleen and G. E. Hart, 2000. Extended physical maps and a consensus physical map of the homoeologous group 6 chromosomes of wheat (Triticum aestivum L. em Thell.). Theor. Appl. Genet. 100: 519–527. [Google Scholar]
- Werner, J. E., T. R. Endo and B. S. Gill, 1992. Toward a cytogenetically based physical map of the wheat genome. Proc. Natl. Acad. Sci. USA 89: 11307–11311. [DOI] [PMC free article] [PubMed] [Google Scholar]
- Zhang, D., D. W. Choi, S. Wanamaker, R. D. Fenton, A. Chin et al., 2004. Construction and evaluation of cDNA libraries for large-scale expressed sequence tag sequencing in wheat (Triticum aestivum L.). Genetics 168: 595–608. [DOI] [PMC free article] [PubMed] [Google Scholar]