

Abstract
Chemical mutagenesis of the mouse is ongoing in several centers around the world, with varying estimates of mutation rate and number of sites mutable to phenotype. To address these questions, we sequenced ∼9.6 Mb of DNA from G1 progeny of ethylnitrosourea-treated mice in a large, broad-spectrum screen. We identified 10 mutations at eight unique sites, including six nonsynonymous coding substitutions. This calibrates the nucleotide mutation rate for two mutagenesis centers, implies significance criteria for positional cloning efforts, and provides working estimates of effective genetic target sizes for selected phenotypes.
MUTAGENESIS experiments provide both novel mutations for biological studies and the means to estimate genomic parameters of the traits under study. For example, the effective number of genes or the genome-wide target size for a particular phenotypic class are of interest both for understanding the genetic architecture of a trait and for assessing the saturation of mutable sites within a given screen. Estimates of these parameters depend on knowing the mutation rate within the experiment. Mutation rates, first defined by Muller, classically have been estimated by specific locus tests for failure to complement phenotype of a known mutation (Muller 1928; Russell 1951; Russell and Montgomery 1982). Such estimates can be biased by the nature of the chosen gene (or genes) and the generality of phenotypes caused by its mutation. Inferring the nucleotide substitution rate from specific locus data therefore requires assumptions about the fraction of sites mutable to the tested phenotype and is open to substantial locus-specific bias. For many applications, the specific locus mutation rate is a sufficient term by itself, irrespective of the underlying nucleotide change rate. Indeed, classical estimates of genetic target size for a phenotype and saturation level have focused on predicting gene number from the Poisson distribution and the frequency of induced alleles at known loci (Muller and Prokofyeva 1935; Horowitz and Leupold 1951), but this requires the assumption that the subject genes are equally mutable.
Several genomic applications would benefit from a direct measurement of the nucleotide substitution rate (Beier 2000; Kile et al. 2003). In particular, comparison of the nucleotide change rate to the rate of recovered phenotypic deviants should allow calculation of the effective genome target size mutable to a given phenotype, without making assumptions about the distribution of mutable sites among distinct genes. Direct ascertainment of induced nucleotide changes also provides immediate access to mutations of potential biological interest. Accurate measurement of the substitution rate is additionally useful in evaluating candidate polymorphisms in positional cloning efforts. Brown and colleagues have previously estimated the rate of nucleotide change in a large chemical mutagenesis using heteroduplex detection by denaturing HPLC as a surrogate for sequence (Coghill et al. 2002). These results may be difficult to apply more generally because few mutations were observed (and the detection rate was not established), the potential bias from sampling only three loci is unclear, and the mutagenesis protocol and strain choice are substantially different from those used in other centers. Here we use DNA sequencing at 84 sentinel sites across 51 autosomal genes to identify 10 mutations in mice generated by a protocol shared by several mouse mutagenesis centers. In addition to identifying potential functional mutations de novo, this work provides calibration of the nucleotide mutation rate averaged over a substantial number of individuals and genes for a mutagenesis protocol used by several U.S. centers.
MATERIALS AND METHODS
Mice:
C57BL/6J males were treated three times with ethylnitrosourea (ENU) with doses between 75 and 100 mg/kg at 1-week intervals essentially as described (Justice et al. 2000). After recovering fertility, ENU-treated males (G0) were bred to coisogenic females to produce G1 offspring that would be obligate heterozygotes for transmitted mutations and have the maximum point mutation density in somatic cells of any generation derived from these screens.
Estimating the probability of recovering homozygotes:
The probability of recovering a homozygote for a specific mutation in the G3 generation was calculated from the average litter sizes at each generation. An average of 2.8 G2 females were backcrossed to each G1 male, with an average of 6.25 progeny/G1 × G2 pair. Thus the average probability of at least one G3 homozygote, given heterozygosity of the G2 mother, is:
 |
where m is the mean G3 number for each G2. For m = 6.25, this is 0.834.
Since the probability of heterozygosity for a particular G2, given heterozygosity of her sire, is 0.5, the average probability of a G1 mutation being homozygous in G3 from a single G2 partner is
 |
Thus, the average probability for homozygosity with respect to a G1 mutation in the G3 derived from multiple G2 partners is
 |
where n is the mean number of G2 partners. This reduces to the regular expression:
 |
For m = 6.25 and n = 2.8, this is 0.779.
To confirm the accuracy of this statistical distribution, we also compared this estimated probability with the exact probability in each pedigree for the first 200 pedigrees. The comparison suggests that the calculation based on averages may overestimate the number of homozygous mutations sampled among the G3 by ∼7%.
Target selection and resequencing:
Exons were selected from GenBank records or draft mouse genome assembly (http://genome.ucsc.edu) on the basis of size and relevance to neuronal signaling or gene regulation. Flanking primers were designed using Primer 3 from the Massachusetts Institute of Technology Center for Genome Research web site (Rozen and Skaletsky 2000). Target exons were amplified from protease-treated tail biopsies with 40 cycles of PCR. Target sequences are listed in supplemental Table S1 at http://www.genetics.org/supplemental/. Amplified fragments were treated with exonuclease I and shrimp alkaline phosphatase (USB) to remove primers and nucleotides prior to cycle sequencing. Sequences were determined on an ABI 3100 or 3700 automated sequencer and analyzed using the Phred/Phrap/Consed suite of software to provide base quality scores (Ewing and Green 1998; Ewing et al. 1998; Gordon et al. 1998). Polymorphism and heterozygosity were detected using Polyphred (Nickerson et al. 1997; Rieder et al. 1998) and manually confirmed. A subset of this data was cross-validated manually using base calls from Applied Biosystems (Foster City, CA) software and visual inspection of trace files to identify heterozygotes. All candidate polymorphisms were reamplified and sequenced on each strand to confirm.
Phylogenetic analysis:
Orthologous sequences were identified by BLAST or translated BLAST searches of public databases using the full-length protein sequence of each target gene. Potential orthologs identified by these searches were then used to query mouse or human genomes to confirm likely orthology on the basis of being the best reciprocal matches between the two species. Collected sequences were aligned using a ClustalW (http://www.ebi.ac.uk/clustalw/#).
RESULTS
Efficient recovery of induced mutations:
ENU is a high-efficiency mutagen in the mouse germline (Russell and Montgomery 1982). To maximize recovery of homozygous mutations in an F3 screen, we treated male mice (G0) with a fractionated dose of ENU. After recovering fertility, these mice were bred to untreated females of the same strain to retain any induced mutations on a coisogenic background (Figure 1)
Figure 1.—

Mutagenesis and breeding. C57BL/6J male mice (G0) were injected with ENU to induce mutations in spermatogonia. Gametes carrying mutations (small asterisks) were recovered by breeding G0 males to C57BL/6J females (B6). Progeny males (G1) will be heterozygous for any transmitted mutations (large asterisk). G1 males were bred to B6 females and their tail biopsies were screened for mutations by DNA sequencing. G3 progeny derived by backcross of G2 females with their G1 sires were ascertained for neurological phenotypes. G3 litters from a given G1 include heterozygotes and homozygotes (double asterisk) for transmitted viable mutations.
. Progeny males (G1) were mated to untreated females and then to resulting females (G2) to produce G3 litters for phenotypic screening. An average of 17.5 ± 5.8 G3 progeny (from a backcross of the G1 male to 2.8 ± 0.9 G2 daughters) were examined per pedigree, resulting in an ∼80% probability of observing at least one homozygote for any mutation present in a G1 male (see materials and methods). Subgroups of these progeny have been comprehensively analyzed for more detailed neurological phenotypes, but all families have been ascertained for gross phenotypes, including obvious gait disturbance, hearing, and neurological signs related to inner ear malformations. Of 1036 G1 families examined (including those of the sequenced animals), 6 produced inner ear phenotypes and 11 gait abnormalities. To date, 65 lines identified by phenotype have been made available from the screen reported here and its continuation (http://nmf.jax.org/, including phenotypes not of central interest to this center), with >100 additional lines presently under development.
Calibration of nucleotide substitution rate:
To provide a more rigorous measure of nucleotide mutation rate in current mouse mutagenesis centers, we directly sequenced PCR products to identify de novo mutations in DNA from G1 male progeny of ENU-treated C57BL/6J mice using assays distributed across the genome (Figure 2)
Figure 2.—

G1 DNA sequencing. (A) Chromosomal locations of 54 autosomal genes resequenced. Genes are indicated by horizontal lines; genes separated by <0.5 Mb are shown by diagonal lines. Several genes were resequenced in more than one fragment for a total of 84 fragments. Solid stars indicate genes for which we observed nonsynonymous substitutions; open stars, synonymous substitutions. (B) Number of base calls at or above a given Q value (phrap). Base scores Q ≥ 15 were evaluated for potential heterozygosity. Restricting analysis to bases Q ≥ 20 does not substantially alter our results. Ovals indicate the number of mutations identified for a given initial Q value and later confirmed.
. To maximize the efficiency of a sequence-based screen, we selected mostly large exons among G-protein-coupled receptors and other genes of potential interest to the neuroscience community (Table S1 at http://www.genetics.org/supplemental/). Analysis of 9.6 Mb of sequence, including 84 assays from 51 genes in up to 510 G1 mice, identified 10 nucleotide substitutions, defining a nucleotide mutation rate of 1.04 × 10⁻⁶. As an estimate of data quality, the distribution of phred Q scores is shown in Figure 2B and listed in Table S1 at http://www.genetics.org/supplemental/. Each mutation was confirmed by sequencing both strands of a second amplification product from the same animal. Two substitutions were present in duplicate, indicating transmission of a premeiotic mutation to independent G1 animals for a total of eight unique mutations. Identical mutations in sibling G1 animals reflect the limited number of premeiotic spermatogonial stem cells that contribute to mature sperm in heavily mutagenized G0 males (Noveroske et al. 2000) and indicates, very approximately, 20% redundancy in the chromosomes screened.
Of eight unique mutations recovered, six predict amino acid substitutions in the encoded protein (Figure 3)
Figure 3.—
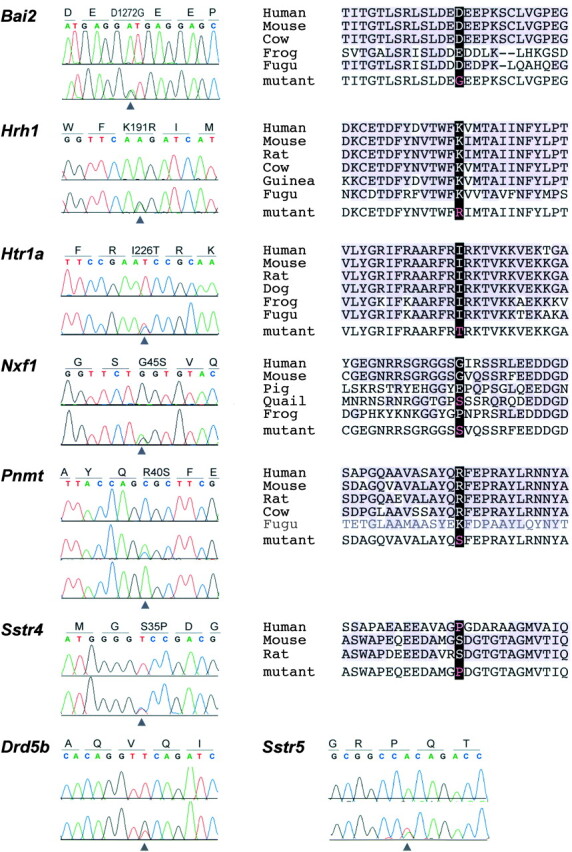
Mutations identified by resequencing. Heterozygous sequence traces and protein alignments are shown for mutations detected by resequencing. Gene names are indicated at left and the protein coding sequence and reading frame are indicated above each sequence trace. Homozygous mutant is also shown for Pnmt. Phylogenetic analysis using apparent orthologs (black text) or paralogs (gray text) is shown for each nonsynonymous substitution.
. To ask whether the missense mutations are likely to alter function of the encoded protein, we performed a phylogenetic analysis of local sequence conservation around the mutated site. BLAST and translated BLAST searches of public databases were used to identify likely orthologs from several taxa. Reciprocal BLAST searches with these candidate sequences against the mouse genome (and conservation of synteny where available) were used to confirm orthology. Presumptive orthologous sequences were aligned using ClustalW (http://www.ebi.ac.uk/clustalw/#). Three of the six mutations encode nonconservative changes at conserved sites, including charge replacements in the encoded residue, suggesting a higher likelihood of functional variation.
Calculation of genetic target sizes:
Calibration of the nucleotide change rate allows the calculation of the effective genetic target size for observed phenotype classes (Table 1)
TABLE 1 .
Calculations of mutable sites
|
|
Total |
A·T |
G·C |
|---|---|---|---|
| Fraction of transmitted substitutions | 1.00 | 0.82 | 0.18 |
| Substitution rate | 1.04 × 10⁻⁶ | 1.479 × 10⁻⁶ | 4.440E × 10−7 |
| Autosomal sites/genomea | 2.35 × 10⁹ | 1.36 × 10⁹ | 9.87 × 10⁹ |
| Substitutions/gamete | 2,457 | 2,017 | 438 |
| Substitution homozygotes/G1 family | 1,965 | 1,613 | 351 |
| Substitutions screened | 2,036,192 | 1,671,470 | 363,358 |
| Ataxics observed/gamete | 0.0106 | NA | NA |
| Ataxics generated/gamete | 0.0133 | 0.0109 | 0.0024 |
| Substitutions/ataxic | 185,108 | 185,307 | 183,514 |
| Ataxic sites/genome (0 degeneracy) | 12,701 | 7,358 | 5,381 |
| Ataxic sites/genome (twofold degeneracy) | 19,051 | 11,038 | 8,071 |
| Inner ear observed/gamete | 0.0058 | NA | NA |
| Inner ear generated/gamete | 0.0072 | 0.0059 | 0.0013 |
| Substitutions/inner ear phenotype | 339,365 | 339,730 | 336,443 |
| Inner ear sites/genome (0 degeneracy) | 6,928 | 4,014 | 2,935 |
| Inner ear sites/genome (twofold
degeneracy) |
10,391 |
6,021 |
4,402 |
Number of autosomal sites taken from Waterston et al. (2002).
. Taking the euchromatic genome as 2.49 × 10⁹ bp, of which 2.35 × 10⁹ bp is present in the autosomes (Waterston et al. 2002), and the nucleotide substitution rate as 1.04 × 10⁻⁶, then ∼2500 de novo substitutions should be present per G1 male. Approximately 80% of G1 substitutions should be observed at least once among G3 offspring (or slightly less, to account for those linked to induced recessive lethal mutations), so among the 1036 pedigrees ∼2.04 × 10⁶ de novo mutations should be represented by homozygotes. Therefore, one may estimate the effective fraction of mutations corresponding to the six observed inner ear defects and 11 gait ataxias as ∼1/340,000 and 1/185,000 substitutions, respectively.
This predicts a small genomic footprint for single base pairs mutable to each phenotype. Assuming no systematic bias in accessible sites, this would indicate effective target sizes for ENU mutagenesis of ∼6900 bp for inner ear and 12,700 bp for ataxia. To account for degenerate sites, we used reported mammalian codon frequencies (Zeeberg 2002) to calculate the average degeneracy of A·T or G·C positions in coding sequences corrected for reported mammalian codon frequencies (approximately twofold degeneracy on average; see Table S2 at http://www.genetics.org/supplemental/). Extending this correction (as an estimate) to all mutable sites predicts ∼10,400 sites mutable to inner ear phenotypes by single base change and ∼19,050 sites similarly mutable to ataxia. Correction for the known repair-dependent bias of ENU for A·T base pairs (82% of transmitted mutations; pooling data from Noveroske et al. 2000; Coghill et al. 2002; and the present study) does not significantly change these estimates based on a composite average.
Rate of closely linked, confounding mutations in cloning projects:
The nucleotide mutation rate also provides a substantial advantage in evaluating candidate mutations in subsequent positional cloning efforts. Using the average rate of 1.04 × 10⁻⁶ defined here, one may calculate the probability of an uncharacterized or confounding mutation as a function of interval size. A nucleotide substitution should occur in a block of 50 kb <5% of the time (Figure 4)
Figure 4.—
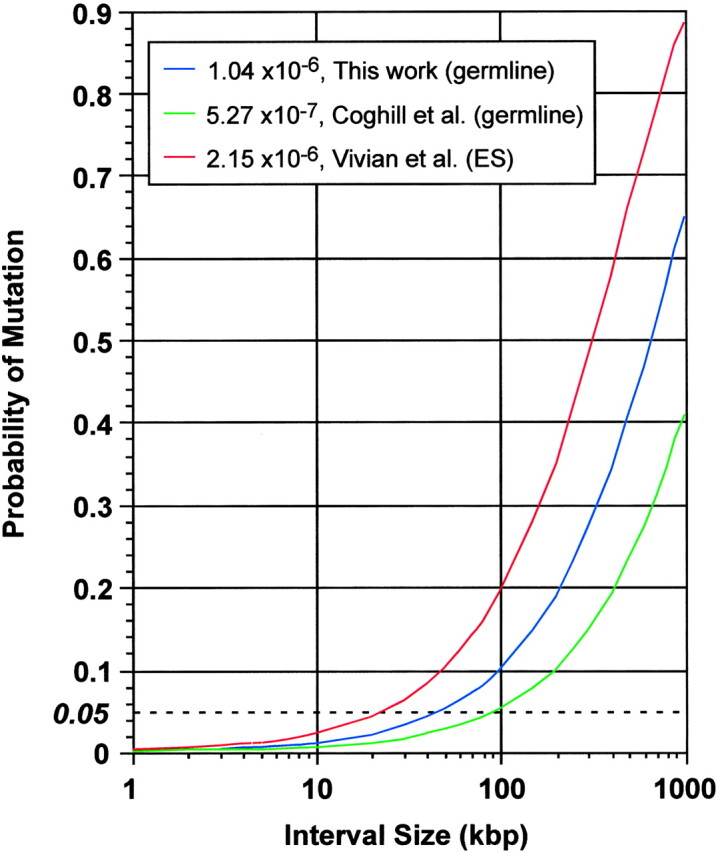
Probability of no confounding mutations as a function of interval size and mutation rate. Curves are shown for germline mutation rates reported here and by Coghill et al. (2002) and for the rate in ES cells reported by Vivian et al. (2002).
. More importantly, the rate of functional variation is much less. Only ∼5% of the mouse genome is thought to be under purifying selection (Waterston et al. 2002). Thus if the apparently functional (expressed, conserved, and known or predicted regulatory) sequences in a positional cloning interval are ascertained and only one nucleotide change is observed, it may be appropriate to infer causation on the basis of resequencing alone with confidence levels comparable to the traditional 0.05 significance level for single hypothesis tests. Consistent with this prediction, sequencing all known positional candidate genes (annotated transcripts or predicted transcripts with at least one EST in mouse or the corresponding region of humans) in a 1.7-Mb interval around a phenotypic mutation from this screen (Nmf9) identified a single base change (B. A. Hamilton, unpublished results).
DISCUSSION
We have applied independent measures of nucleotide and phenotypic mutation rates to estimate the effective target size for distinct phenotypic domains. We have limited this calculation to fairly broad phenotypes, so that sufficient numbers of mutants will have been recovered to make quantitatively accurate estimates, but in principle this could be extended to other phenotypes. Although these phenotypes can be produced by mutations in several dozens of genes, the simple calculation of mutable sites for two phenotype classes predicts only several kilobases of target DNA. It is possible that linkage to newly induced lethal mutations could reduce the average probability of observing homozygotes for phenotypic sites. Lethal mutations are the most frequent class in mouse, as in other animals; however, this remains a small fraction of chromosomes (Kile et al. 2003). It is therefore unlikely to skew the rate of homozygosity for other mutations enough to greatly affect our calculation of target size (as long as the distribution of G1 nucleotide changes is not clustered). It is also possible that small target sizes are a statistical anomaly, as the calculations here are based on relatively modest numbers of events and the variance on these measures may be substantial. Even taken together, however, these potential confounders are unlikely to account for more than a fewfold underestimation. Most likely, this reflects the conservative nature of the codon table and of protein structures as well. Although the small genomic footprint that we estimate does not necessarily limit the number of genes included in the mutable set, such nucleotide-level calculation underscores differences between molecular and functional mutation rates. The limited footprint calculated in our broad screen is consistent with the limited mutational spectrum found among somatic mutations selected for loss of p53 in human tumors (Hollstein et al. 1999) or hypoxanthine guanine phosphoribosyltransferase in human primary lymphocytes (Podlutsky et al. 1998). Given some assumptions about the average mutable target size of a gene, the calculations provided here in turn may allow a rough estimate of the number of genes at an earlier stage in a screen than can be done from applying standard calculations based on multiple alleles identified in a specific locus test.
Our results define a rate of 1.04 × 10⁻⁶ mutations per nucleotide, or approximately one substitution per megabase (95% confidence interval, 5.0 × 10⁻⁷–1.9 × 10⁻⁶). The rate should apply to the coisogenic C57BL/6J screens conducted at both the Neuroscience Mutagenesis Facility (http://nmf.jax.org/) and the Mouse Heart, Lung, Blood and Sleep Disorders Center (http://pga.jax.org/) at the Jackson Laboratory, which used the same strain and protocol at the same site and likely extends to other programs that use a similar protocol in this strain, including centers at Baylor College of Medicine (Kile et al. 2003) and Northwestern University (S. Siepka and J. S. Takahashi, personal communication). Other approaches to chemical mutagenesis in the mouse may produce substantially different rates. Brown and colleagues reported five de novo base changes in 9.48 Mb, using denaturing HPLC as a surrogate for sequence in three assayed genes (Coghill et al. 2002) using a single dose protocol in a different mouse strain. Although the limited sample size also limits the statistical significance of the difference in rate, the differences in protocol and ascertainment methods suggest that the nominal rate differences may be real. As Coghill et al. (2002) point out, ascertainment rates using surrogate assays can be difficult to verify and control. The differences in mouse strain and ENU dosing would also be likely to contribute a real difference in rate of mutagenesis. Additionally, the small genomic footprint surveyed in that screen may show bias relative to other sites in the genome compared with the broader footprint reported here. An alternative approach, chemical mutagenesis in embryonic stem (ES) cells, has been reported to produce an approximately twofold higher mutation rate (Chen et al. 2000; Vivian et al. 2002) in four genes surveyed and shows a different spectrum of base substitutions (by manipulating repair pathways), but requires additional steps to produce mice for phenotyping.
Forward genetic screens for disease-related or other biologically interesting phenotypes continue to identify and annotate new genes in mammalian biology. Complementary molecular screens add value both in providing parametric measure for the density and effectiveness of a given screen and in providing direct ascertainment of potential functional variants in genes of interest (Chen et al. 2000; Munroe et al. 2000). The falling marginal cost of DNA sequencing implies that high-throughput sequencing applied to mutagenesis will be a competitive strategy for routinely identifying functional mutations within comparatively large mapping intervals and potentially among uncharacterized G1 DNA segments.
Supplementary Material
Acknowledgement
We thank T. O'Brien and K. Meyers for mutagenesis, L. Dionne for husbandry, J. Weger and R. Kolodner for assistance with instrumentation, and D. W. Smith for computational support. We thank T. O'Brien, J. C. Schimenti, D. R. Beier, A. Wynshaw-Boris, and anonymous reviewers for helpful comments on draft manuscripts. This work was supported in part by grants from the National Institutes of Health to W.N.F. and B.A.H. and a Pew Scholar in the Biomedical Sciences award to B.A.H.
Footnotes
Communicating editor: M. Justice
References
- Beier, D. R., 2000. Sequence-based analysis of mutagenized mice. Mamm. Genome 11: 594–597. [DOI] [PubMed] [Google Scholar]
- Chen, Y., D. Yee, K. Dains, A. Chatterjee, J. Cavalcoli et al., 2000. Genotype-based screen for ENU-induced mutations in mouse embryonic stem cells. Nat. Genet. 24: 314–317. [DOI] [PubMed] [Google Scholar]
- Coghill, E. L., A. Hugill, N. Parkinson, C. Davison, P. Glenister et al., 2002. A gene-driven approach to the identification of ENU mutants in the mouse. Nat. Genet. 30: 255–256. [DOI] [PubMed] [Google Scholar]
- Ewing, B., and P. Green, 1998. Base-calling of automated sequencer traces using phred. II. Error probabilities. Genome Res. 8: 186–194. [PubMed] [Google Scholar]
- Ewing, B., L. Hillier, M. C. Wendl and P. Green, 1998. Base-calling of automated sequencer traces using phred. I. Accuracy assessment. Genome Res. 8: 175–185. [DOI] [PubMed] [Google Scholar]
- Gordon, D., C. Abajian and P. Green, 1998. Consed: a graphical tool for sequence finishing. Genome Res. 8: 195–202. [DOI] [PubMed] [Google Scholar]
- Hollstein, M., M. Hergenhahn, Q. Yang, H. Bartsch, Z.-Q. Wang et al., 1999. New approaches to understanding p53 gene tumor mutation spectra. Mutat. Res. 431: 199–209. [DOI] [PubMed] [Google Scholar]
- Horowitz, N. H., and U. Leupold, 1951. Some recent studies bearing on the one gene one enzyme hypothesis. Cold Spring Harbor Symp. Quant. Biol. 16: 65–74. [DOI] [PubMed] [Google Scholar]
- Justice, M. J., D. A. Carpenter, J. Favor, A. Neuhauser-Klaus, M. Hrabe de Angelis et al., 2000. Effects of ENU dosage on mouse strains. Mamm. Genome 11: 484–488. [DOI] [PubMed] [Google Scholar]
- Kile, B. T., K. E. Hentges, A. T. Clark, H. Nakamura, A. P. Salinger et al., 2003. Functional genetic analysis of mouse chromosome 11. Nature 425: 81–86. [DOI] [PubMed] [Google Scholar]
- Muller, H. J., 1928. The measurement of gene mutation rate in Drosophila, its high variability, and its dependence upon temperature. Genetics 13: 279–357. [DOI] [PMC free article] [PubMed] [Google Scholar]
- Muller, H. J., and A. A. Prokofyeva, 1935. The individual gene in relation to the chromosome and the chromomere. Proc. Natl. Acad. Sci. USA 21: 16–26. [DOI] [PMC free article] [PubMed] [Google Scholar]
- Munroe, R. J., R. A. Bergstrom, Q. Y. Zheng, B. Libby, R. Smith et al., 2000. Mouse mutants from chemically mutagenized embryonic stem cells. Nat. Genet. 24: 318–321. [DOI] [PMC free article] [PubMed] [Google Scholar]
- Nickerson, D. A., V. O. Tobe and S. L. Taylor, 1997. PolyPhred: automating the detection and genotyping of single nucleotide substitutions using fluorescence-based resequencing. Nucleic Acids Res. 25: 2745–2751. [DOI] [PMC free article] [PubMed] [Google Scholar]
- Noveroske, J. K., J. S. Weber and M. J. Justice, 2000. The mutagenic action of N-ethyl-N-nitrosourea in the mouse. Mamm. Genome 11: 478–483. [DOI] [PubMed] [Google Scholar]
- Podlutsky, A., A. M. Osterholm, S. M. Hou, A. Hofmaier and B. Lambert, 1998. Spectrum of point mutations in the coding region of the hypoxanthine-guanine phosphoribosyltransferase (HPRT) gene in human T-lymphocytes in vivo. Carcinogenesis 19: 557–566. [DOI] [PubMed] [Google Scholar]
- Rieder, M. J., S. L. Taylor, V. O. Tobe and D. A. Nickerson, 1998. Automating the identification of DNA variations using quality-based fluorescence re-sequencing: analysis of the human mitochondrial genome. Nucleic Acids Res. 26: 967–973. [DOI] [PMC free article] [PubMed] [Google Scholar]
- Rozen, S., and H. J. Skaletsky, 2000 Primer3 on the WWW for general users and for biologist programmers, pp. 365–386 in Bioinformatics Methods and Protocols: Methods in Molecular Biology, edited by S. Krawetz and S. Misener. Humana Press, Totowa, NJ. [DOI] [PubMed] [Google Scholar]
- Russell, L. B., and C. S. Montgomery, 1982. Supermutagenicity of ethylnitrosourea in the mouse spot test: comparisons with methylnitrosourea and ethylnitrosourethane. Mutat. Res. 92: 193–204. [DOI] [PubMed] [Google Scholar]
- Russell, W. L., 1951. X-ray-induced mutations in mice. Cold Spring Harbor Symp. Quant. Biol. 16: 327–336. [DOI] [PubMed] [Google Scholar]
- Vivian, J. L., Y. Chen, D. Yee, E. Schneider and T. Magnuson, 2002. An allelic series of mutations in Smad2 and Smad4 identified in a genotype-based screen of N-ethyl-N- nitrosourea-mutagenized mouse embryonic stem cells. Proc. Natl. Acad. Sci. USA 99: 15542–15547. [DOI] [PMC free article] [PubMed] [Google Scholar]
- Waterston, R. H., K. Lindblad-Toh, E. Birney, J. Rogers, J. F. Abril et al., 2002. Initial sequencing and comparative analysis of the mouse genome. Nature 420: 520–562. [DOI] [PubMed] [Google Scholar]
- Zeeberg, B., 2002. Shannon information theoretic computation of synonymous codon usage biases in coding regions of human and mouse genomes. Genome Res. 12: 944–955. [DOI] [PMC free article] [PubMed] [Google Scholar]
Associated Data
This section collects any data citations, data availability statements, or supplementary materials included in this article.