

Abstract
We report a study in Drosophila melanogaster of latitudinal clines for 23 SNPs embedded in 13 genes (Pgi, Gapdh1, UGPase, Pglym78, Pglym87, Eno, Men, Gdh, Sod, Pgk, Mdh1, TreS, Treh) representing various metabolic enzymes. Our samples are from 10 populations spanning latitude from southern Florida to northern Vermont. Three new clines with latitude were detected. These are the amino acid polymorphisms in the NAD-dependent glutamate dehydrogenase (Gdh) and trehalase (Treh) genes, and a silent site polymorphism in the UDP-glucose pyrophosphorylase gene (UGPase). The result, when combined with the overall incidence and pattern of reports for six other genes (Adh, Gpdh, Pgm, G6pd, 6Pgd, Hex-C), presents a picture of latitudinal clines in metabolic genes prevalent around the branch point of competing pathways. For six of the seven amino acid polymorphisms showing significant latitudinal clines in North America, the derived allele is the one increasing with latitude, suggesting temperate adaptation. This is consistent with a model of an Afrotropical ancestral species adapting to temperate climates through selection favoring new mutations.
DROSOPHILA melanogaster is an Afrotropical species whose cosmopolitan spread is believed to be a recent event, with parts of the New World and Australia being colonized in only the past couple of hundred years (David and Capy 1988). Coincident with this spread has been a shift from a tropically defined niche to one more temperate, with the incumbent challenges of surviving winters. This move has likely involved life history adaptations that cascade down to metabolic pathways. The action of natural selection in this niche shift is suggested by the presence of latitudinal clines at single gene loci (see Costa et al. 1992) and chromosomal inversions (see Mettler et al. 1977), as well as quantitative traits (see Coyne and Beecham 1987; Gilchrist and Partridge 1999). The clines in allozyme polymorphism, known for decades, may reflect selection on metabolic variation. In D. melanogaster, the most compelling cases for natural selection on metabolic pathways are the reciprocating allozyme clines in northern and southern hemispheres at the Adh, Gpdh, G6pd, and 6Pgd loci (Oakeshott et al. 1982, 1983, 1984). Beyond providing evidence for selection, if examined in the context of physiological or functional differences, the pattern of allelic change can be used to prescribe a mechanism of selection. For example, the observation that there is a latitudinal cline for alcohol tolerance in D. melanogaster, as well as a parallel cline in the Adh Fast allele frequency (Oakeshott et al. 1982), implies that either Adh activity variation per se is responsible for tolerance or the ADH pathway coincidently becomes more active with increased tolerance. This is because increased alcohol tolerance is associated with greater utilization of alcohol as a dietary niche in temperate regions (Mercot et al. 1994).
If a temperate-niche-associated shift in energy allocation has required a multilocus response, then the pattern of geographic variation in functionally associated enzymes may show informative parallel clines. For example, it has been proposed that the latitudinal clines in Adh and Gpdh (Oakeshott et al. 1982) are mechanistically connected through a common NAD/NADH pool (Mckechnie and Geer 1988). It follows that ethanol utilization might cause the geographic covariation of high-activity alleles in these genes (see Cavener and Clegg 1981b). Likewise, the pentose shunt enzymes G6PD and 6PGD possess activity alleles that covary with latitude (Oakeshott et al. 1983). Both enzymes share the NADP/NADPH pool, and this appears to reflect a cline toward reduced pentose shunt flux with increasing latitude (Cavener and Clegg 1981a; Eanes et al. 1990; Labate and Eanes 1992). Our recent studies have also revealed clines in D. melanogaster for alleles at Hex-C, the gene for the fat body form of hexokinase (Duvernell and Eanes 2000), and Pgm (phosphoglucomutase), which possesses complex sets of covarying alleles (Verrelli and Eanes 2001). PGM is considered a trafficking enzyme at the junction leading to glycogen and trehalose pools, both major energy storages in insects. In the fat body, PGM shares, along with HEX-C, PGI, and G6PD, a common metabolic intersection at glucose-6-phosphate. The regulatory effect of glucose-6-phosphate in controlling flux through these competing branches is well established (e.g., Aiston et al. 1999).
A limitation in the early study of clinal variation in D. melanogaster was that it was confined to the few allozyme polymorphisms where alleles segregate at intermediate frequencies and relied on amino acid polymorphisms involving charge changes. Furthermore, the histochemical methodology used to visualize many allozymes is associated with either NAD or NADP cofactors or enzymes coupled to the cofactor utilizing enzymes (e.g., G6PD). This has biased studies toward enzymes at the top of the glycolytic pathway and toward those associated with cofactors. Given these limitations, two questions emerge: Exactly how common are clines across gene loci in general, and in the case of metabolic genes, do clinal patterns of variation relate to pathway position in the regulation of metabolic flux?
This study systematically extends the study of geographic pattern to 13 new genes. Ten are genes encoding enzymes representing the central glycolytic corridor and its important branches (Pgi, Gapdh1, Pgk, Eno, Pglym78, Pglym87, Mdh1, UGPase, Treh, TreS). Two other genes (Men and Gdh) encode key metabolic enzymes branching from the Krebs cycle. The thirteenth gene encodes cytosolic superoxide dismutase (Sod), a gene that has been shown to possess an allele under recent directional selection (Hudson et al. 1994, 1997). In the study we attempt to identify and screen amino acid replacement polymorphisms, but for several loci we also screened synonymous polymorphisms and used these variable sites to define common haplotypes. This is because numerous studies have demonstrated that recent adaptive selection can be detected via linkage disequilibrium among sites under selection and neighboring polymorphism (e.g., Sabeti et al. 2002; Duvernell et al. 2003).
MATERIALS AND METHODS
More than 1500 isofemale lines (established in the field) of D. melanogaster were collected from 10 populations in the fall of 1997. Populations are abbreviated as HFL (Homestead, FL; latitude 25° 2′), MFL (Merrit Island, FL; 28° 3′), JFL (Jacksonville, FL; 30° 2′), SC (Eutawville, SC; 33° 2′), NC (Smithfield, NC; 35° 3′), VA (Richmond, VA; 37° 3′), MD (Churchville, MD; 39° 3′), CT (Middlefield, CT; 41° 3′), MA (Concord, MA; 42° 0′), and VT (Whiting, VT 43° 6′). For each population sample, 55 second and third nonlethal chromosomes were genetically extracted using the SM5 and TM6 balancer chromosomes (Duvernell and Eanes 2000).
Thirteen genes were probed using 23 single nucleotide polymorphisms (SNPs). Figure 1 shows the chromosomal positions of the genes discussed in this study. From published sources and the Drosophila genome sequence (Adams et al. 2000), primary sequences for Mdh-1 (CG5362), UGPase (CG4347), Pgk (Roselli-Rehfuss et al. 1992), Eno (Bishop and Corces 1990), Pglym78, and Pglym87 (Currie and Sullivan 1994) were used to design PCR primers. For each gene, 10–33 nucleotide sequences were determined to identify informative replacement and synonymous polymorphisms. Men was isolated in 1998 using the PCR-cDNA enrichment procedure of Verrelli and Eanes (2000). Pgi and Sod sequences sets were available from John F. McDonald (University of Delaware) and published sources (Hudson et al. 1994), respectively. These three genes have now all been confirmed in the full Drosophila genome sequence (http://www.fruitfly.org). In most cases SNP sites were screened using restriction endonucleases that cut (or failed to cut) polymorphisms. In a few cases SNP sites were screened by manual sequencing reactions using only a single discriminatory dideoxynucleotide reaction (see Verrelli and Eanes 2001). Positions of SNP sites are referenced from the first base of the start codon unless otherwise noted. The ability to detect polymorphisms varied greatly between loci, but on average about two to three sites could be screened per locus. Nucleotide positions possessing SNPs at intermediate frequencies and those that delineated the haplotype structure at a given locus were favored in the analysis. Allozyme clines for Adh, Gpdh, and Tpi loci were also resurveyed for our samples using single flies from isofemale lines.
Figure 1.—

The chromosomal positions of the genes examined in the study.
The number of SNPs varied per locus, depending on the availability of single-site polymorphisms that could be assayed by restriction endonucleases. Each site was analyzed independently unless there was strong linkage disequilibrium in our samples, in which case the derived haplotype frequency was used. Wright's standardized variances (FST) were computed on both single-site and haplotype data using the estimator from Weir and Hill (2002), which removes the sampling variance.
Several genes assayed reside within or near cosmopolitan inversions in the D. melanogaster genome (Figure 1). Because inversion polymorphisms often exhibit strong latitudinal clines (see Mettler et al. 1977), we screened for three inversions in our lines to determine whether inversion latitudinal clines may account for geographic variation at linked enzyme polymorphisms. We used a PCR-based screen to designate the inversion status of each chromosome line. For In(2L)t we used the PCR design described in Andolfatto et al. (1999). For In(3L)Payne we already possessed the line designations determined by Verrelli and Eanes (2001) that originally used standard and inversion-specific primers designed from the described breakpoints of Wesley and Eanes (1994). From the sequence of the In(3R)Payne breakpoints (L. M. Matzkin, T. J. S. Merritt, C.-T. Zhu and W. F. Eanes, unpublished results) a set of three PCR primers was designed to screen for the inversion: 100463+ (ACTAGCGTTGAGAATGCAAAGTC CAAC), 100785− (AAATGCTGCACGTAATTGTAAGTTATGAGC), and Tok 24813− (TTTGTTTGTGTCTGTGTGAGCTGC). Given the duplication associated with inversion In(3R)P (L. M. Matzkin, T. J. S. Merritt, C.-T. Zhu and W. F. Eanes, unpublished results), primer pair 100463+/100785− amplifies a 322-bp fragment in both standard and inverted chromosomes, while primer pair 100785−/Tok 24813− amplifies a 663-bp fragment only from inverted chromosomes. The accuracy of this method was tested by screening isochromosomal lines previously karyotyped using salivary gland preparations.
Our test for the presence of a cline was the statistical fit of a linear regression of arcsine-transformed allele or haplotype frequencies against latitude. To remove the effect of simple association with inversions (if strong linkage disequilibrium within samples was observed), tests were carried out using the frequencies of SNPs within the standard arrangements only. Partial correlations between SNP frequencies were also computed, holding latitude constant as a covariate. A principal coordinates analysis (PCA; Gower 1966) was carried out on the 10 × 25 matrix of localities-by-SNPs after arcsine transformation. Computations were carried out using the Matlab 5.3 student version.
RESULTS
Inversion polymorphisms:
We screened all lines for the In(2L)t, In(3L)P, and In(3R)P inversions using PCR-based diagnostic amplifications designed from the sequences of breakpoints (see materials and methods). In(2R)NS was not screened because its breakpoints have yet to be determined. In(2L)t is not statistically clinal in our sample, but Figure 2A shows a summary of all 18 published data (Mettler et al. 1977; Krimbas and Powell 1992) and a cline is highly significant. Our population samples exhibited a significant latitudinal cline for In(3L)P (Figure 2B). In(3R)P shows the greatest geographic variation (FST = 0.33), reaching 69% in the MFL sample, while absent in the three northern samples. When our data are pooled with published data on this inversion (Krimbas and Powell 1992), there is a statistically significant cline (Figure 2C).
Figure 2.—
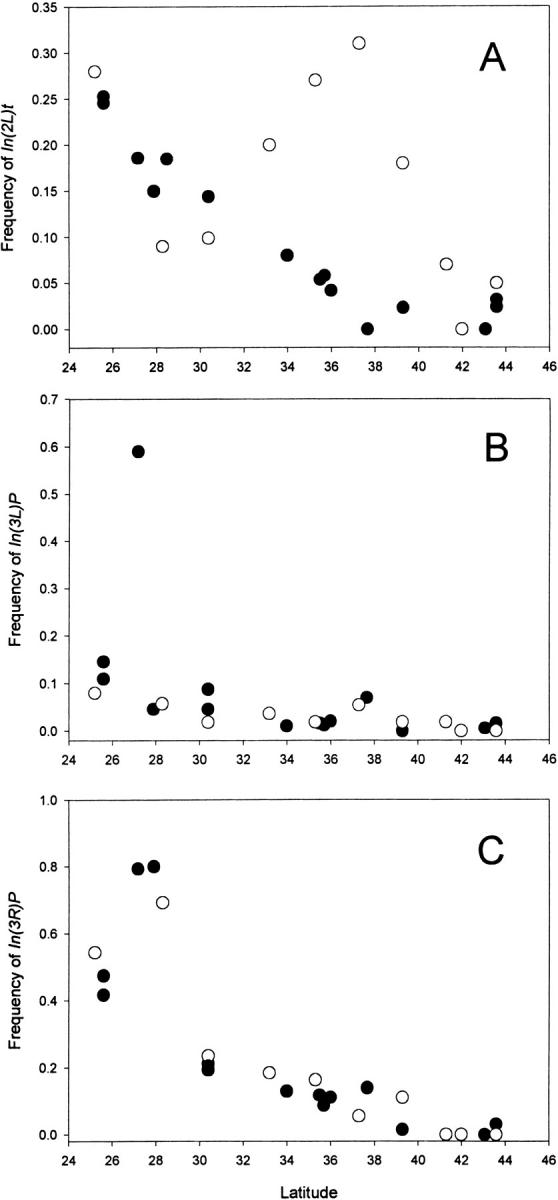
The latitudinal clines for the three major cosmopolitan inversions, In(2L)t, In(3L)Payne, and In(3R)Payne. The open circles indicate the 10 populations from this study and the solid circles indicate published values (Mettler et al. 1977; Krimbas and Powell 1992).
SNPs:
For each gene, we briefly report the number of lines sequenced and the SNPs screened. The genes are listed in alphabetical order.
Eno:
Sequences for 24 copies of the enolase gene were determined. Two rare replacement polymorphisms were discovered, one absent from North American samples (K7R) and the other observed only as a singleton (D313A). We screened the silent site polymorphisms at nucleotides 30 and 222 using restriction enzymes BglII and PspoMI, respectively. There is weak linkage disequilibrium between these SNPs (average R = 0.31), and site 30 is also in weak linkage disequilibrium with In(2L)t in three of the populations. Neither SNP showed a statistically significant cline.
Gapdh1:
We sequenced 14 copies for each of the two glyceraldehyde-3-phosphate dehydrogenase (Gapdh) genes in D. melanogaster (Gapdh1 and Gapdh2). Seven SNPs were found in Gapdh1 and a replacement polymorphism segregating for Leu, Phe, and Val was observed at nucleotide 850 (L284F/V). Sites 825 and 850 were screened using a single nucleotide reaction for C, but as a result we were unable to subdivide the T and G polymorphism at 850. There was only weak linkage disequilibrium between these sites. The frequencies of neither SNP were significantly clinal with latitude. Only two silent polymorphisms were observed in Gapdh2 and neither could be screened by restriction digestion.
Gdh:
The sequence analysis of 22 lines for NAD-dependent glutamate dehydrogenase discovered two common amino acid polymorphisms (Y329F and N385D) and one silent polymorphism that could be screened by restriction enzyme digest. The SNPs at nucleotides 989, 1062, and 1156 could be individually detected using the restriction enzymes RsaI and BsiEI. Latitudinal clines were observed for both amino acid polymorphisms and their joint haplotypes. The two amino acid polymorphisms are in significant linkage phase disequilibrium (average R = 0.30), and the gene is inside the cosmopolitan inversion In(3R)P (Gdh is at 95C12 and distal breakpoint is at 96A18). The ancestral amino acid haplotype of Tyr329 and Asn385 is fixed in all of the In(3R)P-bearing chromosomes in our sample. The correction for association with the inversion was made by exploring the frequency of each polymorphic site in the standard arrangement. This revealed a significant cline in the N385D polymorphism (Figure 3). The double-derived amino acid haplotype (Phe329 and Asp385) shows a significant cline. This haplotype is rare in southern population samples while reaching frequencies of 23 and 28% in the Massachusetts and Vermont samples, respectively.
Figure 3.—

The latitudinal cline for the Y329F and N385D amino acid polymorphisms in the Gdh gene. The open circles indicate the observed frequencies of the N385D allele [combined St and In(3R)P]. The solid circles indicate the frequencies in the samples of the standard arrangements. The triangles indicate the frequencies of the double-derived amino acid haplotype in the standard arrangement.
Mdh-1:
This is the gene for cytosolic NAD-dependent malate dehydrogenase. Our sample of 14 Mdh1 sequences failed to find any amino acid polymorphism. We examined silent site SNPs at nucleotides 552 and 663 using single base sequencing reactions. These two SNPs are in significant linkage disequilibrium (average R = 0.813). There was no significant cline in the most frequent haplotype (TT).
Men:
The sequence analysis of 33 lines revealed a single widespread non-charge-changing amino acid polymorphism (G113A). Screening of SNP-revealing restriction site variation (AccI, BstVI) at nucleotides 338 (MenG113A), 876, and 1323 showed no significant geographic variation for any SNP and no clinal variation in the haplotypes associated jointly with all three SNPs.
Pgi:
There are several replacement polymorphisms in the sample of 17 sequences of the phosphoglucose isomerase gene in the GenBank database. One is a widespread amino acid polymorphism (V329I) at nucleotide 985. It was screened by single base sequencing reaction, and there is neither significant geographic variation nor a cline with latitude.
Pgk:
A singleton amino acid change at nucleotide 1284 (S387A) was observed in 28 sequences of phosphoglycerate kinase. Synonymous polymorphisms at nucleotides 397 and 703 were screened using restriction enzymes MspI and DdeI, respectively. There is strong linkage disequilibrium across the Pgk gene and these sites are nearly diagnostic for two major multi-site haplotypes. These two sites are in nearly complete linkage disequilibrium (average R = 0.95) in all samples, and we treat them as two alleles. There is weak disequilibrium between the haplotypes and the In(2L)t inversion, but there was no significant cline in either haplotype before or after consideration (looking at standard chromosomes only) of linkage with the In(2L)t inversion.
Pglym78:
We sequenced 16 alleles of the Pglym78 gene for phosphoglycerate mutase. Two common amino acid polymorphisms (G42R at nucleotide position 127, E48D at nucleotide position 144) and one silent SNP (nucleotide position 256) were discovered. We surveyed the G42R change using restriction enzyme HinPI and the silent SNP using BstNI. The two SNPs show no significant linkage disequilibrium. While the replacement polymorphism Pglym78G42R showed relatively high geographic variation (FST = 0.059), neither the SNP site nor the joint haplotype was significantly clinal with latitude.
Pglym87:
This phosphoglycerate mutase locus was considered a possible pseudogene by Currie and Sullivan (1994). Analysis of 16 copies indicates retention of considerable sequence constraint (polymorphisms were largely in synonymous positions) and 31 ESTs have been described from testis. Three nucleotide sites were identified for SNP screening (sites 226 and 227 with BsiHKAI and 621 with BspHI). The replacement polymorphism (a double-charge change, E74K) was found only in our Vermont sample. For site 621 there is no significant linkage disequilibrium with In(3R)P. This SNP showed no significant geographic variation and was not clinal with latitude.
Sod:
The study of the SodS and SodF alleles was carried out by allozyme screen using isofemale lines, and therefore we were unable to look at the association of Sod with the In(3L)P. There was no statistically significant cline.
Treh:
Using SalI we screened the single replacement site polymorphism (nucleotide 122,V41A) observed in our sequenced sample of 22 trehalase gene copies. There was a significant cline in this replacement polymorphism.
TreS:
Our sequencing of 12 copies of the trehalose-6-phosphate synthetase gene (CG4104) found no replacement polymorphisms and 80 silent polymorphisms. We screened SNPs at nucleotides 303 and 2409 using restriction enzymes HincII and BglI, respectively. No significant cline was observed at either site.
UGPase:
We observed 36 silent polymorphisms in 10 copies of the UGP-glucose pyrophosphorylase gene (CG4347). Silent nucleotide positions 45 and 147 were screened using restriction enzymes ApaLI and HaeIII. The sharp increase in the SNP at position 45 in northern populations is associated with a statistically significant cline.
Table 1 shows a summary of results. It lists SNPs, FST estimates, slopes of the linear regression of the arcsine-transformed SNP frequency against latitude, and the associated probability of the null hypothesis that the regression slope is zero. Of the 13 new genes in the current study, three (Gdh, UGPase, and Treh) show evidence of spatial variation colinear with latitude, and Gdh remains statistically significant after a Bonferroni correction (Rice 1989). Table 2 lists the 17 statistically significant between-gene partial correlations (holding latitude constant) of the 378 comparisons. The significant partial correlations between SNP sites within loci are not listed.
TABLE 1.
List of loci studied, SNPs,FST-values, slopes of linear regression against latitude, and associated probabilities
| Locus | Allele | Method | FST | βlat | P |
|---|---|---|---|---|---|
| New genes | |||||
| Gapdh1 | 825T | SNP | 0.074 | 0.014 | 0.170 |
| 850T | SNP | 0.051 | 0.008 | 0.230 | |
| Men | 338G (G/A) | SNP | 0.004 | 0.004 | 0.320 |
| GCC | SNP | 0.009 | 0.004 | 0.340 | |
| Gdh | 986T (Y/F) | SNP | 0.074 | 0.009 | 0.070 |
| 1156G (N/D) | SNP | 0.087 | 0.019 | 0.007 | |
| TG | SNP | 0.019 | 0.026 | 0.003 | |
| Pgk | 397T, 703T | SNP | 0.004 | −0.004 | 0.312 |
| Eno | 30A | SNP | 0.0508 | 0.013 | 0.052 |
| 222A | SNP | 0.0429 | 0.010 | 0.150 | |
| Pglym87 | 621T | SNP | 0.074 | 0.003 | 0.510 |
| Pglym78 | 622C (G/R) | SNP | 0.047 | 0.010 | 0.210 |
| 750T | SNP | 0.019 | −0.005 | 0.330 | |
| Mdh-1 | 552T, 633T | SNP | 0.032 | 0.005 | 0.485 |
| UGPase | 47T | SNP | 0.151 | 0.027 | 0.013 |
| 147T | SNP | 0.014 | −0.004 | 0.550 | |
| Treh | 122T (V/A) | SNP | 0.022 | 0.011 | 0.027 |
| TreS | 303C | SNP | 0.054 | −0.008 | 0.204 |
| 2407A | SNP | −0.001 | 0.003 | 0.552 | |
| Pgi | 985A (V/I) | SNP | −0.005 | 0.002 | 0.453 |
| Sod | Sod-Slow | Allozyme | 0.032 | 0.007 | 0.210 |
| Tpi | Tpi-Slow | Allozyme | 0.031 | 0.008 | 0.088 |
| Published genes | |||||
| Pgma | Fast | Allozyme | 0.012 | −0.011 | 0.014 |
| Slow | Allozyme | 0.005 | 0.006 | 0.020 | |
| Hex-Cb | HexC-Fast | Allozyme | 0.011 | 0.008 | 0.021 |
| Hext1b | 728A (Y/F) | SNP | −0.000 | 0.003 | 0.380 |
| Hext2b | AAA (S/N, L/I) | SNP | 0.071 | 0.020 | 0.004 |
| Adhc | Adh-Fast | Allozyme | 0.060 | 0.017 | 0.001 |
| Gpdhc | Gpdh-Slow | Allozyme | 0.074 | 0.023 | 0.023 |
| Inversions | |||||
| In(2L)t | 0.070 | −0.016 | 0.009 | ||
| In(3R)P | 0.331 | −0.049 | 0.000 | ||
| In(3L)P | 0.004 | −0.012 | 0.002 | ||
TABLE 2.
Significant partial correlations
| Pair | rij.lat | P |
|---|---|---|
| GpdhS-SodS | 0.880 | 0.002 |
| PgmF-UGPase47T | −0.852 | 0.005 |
| AdhF-Gapdh1825T | 0.840 | 0.005 |
| Gapdh1850T-UGPase147T | −0.804 | 0.012 |
| Gapdh1850T-UGPase475T | −0.802 | 0.012 |
| Gdh986T-Gapdh1850T | −0.781 | 0.013 |
| AdhF-UGPase47T | 0.778 | 0.013 |
| Treh-TreS303C | 0.770 | 0.014 |
| Gdh1156G-Eno222A | −0.768 | 0.015 |
| Pglym87-UGPase47T | 0.738 | 0.025 |
| GpdhS-Pglym87 | 0.713 | 0.025 |
| GpdhS-UGPase147T | 0.697 | 0.029 |
| Tre-Pglym78750T | 0.690 | 0.031 |
| SodS-UGPase47T | 0.688 | 0.034 |
| PgmF-GpdhS | −0.682 | 0.032 |
| PgmF-SodS | −0.673 | 0.042 |
| PgmF-Pglym87 | −0.671 | 0.043 |
DISCUSSION
Over the past three decades, one focus of population genetics has been detecting the incidence and nature of adaptive change in genomes. In principle, this can be addressed using either bottom-up or top-down approaches. The more traditional bottom-up approach focuses on single genes connected by functional context to a phenotype of interest, such as metabolism (Eanes 1999; Watt and Dean 2000). In this case, selection starts with the phenotype and genes per se. With the increasing availability of high-density markers, such as microsatellites, the top-down approach has recently emerged as a possibility. This approach focuses on finding genes under selection (irrespective of function) by using genome-wide screens designed to detect footprints of recent selection, such as chromosome regions swept clean of molecular variation (Harr et al. 2002; Glinka et al. 2003; Kauer et al. 2003). This study emphasizes the bottom-up approach.
It is apparent from our study that steep clines for replacement polymorphisms, such as that seen at Adh, are not pervasive (Berry and Kreitman 1993). This brings added significance to those sites showing clines, which can be further addressed on a locus-by-locus basis. Prior to the start of this study (in 1997) geographic clines in D. melanogaster had been reported for allozyme polymorphisms at the Adh, Gpdh, Est6, G6pdh, 6Pgd, Odh, and Tpi loci. Our studies of the Hex-C, Hext-1, and Hex-t2 loci (Duvernell and Eanes 2000), Pgm (Verrelli and Eanes 2001), and mth (Schmidt et al. 2000), along with the 13 genes reported here, reveal seven clines among the 17 genes. From the standpoint of somatic metabolic selection, Hext-1, Hex-t2, and Pglym87 appear to have only testis-specific expression. SNPs in genes of enzymes in the main glycolytic corridor (Pgi, Pgk, Eno, and Pglym78) do not show clinal variation, while variation in genes at the upper (Hex-C, Pgm, and G6pd) and lower branch points (Gpdh) show clines.
Every study of a potential cline is first predicated on the power to detect a statistically significant relationship, as well as on other assumptions. If we sampled more populations, it would increase our power to detect more subtle clines. When considered gene by gene, there are three cases of significant latitudinal clines worth further study. However, using an adjusted study-wide type-I error rate or Bonferroni correction (see Rice 1989), we detected only one more significant cline (that of Gdh). Adding more genes makes each test more conservative with respect to type-II error and we increase the probability of inferring the absence of a cline when one is present. However, applying an adjusted type-I error depends on the extent to which we address an overall hypothesis about the ubiquity of clines or the extent to which we are interested in identifying individual genes as targets of selection and future study. Much of our interest lies in this latter goal.
Our criteria for judging a latitudinal pattern is the test of a statistically significant linear fit between transformed allele (or haplotype) frequency and latitude as a positional variate using the 10 population-frequency estimates. The biological realism of this restricted model is tenuous. We assume that latitude operates as a proxy for spatially changing factors, but this assertion ignores the problem that the spatial pattern of selection may not be linear with latitude. We also cannot draw a direct relationship between the slope of a cline and the strength of selection. The absence of a cline also does not preclude strong selection. Nevertheless, it is reasonable to propose that steeper clines generally reflect, on the average, greater variation in fitness for a given genotype across this range of environments.
To further explore the potential response of many genes to a common nonlinear environmental change covarying with latitude, we examined the partial correlations between SNPs among genes with latitude held constant. The multiple-test statistics of this exploration with many nonindependent correlations (total of 378) are clearly complex, but the presence of some tightly covarying frequencies, after latitude was removed, is worth noting even though some could be type-I errors. The two largest correlations are between GpdhS and SodS (r = 0.88, P < 0.002) and between the functionally adjacent Pgm and UGPase (r = −0.85, P < 0.005) genes. The next highest partial correlation is between Adh and Gapdh1 (r = 0.84, P < 0.005). Both enzymes are NAD/NADH dependent. Under gluconeogenesis associated with an alcohol diet, the NADH generated at the ADH step might balance the redox balance associated with NADH consumption by GAPDH. Treh and TreS, both in the trehalose pathway, also show a significant partial correlation (r = 0.77, P < 0.014). Several of the significant partial correlations in Table 2 involve genes for which there was no significant linear association with latitude (Eno, Pglym87, Pglym87, TreS, and Sod). Some genes such as Pgi and Men showed no significant correlation with latitude or other genes. On the one hand, we might expect some partial correlations because populations are expected to show greater genetic similarity with the inverse of distance simply because of gene flow. On the other hand, intergene correlations might indicate common selection responses among genes in pathways interconnected by products, substrates, cofactors, and allosteric effectors. It should be noted that seven significant partial correlations involve UGPase47A, which probably reflects a fundamental clinal pattern. We used a principal coordinate analysis to summarize any overall pattern of change among the sample populations for all 27 SNPs in Table 1 (inversions excluded). Sample scores for the first principal coordinate are highly significantly correlated with latitude (Figure 4), and UGPase47A has the largest contribution to this coordinate. The sample PCA scores show a pattern of a tight linear monotonic change across the most southern samples to the mid-Atlantic with a notable shift in the most northern samples from Connecticut, Massachusetts, and Vermont.
Figure 4.—

Plot of the 10 population scores for the first principal coordinate against latitude. The analysis includes all 27 SNPs in Table 1 (inversions excluded). Sample scores for the first principal coordinate are highly significantly correlated with latitude (r = 0.89, P < 0.0006).
The inference of natural selection from the observed clines depends on the assumed nature of D. melanogaster population structure across this region. The details of D. melanogaster population structure are not known, but we can discuss extreme models. The first possibility is that local populations above a certain latitude are reestablished de novo from long-distance migrants every year. Alternatively, “summer” populations in the northern latitudes are reestablished from local remnants surviving through the winter. There is evidence that remnants of populations survive the winter in temperate climates. Coyne and Milstead (1987) studied populations that they had saturated with visibly marked flies, and their work suggested successful overwintering of adults in Maryland populations. Ives (1945) showed in temperate populations in New England that lethal allelism was higher between years within populations than between populations in the same year. This implicates local overwintering and between-year retention of local lethals and recessive visible mutations. In the orchards of eastern Pennsylvania, adult females are found (albeit sparsely) as early as March and appear to be winter survivors (P. Schmidt, personal communication). Therefore, there is at least anecdotal evidence that populations overwinter in temperate climates like the northeastern United States.
The cline in glutamate dehydrogenase should be singled out as a third cline associated with alcohol metabolism and the NAD/NADH charge pool. It also shows a significant partial correlation with Gapdh1, another NADH-utilizing step. Figure 3 shows that the Gdh haplotype with the derived mutations Y329F and N385D exhibits a significant increase in frequency from the southernmost samples, where it is rare, to 26% in the northernmost sample (Vermont). Studies of ADH function using NMR (Freriksen et al. 1994) have implied increased flux to glutamate under ethanol metabolism and glutamate is the key amino-acid-bridging carbohydrate in much of amino acid metabolism (Brosnan 2000). The two sites are separated by 167 bp or 56 residues, but with folding in the three-dimensional structure both residues are found in or near the conserved outer lobe in the domain of NAD binding (see Cho et al. 1998; Peterson and Smith 1999). These residues are not strictly conserved across taxa, but are embedded in highly conserved domains.
Finally, it is apparent that the molecular adaptation of D. melanogaster to temperate climates largely involves increases in the frequencies of derived amino acid mutations. There are now eight metabolic genes that possess statistically significant amino acid replacement clines (G6pd, Adh, Gpdh, Pgm, Hex-C, 6Pgd, Gdh, and Treh). Using D. simulans as an outgroup, we can estimate the ancestral and derived states for all of these polymorphisms. The pattern of clinal variation is highly complex for Pgm (Verrelli and Eanes 2001); however, for the other seven polymorphisms, six (6Pgd is the exception) show the nonancestral allele increasing with temperate climate (increasing latitude). Tpi does not show a significant cline in our 10 samples, but has been reported to be significantly clinal in Australia (Oakeshott et al. 1984) and bears the same direction in slope in our sample. This is possibly a seventh example of the derived allele frequency (see Hasson et al. 1998), increasing with latitude. This overall observation supports the proposition that many clinal amino acid polymorphisms are adaptive responses by D. melanogaster to the environments of the temperate regions that it has colonized.
Acknowledgments
We thank Andrew Berry for his help with potential collection sites in northern Atlantic localities and John H. McDonald for discussion about his unpublished data sets. We are grateful to Dan Dykhuizen, Dusty Brisson, and Thomas Merritt for reading and commenting on versions of the manuscript. Various undergraduates contributed to data collection, including Daniel McDonald, Wai Yin Lee, Claudia Cebada Mora, and Crystal Sachdeva. This study was supported by U.S. Public Health Service grant GM-45247 to W.F.E. This is contribution number 1121 from the Graduate Program in Ecology and Evolution, State University of New York, Stony Brook, New York.
References
- Adams, M. D., S. E. Celniker, R. A. Holt, C. A. Evans, J. D. Gocayne et al., 2000. The genome sequence of Drosophila melanogaster. Science 287: 2185–2195. [DOI] [PubMed] [Google Scholar]
- Aiston, S., K. Y. Trinh, A. J. Lange, C. B. Newgard and L. Agius, 1999. Glucose-6-phosphatase overexpression lowers glucose 6-phosphate and inhibits glycogen synthesis and glycolysis in hepatocytes without affecting glucokinase translocation. Evidence against feedback inhibition of glucokinase. J. Biol. Chem. 274: 24559–24566. [DOI] [PubMed] [Google Scholar]
- Andolfatto, P., J. D. Wall and M. Kreitman, 1999. Unusual haplotype structure at the proximal breakpoint of In(2L)t in a natural population of Drosophila melanogaster. Genetics 153: 1297–1311. [DOI] [PMC free article] [PubMed] [Google Scholar]
- Berry, A., and M. Kreitman, 1993. Molecular analysis of an allozyme cline: alcohol dehydrogenase in Drosophila melanogaster on the east coast of North America. Genetics 134: 869–893. [DOI] [PMC free article] [PubMed] [Google Scholar]
- Bishop, J. G., and V. G. Corces, 1990. The nucleotide sequence of a Drosophila melanogaster enolase gene. Nucleic Acids Res. 18: 191. [DOI] [PMC free article] [PubMed] [Google Scholar]
- Brosnan, J. T., 2000. Glutamate, at the interface between amino acid and carbohydrate metabolism. J. Nutr. 130: 988S–990S. [DOI] [PubMed] [Google Scholar]
- Cavener, D. R., and M. T. Clegg, 1981. a Evidence for biochemical and physiological differences between genotypes in Drosophila melanogaster. Proc. Natl. Acad. Sci. USA 78: 4444–4447. [DOI] [PMC free article] [PubMed] [Google Scholar]
- Cavener, D. R., and M. T. Clegg, 1981. b Multigenic response to ethanol in Drosophila melanogaster. Evolution 35: 1–10. [DOI] [PubMed] [Google Scholar]
- Cho, S. W., H. Y. Yoon, J. Y. Ahn, S. Y. Choi and T. U. Kim, 1998. Identification of an NAD(+) binding site of brain glutamate dehydrogenase isoproteins by photoaffinity labeling. J. Biol. Chem. 273: 31125–31130. [DOI] [PubMed] [Google Scholar]
- Costa, R., A. A. Peixoto, G. Barbujani and C. P. Kyriacou, 1992. A latitudinal cline in a Drosophila clock gene. Proc. R. Soc. Lond. B Biol. Sci. 250: 43–49. [DOI] [PubMed] [Google Scholar]
- Coyne, J. A., and E. Beecham, 1987. Heritability of two morphological characters within and among natural populations of Drosophila melanogaster. Genetics 117: 727–737. [DOI] [PMC free article] [PubMed] [Google Scholar]
- Coyne, J. A., and B. Milstead, 1987. Long-distance migration of Drosophila. 3. Dispersal of Drosophila melanogaster alleles from a Maryland orchard. Am. Nat. 130: 70–82. [Google Scholar]
- Currie, P. D., and D. T. Sullivan, 1994. Structure, expression and duplication of genes which encode phosphoglyceromutase of Drosophila melanogaster. Genetics 138: 353–363. [PMC free article] [PubMed] [Google Scholar]
- David, J. R., and P. Capy, 1988. Genetic variation of Drosophila melanogaster natural populations. Trends Genet. 4: 106–111. [DOI] [PubMed] [Google Scholar]
- Duvernell, D. D., and W. F. Eanes, 2000. Contrasting molecular population genetics of four hexokinases in Drosophila melanogaster, D. simulans and D. yakuba. Genetics 156: 1191–1201. [DOI] [PMC free article] [PubMed] [Google Scholar]
- Duvernell, D. D., P. S. Schmidt and W. F. Eanes, 2003. Clines and adaptive evolution in the methuselah gene region in Drosophila melanogaster. Mol. Ecol. 12: 1277–1285. [DOI] [PubMed] [Google Scholar]
- Eanes, W. F., 1999. Analysis of selection on enzyme polymorphisms. Annu. Rev. Ecol. Syst. 30: 301–326. [Google Scholar]
- Eanes, W. F., L. Katona and M. Longtine, 1990. Comparison of in vitro and in vivo activities associated with the G6PD allozyme polymorphism in Drosophila melanogaster. Genetics 125: 845–853. [DOI] [PMC free article] [PubMed] [Google Scholar]
- Freriksen, A., B. L. A. de Ruiter, W. Scharloo and P. W. H. Heinstra, 1994. Drosophila alcohol dehydrogenase polymorphism and carbon-13 fluxes: opportunities for epistasis and natural selection. Genetics 137: 1071–1078. [DOI] [PMC free article] [PubMed] [Google Scholar]
- Gilchrist, A. S., and L. Partridge, 1999. A comparison of the genetic basis of wing size divergence in three parallel body size clines of Drosophila melanogaster. Genetics 153: 1775–1787. [DOI] [PMC free article] [PubMed] [Google Scholar]
- Glinka, S., L. Ometto, S. Mousset, W. Stephan and D. De Lorenzo, 2003. Demography and natural selection have shaped genetic variation in Drosophila melanogaster: a multi-locus approach. Genetics 165: 1269–1278. [DOI] [PMC free article] [PubMed] [Google Scholar]
- Gower, J. C., 1966. Some distance properties of latent root and vector methods used in multivariate analysis. Biometrika 53: 325–338. [Google Scholar]
- Harr, B., M. Kauer and C. Schlötterer, 2002. Hitchhiking mapping: a population-based fine-mapping strategy for adaptive mutations in Drosophila melanogaster. Proc. Natl. Acad. Sci. USA 99: 12949–12954. [DOI] [PMC free article] [PubMed] [Google Scholar]
- Hasson, E., I. N. Wang, L. W. Zeng, M. Kreitman and W. F. Eanes, 1998. Nucleotide variation in the triosephosphate isomerase (Tpi) locus of Drosophila melanogaster and Drosophila simulans. Mol. Biol. Evol. 15: 756–769. [DOI] [PubMed] [Google Scholar]
- Hudson, R. R., K. Bailey, D. Skarecky, J. Kwiatowski and F. J. Ayala, 1994. Evidence for positive selection in the superoxide dismutase (Sod) region of Drosophila melanogaster. Genetics 136: 1329–1340. [DOI] [PMC free article] [PubMed] [Google Scholar]
- Hudson, R. R., A. G. Saez and F. J. Ayala, 1997. DNA variation at the Sod locus of Drosophila melanogaster: an unfolding story of natural selection. Proc. Natl. Acad. Sci. USA 94: 7725–7729. [DOI] [PMC free article] [PubMed] [Google Scholar]
- Ives, P. T., 1945. Genetic structure of American populations of Drosophila melanogaster. Genetics 30: 167–196. [DOI] [PMC free article] [PubMed] [Google Scholar]
- Kauer, M. O., D. Dieringer and C. Schlötterer, 2003. A microsatellite variability screen for positive selection associated with the “out of Africa” habitat expansion of Drosophila melanogaster. Genetics 165: 1137–1148. [DOI] [PMC free article] [PubMed] [Google Scholar]
- Krimbas, C. B., and J. R. Powell, 1992 Drosophila Inversion Polymorphism. CRC Press, Ann Arbor, MI.
- Labate, J., and W. F. Eanes, 1992. Direct measurement of in vivo flux differences between electrophoretic variants of G6PD in Drosophila melanogaster. Genetics 132: 783–787. [DOI] [PMC free article] [PubMed] [Google Scholar]
- McKechnie, S. W., and B. W. Geer, 1988. The epistasis of Adh and Gpdh allozymes and variation in the ethanol tolerance of Drosophila melanogaster larvae. Genet. Res. 52: 179–184. [DOI] [PubMed] [Google Scholar]
- Mercot, H., D. Defaye, P. Capy, E. Pla and J. R. David, 1994. Alcohol tolerance, ADH activity, and ecological niche of Drosophila species. Evolution 48: 746–757. [DOI] [PMC free article] [PubMed] [Google Scholar]
- Mettler, L. E., R. A. Voelker and T. Mukai, 1977. Inversion clines in populations of Drosophila melanogaster. Genetics 87: 169–176. [DOI] [PMC free article] [PubMed] [Google Scholar]
- Oakeshott, J. G., J. B. Gibson, P. R. Anderson, W. R. Knibb and G. K. Chambers, 1982. Alcohol dehydrogenase and glycerol-3-phosphate dehydrogenase clines in Drosophila melanogaster on different continents. Evolution 36: 86–96. [DOI] [PubMed] [Google Scholar]
- Oakeshott, J. G., G. K. Chambers, J. B. Gibson, W. F. Eanes and D. A. Willcocks, 1983. Geographic variation in G6pd and Pgd allele frequencies in Drosophila melanogaster. Heredity 50: 67–72. [DOI] [PubMed] [Google Scholar]
- Oakeshott, J. G., S. W. McKechnie and G. K. Chambers, 1984. Population genetics of the metabolically related Adh, Gpdh, and Tpi polymorphisms in Drosophila melanogaster. I. Geographic variation in Gpdh and Tpi allele frequencies in different continents. Genetica 63: 21–29. [Google Scholar]
- Peterson, P. E., and T. J. Smith, 1999. The structure of bovine glutamate dehydrogenase provides insights into the mechanism of allostery. Structure Fold. Des. 7: 769–782. [DOI] [PubMed] [Google Scholar]
- Rice, W. R., 1989. Analyzing tables of statistical tests. Evolution 43: 223–225. [DOI] [PubMed] [Google Scholar]
- Roselli-Rehfuss, L., F. Ye, J. L. Lissemore and D. T. Sullivan, 1992. Structure and expression of the phosphoglycerate kinase (Pgk) gene of Drosophila melanogaster. Mol. Gen. Genet. 235: 213–220. [DOI] [PubMed] [Google Scholar]
- Sabeti, P. C., D. E. Reich, J. M. Higgins, H. Z. Levine, D. J. Richter et al., 2002. Detecting recent positive selection in the human genome from haplotype structure. Nature 419: 832–837. [DOI] [PubMed] [Google Scholar]
- Schmidt, P. S., D. D. Duvernell and W. F. Eanes, 2000. Adaptive evolution of a candidate gene for aging in Drosophila. Proc. Natl. Acad. Sci. USA 97: 10861–10865. [DOI] [PMC free article] [PubMed] [Google Scholar]
- Verrelli, B. C., and W. F. Eanes, 2000. Extensive amino acid polymorphism at the pgm locus is consistent with adaptive protein evolution in Drosophila melanogaster. Genetics 156: 1737–1752. [DOI] [PMC free article] [PubMed] [Google Scholar]
- Verrelli, B. C., and W. F. Eanes, 2001. Clinal variation for amino acid polymorphisms at the Pgm locus in Drosophila melanogaster. Genetics 157: 1649–1663. [DOI] [PMC free article] [PubMed] [Google Scholar]
- Watt, W. B., and A. M. Dean, 2000. Molecular-functional studies of adaptive genetic variation in prokaryotes and eukaryotes. Annu. Rev. Genet. 34: 593–622. [DOI] [PubMed] [Google Scholar]
- Weir, B. S., and W. G. Hill, 2002. Estimating F-statistics. Annu. Rev. Genet. 36: 721–750. [DOI] [PubMed] [Google Scholar]
- Wesley, C. S., and W. F. Eanes, 1994. Isolation and analysis of the breakpoint sequences of chromosome inversion In(3L)Payne in Drosophila melanogaster. Proc. Natl. Acad. Sci. USA 91: 3132–3136. [DOI] [PMC free article] [PubMed] [Google Scholar]