

Abstract
The pattern of response to artificial selection on quantitative traits in laboratory populations can tell us something of the genetic architecture in the natural population from which they were derived. We modeled artificial selection in samples drawn from natural populations in which variation had been maintained by recurrent mutation, with genes having an effect on the trait, which was subject to real stabilizing selection, and a pleitropic effect on fitness (the joint-effect model). Natural selection leads to an inverse correlation between effects and frequencies of genes, such that the frequency distribution of genes increasing the trait has an extreme U-shape. In contrast to the classical infinitesimal model, an early accelerated response and a larger variance of response among replicates were predicted. However, these are reduced if the base population has been maintained in the laboratory for some generations by random sampling prior to artificial selection. When multiple loci and linkage are also taken into account, the gametic disequilibria generated by the Bulmer and Hill-Robertson effects are such that little or no increase in variance and acceleration of response in early generations of artificial selection are predicted; further, the patterns of predicted responses for the joint-effect model now become close to those of the infinitesimal model. Comparison with data from laboratory selection experiments shows that, overall, the analysis did not provide clear support for the joint-effect model or a clear case for rejection.
MANY artificial selection experiments have been applied to populations maintained in the laboratory or recently derived from natural populations. Although mainly directed to problems in animal and plant improvement, they also have implications for evolutionary biology and have the advantage over analyses of natural populations in that parameters such as selection pressures are known (Hill and Caballero 1992; Falconer and Mackay 1996). Information can be extracted from these experiments to infer the genetic architecture of quantitative traits and to check the validity of theoretical models of the maintenance of polygenic variation.
To interpret the observed levels of quantitative genetic variation in natural populations, the two classical models based on mutation-selection balance are real stabilizing selection and pleiotropic selection. In the former, natural selection is assumed to act directly and solely on the quantitative trait (Kimura 1965; Turelli 1984; Bürger 2000), while in the latter natural selection is assumed to act through pleiotropic side effects of mutant alleles on fitness (Robertson 1967; Hill and Keightley 1988; Barton 1990). The response to directional selection for a quantitative trait under the pleiotropic model has been considered in several theoretical studies (Hill and Keightley 1988; Barton 1990; Hill and Mbaga 1998). The conclusion is that artificial selection is likely to overwhelm natural selection against mutations due to their deleterious effects, and large and sustained response is possible despite the associated loss of fitness from the fixation of deleterious mutations (Barton 1990; Hill and Mbaga 1998). This is generally in line with observations from selection experiments. We have recently constructed models in which mutants have effects both on the trait, which is subject to some stabilizing selection, and on overall fitness due to directional or stabilizing selection through pleiotropic effects on all other traits (Zhang and Hill 2002; Zhang et al. 2004a). With typical estimated values of mutation and selection parameters, the joint-effect model of pleiotropic and real stabilizing selection provides a plausible explanation for the high levels of genetic variation observed in quantitative traits. Furthermore, the joint-effect model can explain data from laboratory experiments on the effect of bottlenecking on fitness and morphological traits (Zhang et al. 2004b). It is thus necessary to investigate the properties of such a natural population at mutation-selection balance when artificial selection is subsequently practiced. With predictions of response to directional selection, the validity of the joint-effect model can further be tested by comparison with the data from selection experiments.
Response to short-term selection can be predicted from base population parameters such as heritabilities estimated from correlations among relatives (Falconer and Mackay 1996). As selection proceeds, however, there will be deviations from the initial equilibrium predictions because the population parameters change. In principle, long-term response depends on the number, the frequency, and the effect of each gene influencing the trait under study, together with the interactions introduced by epistasis, the correlations induced by linkage disequilibrium, the strength of natural selection opposing directional selection, and the rate of occurrence and distribution of new mutations (Robertson 1960, 1967; Hill and Robertson 1966; Falconer and Mackay 1996; Hospital and Chevalet 1996; Mackay 2001; Walsh 2004). The problem of predicting long-term response far away from the equilibrium base population parameters is a big challenge in quantitative genetics. While it seems impossible to construct a simple model that includes all the envisaged factors, some information to help a breeder to make decisions about the management and selection of the population may be provided, and the predictions of the model can shed light on its sufficiency to describe the genetic architecture of the quantitative trait.
A reference point is provided by the infinitesimal model, in which a trait is assumed to be influenced by many independent loci each with a small additive effect such that selection does not affect allele frequencies and the decline in genetic variance in the population is due solely to drift (Fisher 1918; Robertson 1960; Bulmer 1980). At its simplest, this model predicts the limiting response is 2Ne times the initial response to selection in the base population, where Ne is the effective size of the selected population (Robertson 1960), and the variance among replicate lines becomes twice the initial genetic variance. These values are somewhat reduced if allowance is made for generation of linkage disequilibrium by artificial selection (i.e., the “Bulmer effect”; see Wei et al. 1996). But, for example, loci with large effects are usually found in QTL analyses of experimental populations (e.g., Paterson et al. 1988) and allele frequencies shift due to selection (Dekoeyer et al. 2001). Assuming that effects of mutant genes follow a gamma distribution but their frequencies are independent of their effects (i.e., a neutral model), Hill and Rasbash (1986) examined the influence of number and effects of mutant genes on response to selection and variance in response among replicates. They found that the shape of the distribution of effects of mutant genes on the quantitative trait is not usually important and the influence of the initial frequency distribution is small.
Previous studies were not based on a model of population history, except very simplistic ones (Hill and Rasbash 1986; Keightley and Hill 1989). In this study, we assume the base population for artificial selection was drawn randomly from a natural population assumed to be at mutation-natural selection balance under joint pleiotropic and real stabilizing selection. Prior to artificial selection, the base population may be maintained in captivity at restricted population size and under conditions of reduced natural selection for many generations (e.g., Latter 1964; Frankham et al. 1968; McPhee and Robertson 1970). This changes the initial gene-frequency distribution (Kimura 1955); in particular, it reduces the negative correlation between gene effects and frequencies induced by natural selection. In natural populations we have assumed that the variation maintained is not affected by linkage among the mutant genes because all mutants are deleterious and are assumed to be eliminated, with none of large effect reaching high frequency (Bulmer 1989; Turelli and Barton 1990). Under these assumptions, loss of a mutant gene by selection does not lead to much reduction in effective selection pressure or reduction in effective population size for other loci. With artificial selection in the base populations established from natural populations, ignoring the effects of linkage may be problematic, basically because genes of large positive effect are now at low frequency, and their sweep through the population can have a substantial effect on the variability and fixation probability of other loci (Hill and Robertson 1966; Robertson 1977).
In this article we relax many of the simplifying assumptions made in previous models to investigate the pattern of short- and long-term response to artificial selection and thereby also evaluate the joint-effect model by comparing predictions with experimental data on long-term selection.
MODELS AND METHODS
Source natural population:
Natural selection:
For simplicity, additive gene action within and across loci, linkage equilibrium, and a randomly mating diploid population are assumed. Infinitely many loci are also assumed and at each locus there is a continuum of possible mutational effects, which are sampled from the same distribution, and consequently loci are interchangeable. At most two alleles are segregating at each locus: the wild type and the mutant. Mutations have effects (a) on a quantitative trait, symmetrically distributed around a = 0, and pleiotropic deleterious effects (s ≥ 0) on fitness, with a bivariate distribution P(a, s). The effects of mutations, |a| and s, were sampled from gamma distributions (Keightley and Hill 1990; Otto and Jones 2000). Mutant genes are assumed to be influenced by both pleiotropic and real stabilizing selection, with the population mean at its optimum. The total selection coefficient of new mutants within each individual can thus be approximated by
 |
1 |
(Zhang and Hill 2002), where x is the frequency of the mutant allele and Vs,r is the strength of real stabilizing selection, the “variance” of the fitness profile, with a large value implying weak selection. The observed stabilizing selection would come from these two parts (i.e., the “joint-selection model”; see Zhang and Hill 2002).
Distribution of gene frequencies:
The natural population was assumed to be at mutation-natural selection balance, with the frequency distribution of mutant genes influencing the trait given by Kimura's (1969) diffusion approximation,
 |
2 |
Here ΦW is the expected number of sites in which the mutants are in the frequency range q to q + dq, M is the effective size of the natural population, and λ is the genome-wide haploid mutation rate. The probability of ultimate fixation of a gene of initial frequency q is
 |
3 |
(Kimura 1962), with  As subsequent artificial selection in the laboratory can see only the quantitative trait, it is relevant to obtain the frequency distribution of mutant genes conditional on their effects on the trait. As natural selection depends on s and a2, and a is symmetrically distributed about 0, the pair of genes (−a, s) and (a, s) have an identical frequency distribution. Genes can be identified as having increasing or decreasing effects on the traits rather than being mutant or wild type, so the L-shaped distribution (2) can be transformed to an equivalent distribution conditional on the size of a,
 |
4 |
This is symmetrical about 0.5 and U-shaped. Here  is the total number of segregating mutants at mutation-selection-drift balance.
Cage population:
In practice, the base populations used for artificial selection are not likely to be drawn directly from nature but perhaps expanded from a small number of captured individuals and then kept as stock in the laboratory for many generations at effective sizes insufficient to avoid loss of variation by genetic drift. The process of maintenance can be described by the Wright-Fisher transition probability matrix. Suppose a caged population of Mc individuals was drawn randomly and without any significant selection from the wild population of M individuals (M ≫ Mc). The probability that there are n copies (i.e., its frequency is n/2Mc) of a particular mutant in the initial cage population is
 |
5 |
The expected number of segregating loci in the cage for the assumed joint distribution f(a) of effects a is  .
.
Artificially selected population:
The artificial selection is assumed to be practiced by truncation selection on individual phenotype and so is likely to overwhelm natural selection against mutations due to their deleterious effects on fitness (Hill and Mbaga 1998), particularly for those genes that have a significant effect on the trait and thus contribute most to the selection response. Natural selection is thus neglected during the artificial selection. Two methods were employed to investigate the response to selection. For independent loci, the transition probability matrix describes the change in gene frequencies at individual loci due to selection and drift; while the individual-based Monte Carlo simulation takes into account multiple loci and linkage.
Transition matrix:
With intensity i of selection on a quantitative trait with phenotypic variance σ2P, the selective value of a gene is ia/σP = (iσE/σP)(a/σE) approximately (Falconer and Mackay 1996). For simplicity, the environmental variance σ2E is assumed to be constant during the selection. Although artificial selection obviously changes the phenotypic variance as gene frequencies change, such a change is small compared with the range of gene effect a and it is reasonable to assume constancy of iσE/σP. Further, the retention or loss of favorable genes at low frequency is likely to be determined in the early generations before changes in variance become important (for further analysis see Wei et al. 1996). Neglecting natural selection, the selection coefficient is
 |
6 |
A Wright-Fisher model was assumed and details of the method are given by Hill and Rasbash (1986). Essentially the mean and variance of change in gene frequency were computed for a range of a values and results were integrated over the distribution of a.
Monte Carlo simulation:
The initial cage populations were sampled assuming linkage and Hardy-Weinberg equilibrium by: (i) determining the expected number of segregating loci in the cage, LC; (ii) sampling effects ai, i = 1, … , LC using the assumed distribution f(a), e.g., gamma 1/4, for specified E(a2), with all LC loci segregating for two alleles, mutant of effect ai and wild type of effect = 0; (iii) sampling the initial frequency for each locus using the conditional distribution of frequency given a, i.e., Equations 4 and 5; (iv) randomly assigning alleles to individual haplotypes to obtain the sampled allele frequency; and (v) obtaining replicate cage populations by repeating the process from ii.
The selection lines were initiated by sampling Mo genotypes from the haplotypes in the cage population. The number of chromosomes of equal length, the number of loci per chromosome, and the map length of the chromosomes were specified. Each generation, (i) genotypic values were computed by summing gene effects over haplotypes and loci for each individual; (ii) a normal deviate (mean 0, variance 1) was sampled to give the environmental deviation and thus the phenotypic value; (iii) individuals were ranked on phenotypic value and the highest Np was selected; (iv) each offspring was drawn independently by random mating without random selfing (i.e., no family structure or sexes); and (v) Mo offspring genotypes were sampled, with successive crossover positions sampled from an exponential distribution with the parameter depending on the length of the chromosome. Selection was continued for a specified number of generations, with replicate sampling of selection lines from the same cage and replicate cage populations. Each generation, the mean phenotypic value and within-line genetic variance were computed for each line, and, from the former, the variance between lines was computed.
Mutations were assumed to follow reproduction and precede selection. The number of mutation events on each haploid follows a Poisson distribution with mean equaling the mutation rate λ, with sites of mutation randomly distributed among the haploids. The effect of new mutation, Δ, was assumed to be symmetrical about zero and to follow a leptokurtic distribution, e.g., a reflected gamma 1/4 of  with the effect of the mutant allele equal to the original effect plus Δ (Turelli 1984).
Alternative genetic models:
Two other models are considered in this study for comparison with the joint-effect model.
Neutral model:
All genes are neutral with respect to fitness in the natural population regardless of their effect on the metric trait, with these effects following a gamma distribution. Gene frequencies are determined by mutation-drift balance, and the frequency of the increasing alleles follows a U-shaped distribution Φ0(q) = 2Mλ/[q(1 − q)] (Hill and Rasbash 1986). Compared with the joint-effect model above, the neutral model differs only in that gene frequencies are independent of their effects prior to artificial selection.
Infinitesimal model and its modifications:
The formulas of Robertson (1960), Bulmer (1974), and Hill (1982a)(b) were employed to generate predictions for the infinitesimal model. If loci are assumed independent and linkage disequilibrium and new mutation are ignored (the model assumed by Robertson 1960), selection is assumed not to alter the gene frequency and genetic variance declines only due to drift as
 |
7a |
The cumulative response and the variance of response among replicates at generation t are given by
 |
7b |
 |
7c |
respectively (Robertson 1960; Falconer and Mackay 1996). The initial response to selection is  which is essentially model independent.
Taking into account the linkage (gametic) disequilibrium induced by the Bulmer effect for unlinked loci and the contribution from new mutations, the change in the genetic variance for the infinitesimal model is given by
 |
8a |
(Keightley and Hill 1987; Chevalet 1994; Hospital and Chevalet 1996; Walsh 2004), where VG is the additive variance and the heritability h2 = VG/(VG + VE), Va is the genic variance (i.e., the sum of the variances contributed by individual loci, excluding disequilibrium), and x is the truncation point on the standard normal distribution corresponding to intensity of selection i. Thus the increment in phenotypic mean is, assuming the breeders' equation,  and the cumulative response and its variance among replicates are calculated as
 |
8b |
 |
8c |
There are no simple general analytical formulas for evaluating the effect of linkage in the infinitesimal model, although some results have been obtained for particular cases (Hill and Robertson 1966; Robertson 1977; Keightley and Hill 1987; Barton 1995; Hospital and Chevalet 1996; Santiago 1998). Therefore, to investigate the more complicated but realistic situations, Monte Carlo simulations were used. The genetic variance was assumed to be caused by a large number (n) of loci distributed evenly along the chromosome, each contributing the same expected genetic variance, and with no initial correlation between the effects at different loci on the same gamete, i.e., linkage equilibrium. The initial populations were sampled by assuming the expected variance contributed by each locus was VG0/n, where VG0 is the initial genetic variance at the start of the artificial selection. The effects of alleles were therefore sampled from a normal 0, VG0/2n distribution, so that a large number of alleles segregated at each locus. As n increases, the simulations should approach the “infinitesimal model”; a value of n = 5740 was used. New mutations were sampled using the same variance of allelic effects: each generation mutations occurred randomly among only 2nVM/VG0 alleles to generate mutational variance VM. Otherwise simulations were undertaken in the same way as when base populations were assumed to be drawn from the wild at mutation-selection balance under the joint pleiotropic and stabilizing selection model.
RESULTS
Distribution of gene frequencies in natural populations
The effects and the initial frequencies of mutant genes have an important influence on the response to selection, but there is little detailed information on how they are distributed. Since heritabilities are typically in the range 0.2–0.5 for the traits in most populations used in selection experiments (Falconer and Mackay 1996; Roff 1997), we assume that the initial heritability in the natural population is 1/3, i.e.,  with the rate and distribution of effects and frequencies of mutants such that this equilibrium value is generated. For example, a natural population of effective size 250 can maintain this genetic variance if it is assumed that all the genes influencing the trait are neutral with respect to fitness and that the mutational variance takes the typical value of VM = 10−3VE (Lynch and Hill 1986). With natural selection, larger population sizes are required to produce the same amount of variation, and a typical effective size of 104 (Frankham 1995) is assumed in this study. Definition and characteristics of the models are listed in Table 1 and their corresponding steady-state gene frequency distributions are shown in Figure 1.
TABLE 1.
Comparison between neutral and natural selection models that maintain the initial genetic variance  and a natural selection model with captive maintenance
| Effect |a|/σP | <0.01 | 0.01–0.1 | 0.1–0.25 | 0.25–0.5 | >0.5 |
|---|---|---|---|---|---|
| Neutral model (M = 250; a, gamma 1/4, λ = 0.3)a | |||||
| LCb | 644 | 483 | 129 | 108 | 21 |
| VG0% | 0.2 | 14 | 41 | 34 | 10 |
| Natural selection without maintenance (M = 104; s, gamma 1/2, mean 0.06; a, reflected gamma 1/4, λ = 0.3, Vs,r = 40VE)c | |||||
| LC | 2758 | 2038 | 394 | 51 | 3 |
| VG0% | 0.2 | 27 | 50 | 19 | 3 |
| Natural selection followed by captive maintenance (M = 104; s, gamma 1/2, mean 0.06; a, reflected gamma 1/4, λ = 0.3, Vs,r = 40VE)d | |||||
| LC | 1253 | 915 | 154 | 20 | 1 |
| VG0% | 0.2 | 27 | 48 | 21 | 3 |
For neutral genes  , where M is the effective size of the population, and the mutational variance is VM = 1/2λE(a2) = 10−3VE. The parameter of the distribution of a depends on the value of the haploid genome mutation rate, λ.
LC is the number of segregating loci within the cage population of size 160.
Effects on the trait (a) and pleiotropic effects on fitness (s) are assumed to be independent.
The cage population was kept for 32 generations with 160 individuals, so at the start of artificial selection  .
.
Figure 1.—

Distributions of gene frequencies corresponding to the three models, with parameters as given in Table 1. The distributions are symmetrical about 0.5 and only the left half is displayed. (a) Distributions shown for recently captured populations (thin solid line) and for populations maintained for 32 generations at size of 160 individuals (dashed line). For comparison the distribution for neutral genes in a captured populations of size 250 is also shown (thick solid line). (b) Distribution conditional on the effect (a) on the trait for captured populations. Thick solid line in b is the same for neutral genes as in a.
To produce the same level of genetic variation in the wild population (e.g.,  ) for a given distribution of a (e.g., reflected gamma 1/4), a larger mean pleiotropic effect
  P is required as the distribution of s becomes more leptokurtic; less genes are then likely to be segregating, but at higher frequencies. For a given distribution of s (e.g., gamma 1/2), as gene effects on the trait become more leptokurtic, a smaller
  P is needed and there are more segregating genes, but most have smaller effects on the trait. If the mutation rate is higher, such that more genes of smaller effect are segregating, or when real stabilizing selection weakens (i.e., increasing Vs,r), a larger
  P is required. For a neutral model, a higher proportion of the segregating genes are at intermediate frequencies than when mutants are at a selective disadvantage (see Table 1 and Figure 1a).
Figure 1b gives the gene frequency distributions for the joint pleiotropic and real stabilizing selection model conditional on the gene effects (a) on the quantitative trait. Genes of large effect remain at very much lower frequencies than those of small effect, and these in turn remain at lower frequencies than the highly heterozygous neutral genes. Although these models imply that the total number of genes influencing a trait of interest may be very large, perhaps thousands, most are of very small effect and the number having effects likely to be detectable in QTL experiments, say a > 0.1σP, is small (see Table 1; cf. Falconer and Mackay 1996; Otto and Jones 2000; Hayes and Goddard 2001). Although those genes of medium to large effects are still few in number, they contribute much of the genetic variance and the response of the trait to artificial selection.
Artificial selection:
To understand the basic processes, we consider for the joint-effect model three alternative genome structures: independent loci (no gametic disequilibrium), unlinked loci, and linked loci.
Independent loci:
Results (dashed lines in Figure 2) were obtained using the transition probability matrix method. Many genes that have large effect but remain at low frequencies under natural selection are lost from the population, but others increase quickly in frequency with artificial selection. These more than counterbalance the loss of variation from fixation of increasing genes initially at high frequency (i.e., where the mutant allele decreased the trait value) and lead to an increase in the within-line genetic variance VG in the early stages of selection (up to generation 15), even though inbreeding is rising. Hence the response R and the standard deviation in response among replicates SD(R) increase more than linearly until intermediate generations (see Figure 2; cf. Barton and Keightley 2002; Walsh 2004). Such an increase in VG and the subsequent accelerated response become larger with increased selection intensity, population size, and gene effects because the impact of artificial selection depends on the product Nia/σP (Robertson 1960). With fixation of most genes of large effect, VG reduces below that expected from genetic drift, R and SD(R) increase more slowly, and selection reaches its limit more quickly, with R∞ < 2NR1 and V∞(R) > 2VG0. As the distribution of pleiotropic effects on fitness in the source natural population becomes less leptokurtic in the model, mean response and the variance among replicate lines are expected to be higher.
Figure 2.—
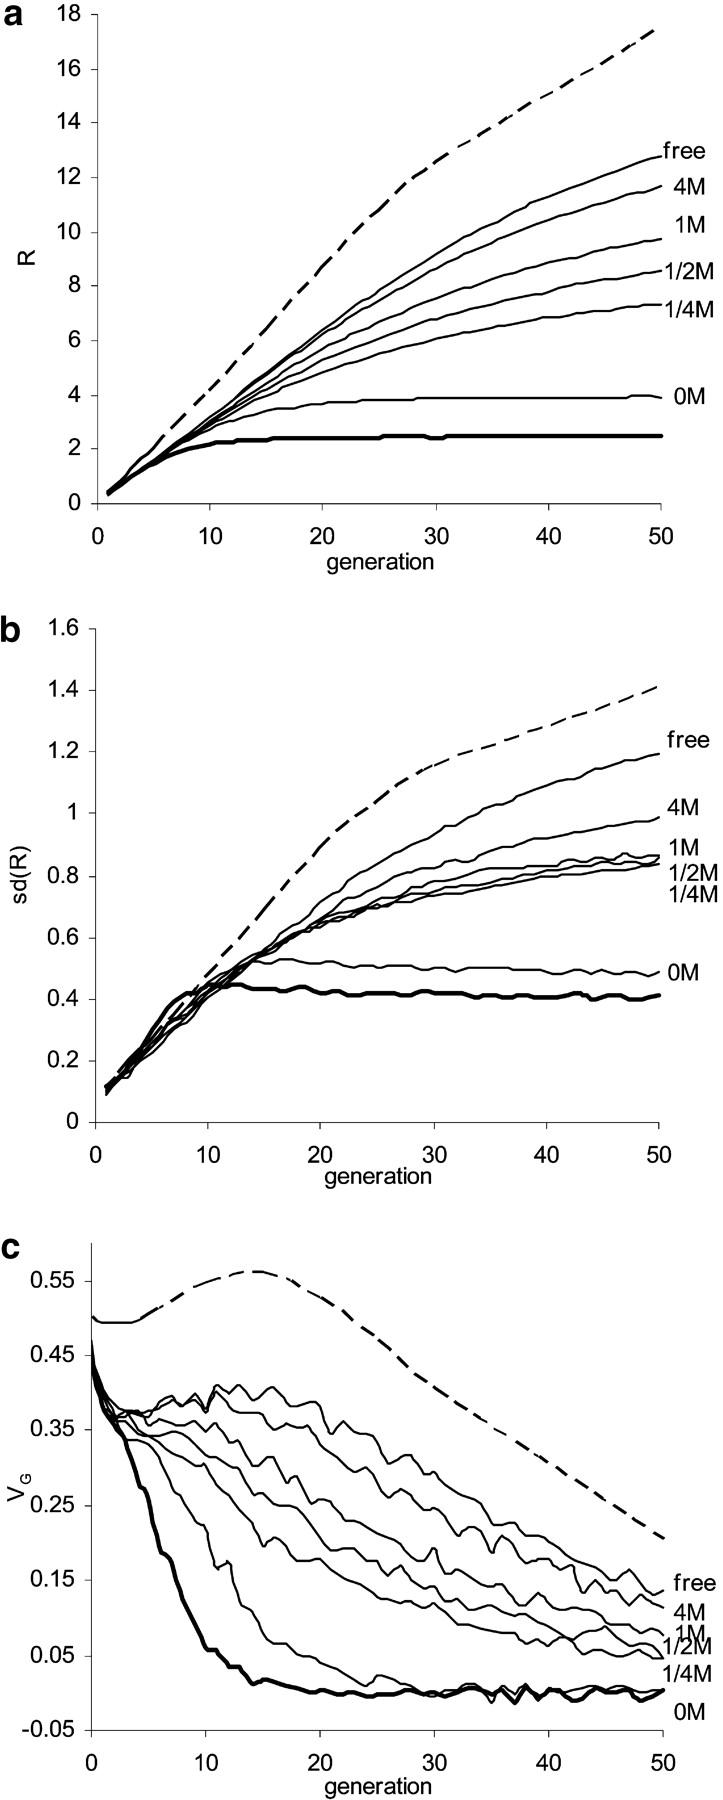
Influences of linkage and the Bulmer effects on (a) response, (b) standard deviation of response among replicate lines, and (c) the within-line genetic variance. The base population was assumed to sample from natural populations at mutation-selection balance, with its initial gene frequency distribution given by Equation 5. The natural population size M was 104 and the equilibrium genetic variance was  . A cage population of size Mc = 160 was drawn from this before artificial selection of intensity i = 0.966 (i.e., 40% selected) and size N = 40. Two methods are used: transition matrix for independent individual loci (dashed lines), and Monte Carlo simulation for genome comprising three chromosomes, each with a map length 0, 1/4, 1/2, 1, 4, and ∞ morgans (M; thin solid lines). Simulations for one completely linked genome (thick solid lines) are included for comparison.
Unlinked loci:
With truncation selection and multiple loci, the Bulmer effect (Bulmer 1971) induces negative disequilibrium (i.e., negative correlation of frequencies of the alleles that increase the trait). The influence of the Bulmer effect on response was investigated using Monte Carlo simulation and assuming free recombination. The variance is reduced, with much of this reduction occurring in the first generation (see Figure 2c, solid lines), and hence the rate and cumulative response to selection in a finite population are also reduced (Wei et al. 1996; Walsh 2004). The increase in VG in the early stages of selection as a consequence of increase in frequency of rare genes of large effect and the accelerated increase in R found for independent genes are thereby offset to some extent.
Influence of linkage:
The impact of the Bulmer effect, which operates in small and large populations, is increased when there is linkage because the disequilibrium generated by truncation selection is released more slowly (Bulmer 1976; Hospital and Chevalet 1996). Further, the linkage between loci also reduces the efficacy of selection in finite populations (Hill and Robertson 1966), because the coupling gametes for genes that increase the trait and are initially absent may not occur before one or the other is lost and due to the reduced effective size around favorable loci as they increase through selective sweeps—the so-called “Hill-Robertson effect.” Taking Drosophila as a model, the genome was assumed to comprise three chromosomes of equal map length, with genes equally spaced among them. It is clearly seen in Figure 2 that, as linkage becomes tighter, there are greater reductions in variance within and between lines and in response (cf. Hill and Robertson 1966; Robertson 1970, 1977). Moreover, the influence of linkage on expected response increases over generations. For instance, with three chromosomes in which all genes are completely linked, the limit to response is approached by generation 10 whereas if genes are unlinked responses continue, such that the difference in response at generation 50 is 8.9 units or 2.3 times higher than that for complete linkage. With recombination, the impact is reduced, such that for chromosomes of map length 1 M there is a reduction of 3.1 in R50. Thus one or two crossovers recover most of the reduction in response induced by linkage (cf. Keightley and Hill 1983). Tight linkage leads to a higher variance of response in the early generations and a smaller variance later.
Influence of effective size of selected population and selection intensity:
Figure 3, a–c, shows the influence of population size during artificial selection under two recombination rates, 1 M per chromosome and free recombination among loci. In the early generations (up to approximately generation 5), no significant influence of population size is seen, but as selection proceeds, differences emerge and increase. With a small population size, VG declines steadily and response approaches its limit sooner. At larger population sizes, VG can increase in the early generations (say from about generation 10 for N = 60) and the response continues longer, particularly with free recombination (cf. Bürger 2000, p. 321). It is seen in Figure 3a that the effect of linkage is small when the population size is small, presumably because the strong drift masks the effects of recombination, which appear as the parameter Ne × recombination rate in the long term (cf. Hill and Robertson 1966; Robertson 1970; Keightley and Hill 1987; Santiago 1998). With a large population size, linkage reduces variance in response among replicates (Figure 3b); whereas for smaller populations linkage increases V(R) in the early generations, but decreases it later (cf. Figure 2b).
Figure 3.—

Effects of population size (with 40% selected; left) and selection intensity (with a selection population size N = 40; right) on (a and d) expected response, (b and e) standard deviation of response among replicates, and (c and f) the within-line genetic variance. Two linkage structures are considered: each chromosome of map length 1 M (dashed line) and free recombination (solid line). In f, note that with free recombination, selection of 20% (thick solid line) produced a higher VG than selection of 70%, between generations 3 and 21. The population was previously under natural selection as in Figure 2.
Figure 3, d–f, shows the impact of selection intensities for two recombination rates. With strong selection, VG can increase during generations 4–7 and declines faster afterward; the response accelerates in the early generations and thus a larger cumulative response is generated. The effects of linkage in reducing both R and VG increase with selection intensity. Results in Figure 3 are given for only the first 50 generations; at later generations the relation between response and selection intensity changes, such that the limit is maximized with selection of ∼50% (Hill and Robertson 1966; Robertson 1970; Hospital and Chevalet 1996). With strong selection, linkage causes a larger variance in response in early generations but a smaller variance later (Figure 3e, cf. Figure 2b).
Influence of maintenance of the base population and the neutral model:
With the joint-effect model, genes of large effect tend to be at very extreme frequencies (Table 1, Figure 1a), whereas with a neutral model the distribution does not depend on size of effect and is of less extreme shape. Such differences lead to only negligible differences in the expected response and the variances within and among lines in very early (say up to three) generations, with response in good agreement with the breeders' equation, R = ih2σP; however, they cause significant differences subsequently (Figure 4). With the neutral model (Hill and Rasbash 1986), there is rapid fixation of large-effect genes in the early stage, VG declines faster than by genetic drift, and R increases more slowly than predicted by the infinitesimal model, whereas V(R) is slightly greater because sampling of genes of large effect has a large influence.
Figure 4.—
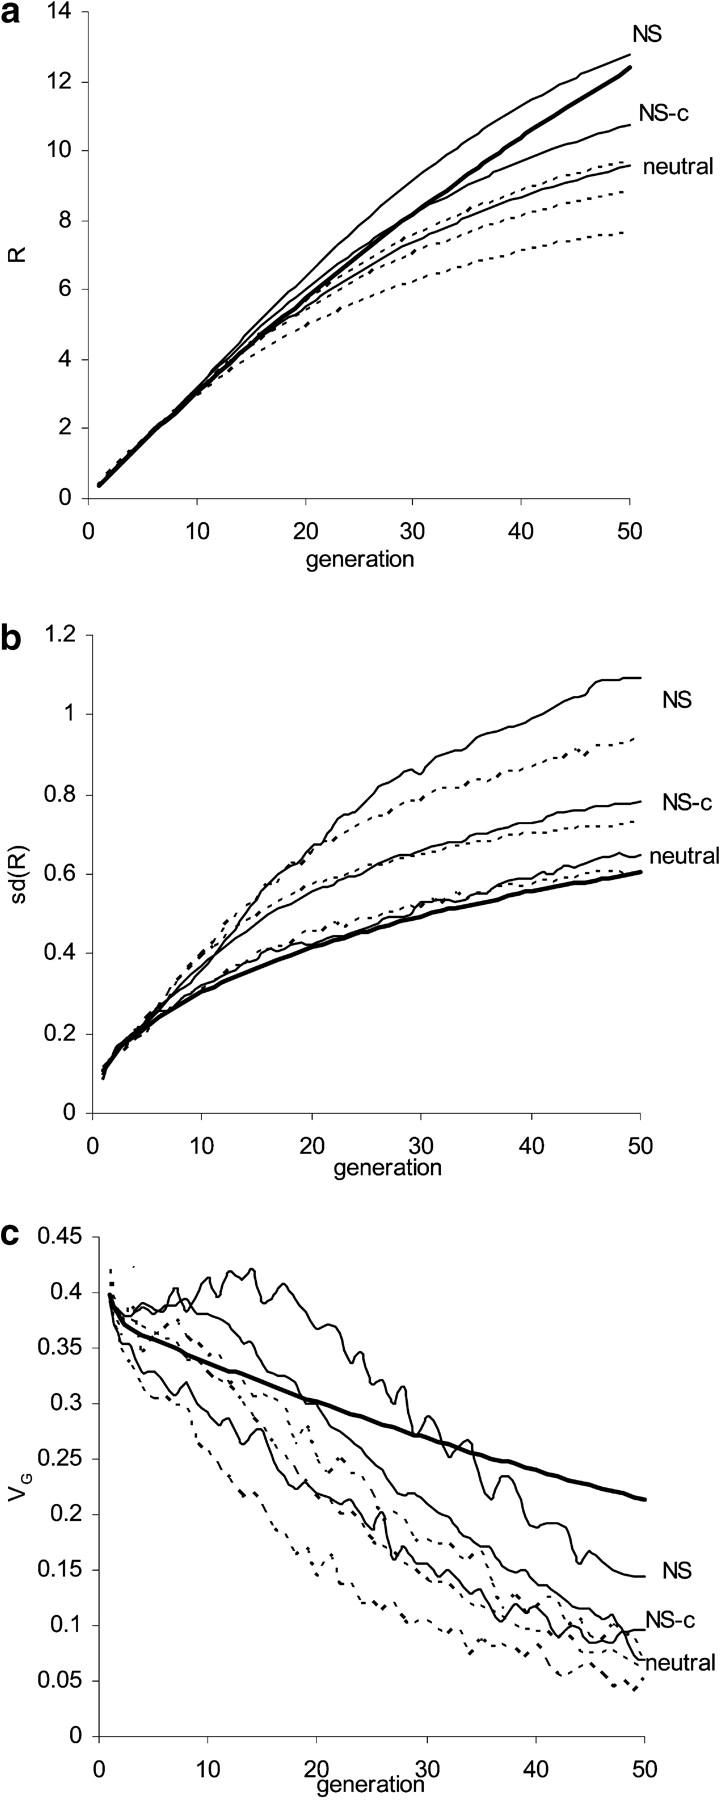
Influence of maintenance of the base population prior to artificial selection on (a) response, (b) standard deviation of response among replicate lines, and (c) the within-line genetic variance. Base populations for artificial selection are either drawn immediately from the wild (“NS”) or maintained captive for 32 generations at a constant size of 160 individuals (“NS-c”) under two recombination rates: free recombination between loci (thin solid lines) and three chromosomes each of length 1 M (dashed lines). Also shown for comparison are the predictions of the infinitesimal model including the Bulmer effect (thick solid lines) and simulation results for the neutrality model (“neutral”). Artificial selection is as in Figure 2 (N = 40, 40% selected).
As populations under artificial selection may not have been drawn directly from nature, “maintenance” here refers to the procedures that are involved in collecting and initially managing the cage population. For example, capture of a small number of individuals or keeping the populations at limited size for many generations will introduce inbreeding and cause both loss of genetic variance and a redistribution of gene frequencies, with the number of segregating genes reduced and their frequency distribution more uniform (see Figure 1a; Kimura 1955; cf. the extreme effects of a population bottleneck, Zhang et al. 2004b). With sufficient inbreeding, VG will increase little following selection, but when selection occurs on lines taken directly from nature, VG can increase substantially in early generations of selection (see Figure 4c), as those remaining genes of large effect have become of more intermediate frequency. Both R and SD(R) are reduced toward values for the neutral model (see Figure 4, a and b). Any artificial selection during the maintenance of the base populations increases the frequencies of large-effect genes and subsequently enhances the increases in VG and R (data not shown). Therefore selection and random sampling during the maintenance of the populations have opposite influences on both initial gene frequency distributions and subsequent response patterns.
Influence of new mutations:
In Figure 5, the contributions to the response of new mutations subsequent to the start of artificial selection are shown for complete linkage, one each chromosome, 1 M per chromosome, and free recombination. New mutations that occur on the segregating loci increase VG and R, negligibly so in the early generations but becoming of significance with long-term selection, proportionately so especially for tight linkage (see Figure 5, a–c). For instance, new mutations increase R50 by 8% for chromosomes of length 1 M. Even with the contribution from new mutations, genetic variance declines to a very low value (cf. Barton and Keightley 2002).
Figure 5.—

Influence of new mutation and comparison between predictions from the natural selection model (left) and from the infinitesimal model and modification of it (right). For the natural selection model (a–c), effects of new mutations were sampled from a reflected gamma 1/4 distribution with mutation rate λ = 0.3 per generation per haploid genome. For the infinitesimal model (d–f), effects of mutations within each locus are sampled from a normal distribution of mean 0 and variance VG0/(2 × 5740) with a rate 2 × 5740 × (VM/VG0) per generation per genome, where VM = 10−3VE and  . Artificial selection is as in Figure 2 (N = 40, 40% selected). Three linkage patterns are considered: each chromosome of map length 0, 1, and ∞ M. Solid lines represent predictions without new mutations while dashed lines show prediction with contribution from new mutation. For comparison, d–f also show the Robertsonian formulas, where genetic drift alone affects frequencies (thin solid lines) and also predictions with incorporation of linkage disequilibrium due to the Bulmer effect (thick solid lines).
Comparisons with the infinitesimal model and its modifications:
For the infinitesimal model, simulation predictions are in good agreement with that from Equation 8 for free recombination (see Figure 5, d–f; Keightley and Hill 1987). With the infinitesimal model, linkage reduces the response and the within-line genetic variance (cf. Robertson 1977) as described above for populations previously under mutation-natural selection balance. New mutations have a similar influence on the predictions of the infinitesimal model as for the joint-selection model (Figure 5, d–f; cf. Figure 5, a–c). For tightly linked chromosomes, the same predictions for R, SD(R), and VG are obtained from the two different models. This is expected from the central limit theorem: trait values contributed from each completely linked chromosome are simply the sum of a large number of allelic effects and thus approach the normal distribution regardless of the distribution of these effects. For a genome of one linked chromosome, our simulation results for the joint-effect model (see solid lines in Figure 2) agree with formulas based on the infinitesimal model given by Keightley and Hill (1987). With recombination, however, the models deviate. In the extreme case of free recombination, the joint-selection model leads to an increase in VG and hence a nonlinear increase in R in the early generations, due to the surviving genes of large effect and low initial frequency, but not for the infinitesimal model where VG declines monotonically.
Comparison between data from selection experiments and theoretical predictions:
Extensive data are collected in artificial selection experiments and comparisons with theory could be done in many ways. Conveniently, Weber and Diggins (1990) and Weber (2004) have summarized data from such experiments with Drosophila melanogaster in terms of R50/R1, the total response to generation 50 normalized by response in generation 1. These are plotted in Figure 6 together with theoretical results for different selection intensities and population sizes. Selection intensity and heritability cancel out from the ratio R50/R1 in predictions from the classical infinitesimal model of independent loci (Robertson 1960, see Equation 7); however, they do affect predictions when linkage disequilibrium is included. The experimental data, for which selection intensities ranged from 0.6 to 1.8, have been classified into two broad groups: strong selection (i > 1.0; Figure 6, diamonds) and weak selection (i ≤ 1; Figure 6, circles). These data have been plotted against Weber's estimates of effective population size, which are often much smaller than the actual number of individuals. To compare the simulations with experiments, the effective size (Ne) of selected populations in the simulated models has also been computed and used in Figure 6. To estimate Ne, an additional set of 15 neutral loci with free recombination among them was assumed to have initial allele frequencies one-half and no subsequent mutations. The average heterozygosity was recorded each generation and Ne was estimated from the decline in heterozygosity (Falconer and Mackay 1996). The Ne so computed is equivalent to that from the pedigree inbreeding, rather than that of neutral genes interspersed within the chromosomes (cf. Santiago 1998). Theoretical predictions are given for three different proportions of selected and consequent intensities (70, 40, and 20% selected, corresponding to i ≅ 0.5, 1.0. and 1.4, respectively) with chromosomes of length 1 M and initial heritability h20 ≅ 0.31, parameters that are intended to be typical for populations of Drosophila used for selection experiments (Latter 1964; Frankham et al. 1968; McPhee and Robertson 1970; Weber and Diggins 1990; Falconer and Mackay 1996).
Figure 6.—

Comparison between predicted and experimental values of the total response after 50 generations, relative to the initial response (R50/R1), plotted against the effective size of the population under artificial selection. Theoretical predictions are based on selection of 20% (dotted lines), 40% (dashed lines), and 70% (solid lines) selection, assuming three chromosomes each of length 1 M. Data points (diamonds, i > 1.0; circles, i < 1.0) are experimental results on selection in Drosophila, from Weber and Diggins (1990). (a) Artificial selection starting from base populations drawn immediately from a natural population at mutation-selection balance under the joint pleiotropic and stabilizing selection model, with contributions from new mutations (thick solid lines) and without new mutations (thin solid lines). (b) Artificial selection starting from base populations taken from nature and kept for 32 generations at a size 160, including contributions from new mutations. (c) The predictions from the infinitesimal model, modified to include new mutation and linkage. Robertsonian predictions with new mutation and the Bulmer effect (thick solid line, assuming 40% selected) are shown in c for comparison.
In general, larger R50/R1 values were found with weaker selection for a given Ne (Figure 6). For base populations founded immediately from natural populations at mutation-selection balance, the simulation predictions of the ratio R50/R1 with and without new mutations are given in Figure 6a. It is noted that with weak selection, predictions of R50/R1 based on the joint selection model are close to that of the infinitesimal model (see Figure 6c). With stronger selection, the predicted values of R50/R1 fall but the contribution from new mutations rises, reflecting that new mutations of large effect are more likely to be fixed under strong selection. For small effective size, say Ne < 20, there is a good agreement between theoretical predictions and experimental data. For large effective sizes, predictions for 40% selection without new mutation appear to fit well with data, as do those for 20% selection with new mutations. Assuming prior captive maintenance of the base population (32 generations at size 160 individuals prior to selection) under the joint-effect model, predictions under strong selection (i.e., i ≥ 1.0) with new mutations seem to fit the data for large population sizes (Figure 6b) whereas those for weak selection are too high. It is obvious that if the base population is kept at a small size longer before selection starts, the predictions of the ratio R50/R1 will be further reduced given the same initial genetic variance (i.e., the heritability). For traits of high heritability, initial responses will be higher, but the ratio R50/R1 is likely to be smaller due to the effect of more linkage disequilibrium. For example, the ratio R50/R1 reduces from 27 to 23 as h20 increases from 0.31 to 0.52 for artificial selection in a population of size N = 40 and 40% selection from base populations following captive maintenance for 32 generations at size 160. By suitable choice of the parameters, theoretical predictions can fit with the empirical data.
Although predictions from Robertson's (1960) formula deviate further with increasing effective size of selected population (Weber and Diggins 1990; Weber 2004), multilocus models including linkage disequilibrium due to both the Bulmer and Hill-Robertson effects can bring theoretical predictions down to observed results even when new mutations are included (Figure 6c). Comparing the predictions from formulas (8) that take into account linkage disequilibrium due only to the Bulmer effect and simulations including linkage disequilibrium, it is obvious that linkage has a large influence on the predictions (also see discussion below). Thus the infinitesimal model with some realistic parameters can be modified to give a good fit with data. In the light of this, it seems that the infinitesimal model is adequate despite its obviously incorrect assumptions on the number and effect size of genes (cf. Goddard 2001).
DISCUSSION
Patterns of response to artificial selection have been investigated under the assumption that the base population has been drawn from a natural population at mutation-selection balance under the joint pleiotropic and real stabilizing selection model (Zhang and Hill 2002; Zhang et al. 2004a). Natural selection produces extreme distributions of the frequencies of genes of large effect under this model, and such inversely related frequencies and effects of genes could give rise to different response patterns from those of the infinitesimal (Robertson 1960) and the neutral models (Hill and Rasbash 1986). However, other factors can also have an impact. These include maintenance of the population in a cage prior to selection and linkage disequilibrium due to both the Bulmer and the Hill-Robertson effects. These factors considerably affect the predicted response patterns and generally give predictions that are in broad agreement both with observations in selection experiments (Clayton et al. 1957; Frankham et al. 1968; Yoo 1980; Atkins and Thompson 1986; Martinez et al. 2000; Hill and Bünger 2004) and from predictions for the infinitesimal model (Goddard 2001).
Gene effects are assumed to follow a leptokurtic gamma distribution in the models presented here. Under a combination of pleiotropic and real stabilizing selection, the total numbers of genes influencing the trait in a cage population are large, ranging from ∼103 to 104, but >90% of these are of effect a < 0.1σP and account for only ∼27% of the genetic variance (see Table 1), whereas those with effects a > 0.1σP contribute most of the genetic variance and response. The presence of few genes of large effects (Table 1) is compatible with findings from QTL mapping experiments (Falconer and Mackay 1996, p. 371; Weber et al. 1999; Otto and Jones 2000). These genes of large effect under apparent stabilizing selection remain at low frequencies in the wild (Figure 1b) and thus contribute a small proportion of the initial genetic variance (Table 1). If acting independently, their frequencies can increase rapidly under strong artificial selection and hence cause an increase in VG in the early stages of selection (cf. Keightley and Hill 1989; Walsh 2004), resulting in an accelerated response and a rapid increase in variance of response among replicates (Figure 2); but these effects are largely masked by negative gametic disequilibrium.
Negative linkage (gametic) disequilibrium (LD) caused by the reduced variation among selected individuals (Bulmer 1971, 1976; Hospital and Chevalet 1996) and the absence of coupling haplotypes of favorable genes (Hill and Robertson 1966) reduce the genetic variance of the trait and thus response, as shown by simulations presented here (Figure 5). If the gene frequencies are at mutation-drift equilibrium (i.e., neutral model), the reductions in R50 are 3% from the Bulmer effect with free recombination (Figure 4; cf. Hill and Rasbash 1986; Walsh 2004) and an additional 19% with linkage (assuming three chromosomes each of length 1 M), respectively, given N = 40 and 40% selected; while the corresponding reductions are 26 and 23% if the natural population is at mutation-selection balance under the joint-selection model (Figure 2a). For the infinitesimal model, these reductions are 7 and 24% (Figure 5). This indicates that with free recombination, the Bulmer effect depends on the genetic architecture; whereas the additional reduction due to linkage seems less dependent on the model. It is also clearly shown in Figure 3 that the influence of linkage on absolute response is greater for large population sizes and high intensities of selection (i.e., high population size times selection value; cf. Keightley and Hill 1987; Santiago 1998). McPhee and Robertson (1970) demonstrated the effects of linkage by suppressing crossing over on chromosomes II and III in D. melanogaster. Comparing selection for sternopleural bristles in experiments of size N = 20 (Ne ∼ 10) and 40% selection under normal recombination and when crossing over was almost completely suppressed on the two large autosomes, they found the response at the limit was reduced by on average 25%. Our predictions on the effect of linkage appear to agree with this observation (Figure 3).
With decreasing selection intensity, there is less rapid increase in mean and variance among replicates in response, while VG declines less quickly. This is because genes of large effect have increasing chance of being lost under weak selection. For the same selection intensity, a smaller population produces a lower response, but a larger SD(R) in the early generations (Figure 3). The mutational variance appears to have nearly the same value, VM ∼ 10−3 VE, across a wide range of populations and species (Lynch and Walsh 1998; Lynch et al. 1999; Keightley 2004), but there is less information on the mutation rate per locus. If this rate is high, the average effects of genes that can maintain the same VG0 become small. As the impact of artificial selection depends on the product Nia/σP, it is obvious that the response pattern predicted is close to that from the infinitesimal model when Nia is small.
For simplicity, independent effects of genes on the trait and through pleiotropic effects on fitness were assumed in this study. If gene effects on the trait and fitness are correlated due to pleiotropy, genes of large effect on the trait will remain at much lower frequencies. With such a correlation, fitness will be reduced as artificial selection proceeds. Maintaining populations in the laboratory in bottles or cages for many generations before selection, as is often the case (Latter 1964; Frankham et al. 1968; McPhee and Robertson 1970), presumably mitigates the effect of natural selection to generate an extremely U-shaped probability distribution of allele frequencies. For example, there are initially predicted to be 54 segregating genes with effects a > 0.25σP, which contribute 21% of VG0; whereas after 32 generations in a population of 160 individuals, only 21 are left; although their frequencies will have risen such that they still contribute 24% of that initially (Table 1). Such random sampling in the laboratory reduces the accelerated response and variance among replicates expected with immediate selection from the newly captured population particularly if linkage is weak (Figure 4).
In this investigation, additivity of gene action is assumed for both the quantitative trait and the pleiotropic fitness effect. Empirical data indicate that gene action is approximately additive for its effect on the trait, but is quite recessive for its pleiotropic fitness effect, with mean dominance coefficient (h) in the range 0.1–0.2 (García-Dorado et al. 2004). If the effective size (M) of the wild population is sufficiently large that Mhs ≫ 1, most mutant genes are likely to segregate as heterozygotes, and s in Equation 1 should be replaced by 2hs (Zhang et al. 2004a). As the dominance coefficients of mutant genes for fitness are negatively correlated with their effect (Caballero and Keightley 1994), with varying dominance both the mean and the leptokurtosis of the distribution of pleiotropic effects of heterozygotes are likely to be less. Therefore the influence of dominance could be modeled by decreasing the values of these parameters, leading to a less extreme initial distribution of gene frequencies and a closer agreement with predictions from the infinitesimal model.
Taking into account all those effects, the patterns of responses predicted from the joint-effect model (Figure 6, a and b) are broadly compatible with those observed in selection experiments (see, e.g., Falconer and Mackay 1996), although we have considered in detail only the ratio R50/R1. However, the difficulty in drawing any clear conclusions about the validity of the joint-selection model is that many factors can alter theoretical predictions. The infinitesimal model (Fisher 1918) has the simple assumption that there are infinite numbers of genes of infinitesimal additive effect, but there is evidence of genes of large effect from QTL experiments (Paterson et al. 1988; Goddard 2001; Hayes and Goddard 2001). Nevertheless good agreement has been shown for periods of many generations between infinitesimal predictions and response patterns observed in selection experiments (e.g., Clayton et al. 1957; Frankham VG0 et al. 1968; Yoo 1980; Atkins and Thompson 1986; Martinez et al. 2000) and domestic animals (Hill and Bünger 2004). After considering realistic factors that influence the selection populations, the infinitesimal predictions of R50/R1 are also in good agreement with experimental data (Figure 6c). This observation may imply that the infinitesimal prediction of response is robust at least until the medium term (Goddard 2001), perhaps for compensating reasons: for example, the presence of genes of large effect at low frequency.
Thus the two very distinct genetic models lead to similar response patterns such that differences may be difficult to discern in selection experiments conducted in the laboratory with a limited number of replicates. In view of the very extreme initial distribution of gene frequencies and effects in the joint-effect model, patterns of response might be substantially affected by putting the population through a bottleneck of very few individuals, not least because genes of large effect that are initially rare will have a high chance of loss before selection starts (Robertson 1960; Frankham 1981). Maintenance of the population prior to selection with N = 160 and t = 32, i.e., ∼F = 0.1, had little effect (Figure 4). Further simulation (not shown) for one generation of full-sib mating (N = 2, t = 1, F = 0.25) suggests that while such a bottleneck reduces variance and response by one-quarter, it does not have a major impact on the expected pattern of response for linked loci (e.g., three chromosomes of 1 M each), although the variance among replicates is slightly increased. Frankham (1981) concluded from a review of experiments that, indeed, the effect of a population bottleneck is to reduce initial response by one-quarter, but that long-term responses are unpredictable. Therefore it turns out that a bottleneck does not have strong discriminating power, particularly when effects of linkage on response are incorporated.
There is much more prospect in distinguishing between genetic models using QTL mapping to directly reveal the genetic architecture of the chromosomal regions that control the traits (Barton and Keightley 2002). QTL mapping results indicate that there are indeed genomic regions having large effects, although not all experiments have sufficient precision to distinguish between single and multiple linked QTL. Our results indicate that apparent fits of response to selection to infinitesimal model predictions do not preclude the existence of genes of large effect and provide a bridge between the apparently contradictory observations.
Concerns have been expressed that mutation-selection balance could not be a plausible mechanism for the maintenance of quantitative genetic variability because variance would increase on artificial selection (Maynard Smith 1989, Chap. 6). The results obtained here for multiple linked loci meet this objection because the gametic disequilibrium generated counteracts the increase in variance at independent loci. Further, captive maintenance also reduces the initial increase in variance with artificial selection. Although the impact of linkage is likely to be weaker in mammals and birds with many more chromosomes than Drosophila, artificial selection experiments and breeding programs in such species are typically not founded directly from natural populations.
In conclusion, this study has shown that it is possible to obtain satisfactory predictions of response to artificial selection in laboratory populations derived from natural populations over quite a wide range of possible parameter values. However, the analysis also shows that the response is rather robust to model assumptions, and that, for example, an infinitesimal model may fit quite well. Thus the results did not provide very strong support for the joint-effect model of pleiotropic and real stabilizing selection as the mechanism for maintenance of quantitative variation in natural populations (Zhang and Hill 2002; Zhang et al. 2004a), nor did they provide any clear case for rejection.
Acknowledgments
We are grateful to two reviewers for helpful comments. This work was supported by a grant from the Biotechnology and Biological Sciences Research Council (15/G13242).
References
- Atkins, K. D., and R. Thompson, 1986. Predicted and realised responses to selection for an index of bone length and body weight in Scottish Blackface sheep. Anim. Prod. 43: 421–435. [Google Scholar]
- Barton, N. H., 1990. Pleiotropic models of quantitative variation. Genetics 124: 209–216. [DOI] [PMC free article] [PubMed] [Google Scholar]
- Barton, N. H., 1995. Linkage and limits to natural selection. Genetics 140: 821–841. [DOI] [PMC free article] [PubMed] [Google Scholar]
- Barton, N. H., and P. D. Keightley, 2002. Understanding quantitative genetic variation. Nat. Genet. 3: 11–21. [DOI] [PubMed] [Google Scholar]
- Bulmer, M. G., 1971. The effect of selection on genetic variability. Am. Nat. 105: 201–211. [Google Scholar]
- Bulmer, M. G., 1974. Linkage disequilibrium and genetic variability. Genet. Res. 23: 281–289. [DOI] [PubMed] [Google Scholar]
- Bulmer, M. G., 1976. The effect of selection on genetic variability: a simulation study. Genet. Res. 28: 101–117. [DOI] [PubMed] [Google Scholar]
- Bulmer, M. G., 1980 The Mathematical Theory of Quantitative Genetics. Clarendon Press, Oxford.
- Bulmer, M. G., 1989. Maintenance of genetic variability by mutation-selection balance: a child's guide through the jungle. Genome 31: 761–767. [Google Scholar]
- Bürger, R., 2000 The Mathematical Theory of Selection, Recombination and Mutation. Wiley, Chichester, UK.
- Caballero, A., and P. D. Keightley, 1994. A pleiotropic nonadditive model of variation in quantitative traits. Genetics 138: 883–900. [DOI] [PMC free article] [PubMed] [Google Scholar]
- Chevalet, C., 1994. An approximate theory of selection assuming a finite number of quantitative traits loci. Genet. Sel. Evol. 26: 379–400. [Google Scholar]
- Clayton, G. A., J. A. Morris and A. Robertson, 1957. An experimental check on quantitative genetical theory. I. Short-term responses to selection. J. Genet. 55: 131–151. [Google Scholar]
- Dekoeyer, D. L., R. L. Philips and D. D. Stuthman, 2001. Allelic shifts and quantitative trait loci in a recurrent selection population of oat. Crop Sci. 41: 1228–1234. [Google Scholar]
- Falconer, D. S., and T. F. C. Mackay, 1996 Introduction to Quantitative Genetics, Ed. 4. Longman, Harlow, UK.
- Fisher, R. A., 1918. The correlation between relatives on the supposition of Mendelian inheritance. Trans. R. Soc. Edinb. 52: 399–433. [Google Scholar]
- Frankham, R., 1981 The founder effect and response to artificial selection in Drosophila, pp. 87–90 in Selection Experiments in Laboratory and Domestic Animal, edited by A. Robertson. Commonwealth Agricultural Bureaux, Slough, England.
- Frankham, R., 1995. Effective population size adult population size ratios in wildlife—a review. Genet. Res. 66: 95–107. [DOI] [PubMed] [Google Scholar]
- Frankham, R., L. P. Jones and J. S. F. Barker, 1968. The effects of population size and selection intensity in selection for a quantitative character in Drosophila 1. Short-term response to selection. Genet. Res. 12: 237–248. [DOI] [PubMed] [Google Scholar]
- García-Dorado, A., C. López-Fanjul and A. Caballero, 2004 Rates and effects of deleterious mutations and their evolutionary consequences, pp. 20–32 in Evolution of Molecules and Ecosystems, edited by A. Moya and E. Font. Oxford University Press, London/New York/Oxford (in press).
- Goddard, M. E., 2001. The validity of genetic models underlying quantitative traits. Livest. Prod. Sci. 72: 117–127. [Google Scholar]
- Hayes, B., and M. E. Goddard, 2001. The distribution of the effects of genes affecting quantitative traits in livestock. Genet. Sel. Evol. 33: 209–229. [DOI] [PMC free article] [PubMed] [Google Scholar]
- Hill, W. G., 1982. a Rates of change in quantitative traits from fixation of new mutations. Proc. Natl. Acad. Sci. USA 79: 142–145. [DOI] [PMC free article] [PubMed] [Google Scholar]
- Hill, W. G., 1982. b Predictions of response to artificial selection from new mutations. Genet. Res. 40: 255–278. [DOI] [PubMed] [Google Scholar]
- Hill, W. G., and L. Bünger, 2004. Inferences on the genetics of quantitative traits from long-term selection in laboratory and domestic animals. Plant Breed. Rev. 24(Pt. 2): 169–210. [Google Scholar]
- Hill, W. G., and A. Caballero, 1992. Artificial selection experiments. Annu. Rev. Ecol. Syst. 23: 287–310. [Google Scholar]
- Hill, W. G., and P. D. Keightley, 1988 Interrelations of mutation, population size, artificial and natural selection, pp. 57–70 in Proceedings of the 2nd International Conference on Quantitative Genetics, edited by B. S. Weir, E. J. Eisen, M. M. Goodman and G. Namkoong. Sinauer, Sunderland, MA.
- Hill, W. G., and S. H. Mbaga, 1998. Mutation and conflicts between artificial selection and natural selection for quantitative traits. Genetica 102/103: 171–181. [PubMed] [Google Scholar]
- Hill, W. G., and J. Rasbash, 1986. Models of long term artificial selection in finite population. Genet. Res. 48: 41–50. [DOI] [PubMed] [Google Scholar]
- Hill, W. G., and A. Robertson, 1966. The effect of linkage on limits to artificial selection. Genet Res. 8: 269–294. [PubMed] [Google Scholar]
- Hospital, F., and C. Chevalet, 1996. Interaction of selection, linkage and drift in the dynamics of polygenic characters. Genet. Res. 67: 77–87. [DOI] [PubMed] [Google Scholar]
- Keightley, P. D., 2004. Mutational variation and long-term selection response. Plant Breed. Rev. 24(Pt. 1): 227–247. [Google Scholar]
- Keightley, P. D., and W. G. Hill, 1983. Effects of linkage on response to directional selection from new mutations. Genet Res. 42: 193–206. [DOI] [PubMed] [Google Scholar]
- Keightley, P. D., and W. G. Hill, 1987. Directional selection and variation in finite populations. Genetics 117: 573–582. [DOI] [PMC free article] [PubMed] [Google Scholar]
- Keightley, P. D., and W. G. Hill, 1989. Quantitative genetic variability maintained by mutation-stabilizing selection balance: sampling variation and response to subsequent directional selection. Genet. Res. 52: 33–43. [DOI] [PubMed] [Google Scholar]
- Keightley, P. D., and W. G. Hill, 1990. Variation maintained in quantitative traits with mutation-selection balance: pleiotropic side-effects on fitness traits. Proc. R. Soc. Lond. Ser. B 242: 95–100. [Google Scholar]
- Kimura, M., 1955. Solution of a process of random genetic drift with a continuous model. Proc. Natl. Acad. Sci. USA 41: 144–150. [DOI] [PMC free article] [PubMed] [Google Scholar]
- Kimura, M., 1962. On the probability of fixation of mutant genes in a population. Genetics 47: 713–719. [DOI] [PMC free article] [PubMed] [Google Scholar]
- Kimura, M., 1965. A stochastic model concerning the maintenance of genetic variability in quantitative characters. Proc. Natl. Acad. Sci. USA 54: 731–736. [DOI] [PMC free article] [PubMed] [Google Scholar]
- Kimura, M., 1969. The number of heterozygous nucleotide sites maintained in a finite population due to steady flux of mutations. Genetics 61: 893–903. [DOI] [PMC free article] [PubMed] [Google Scholar]
- Latter, B. D. H., 1964. Selection for a threshold character in Drosophila. I. An analysis of the phenotypic variance on the underlying scale. Genet. Res. 5: 198–210. [Google Scholar]
- Lynch, M. J., and W. G. Hill, 1986. Phenotypic evolution by neutral mutation. Evolution 40: 915–935. [DOI] [PubMed] [Google Scholar]
- Lynch, M., and B. Walsh, 1998 Genetics and Analysis of Quantitative Traits. Sinauer, Sunderland, MA.
- Lynch, M., J. Blanchard, D. Houle, T. Kibota, S. Schultz et al., 1999. Perspective: spontaneous deleterious mutation. Evolution 53: 645–663. [DOI] [PubMed] [Google Scholar]
- Mackay, T. F. C., 2001. The genetic architecture of quantitative traits. Annu. Rev. Genet. 35: 303–339. [DOI] [PubMed] [Google Scholar]
- Martinez, V., L. Bünger and W. G. Hill, 2000. Analysis of response to 20 generations of selection for body composition in mice: fit to infinitesimal model assumptions. Genet. Sel. Evol. 32: 3–21. [DOI] [PMC free article] [PubMed] [Google Scholar]
- Maynard Smith, J., 1989 Evolutionary Genetics. Oxford University Press, London/New York/Oxford.
- McPhee, C. P., and A. Robertson, 1970. The effect of suppressing crossing-over on the response to selection in Drosophila melanogaster. Genet. Res. 16: 1–16. [DOI] [PubMed] [Google Scholar]
- Otto, S. P., and C. D. Jones, 2000. Detecting the undetected: estimating the total number of loci underlying a quantitative trait. Genetics 156: 2093–2107. [DOI] [PMC free article] [PubMed] [Google Scholar]
- Paterson, A. H., E. S. Lander, J. D. Hewitt, S. Peterson, S. E. Lincoln et al., 1988. Resolution of quantitative traits into Mendelian factors using a complete linkage map of restriction fragment length polymorphisms. Nature 335: 721–726. [DOI] [PubMed] [Google Scholar]
- Robertson, A., 1960. A theory of limits in artificial selection. Proc. R. Soc. Lond. Ser. B 153: 234–249. [Google Scholar]
- Robertson, A., 1967 The nature of quantitative genetic variation, pp. 265–280 in Heritage From Mendel, edited by A. Brink. University of Wisconsin Press, Madison, WI.
- Robertson, A., 1970 A theory of limits in artificial selection with many linked loci, pp. 246–288 in Mathematical Topics in Population Genetics, edited by K. Kojima. Springer-Verlag, Berlin/New York.
- Robertson, A., 1977 Artificial selection with a large number of linked loci, pp. 307–322 in Proceedings of the 1st International Conference on Quantitative Genetics, edited by E. Pollak, O. Kempthorne and T. B. Bailey, Jr. Iowa State University Press, Ames, IA.
- Roff, D. A., 1997 Evolutionary Quantitative Genetics. Chapman & Hall, London/New York.
- Santiago, E., 1998. Linkage and the maintenance of variation for quantitative traits by mutation-selection balance: an infinitesimal model. Genet. Res. 71: 161–170. [Google Scholar]
- Turelli, M., 1984. The heritable genetic variation via mutation-selection balance: Lerch's Zeta meets the abdominal bristle. Theor. Popul. Biol. 25: 138–193. [DOI] [PubMed] [Google Scholar]
- Turelli, M., and N. H. Barton, 1990. Dynamics of polygenic characters under selection. Theor. Popul. Biol. 38: 1–57. [Google Scholar]
- Walsh, B., 2004. Population- and quantitative-genetic models of selection limits. Plant Breed. Rev. 24(Pt. 1): 177–225. [Google Scholar]
- Weber, K., 2004. Population size and long-term selection. Plant Breed. Rev. 24(Pt. 1): 249–268. [Google Scholar]
- Weber, K. E., and L. T. Diggins, 1990. Increased selection response in large populations. II. Selection for ethanol vapour resistance in Drosophila melanogaster at two population sizes. Genetics 125: 585–597. [DOI] [PMC free article] [PubMed] [Google Scholar]
- Weber, K., R. Eisman, L. Morey, A. Patty, J. Sparks et al., 1999. An analysis of polygenes affecting wing shape on chromosome 3 in Drosophila melanogaster. Genetics 153: 773–786. [DOI] [PMC free article] [PubMed] [Google Scholar]
- Wei, M., A. Caballero and W. G. Hill, 1996. Selection response in finite population. Genetics 144: 1961–1974. [DOI] [PMC free article] [PubMed] [Google Scholar]
- Yoo, B. H., 1980. Long-term selection for a quantitative character in large replicate populations of Drosophila melanogaster. Genet. Res. 35: 1–17. [DOI] [PubMed] [Google Scholar]
- Zhang, X.-S., and W. G. Hill, 2002. Joint effect of pleiotropic selection and real stabilizing selection on the maintenance of quantitative genetic variation at mutation-selection balance. Genetics 162: 459–471. [DOI] [PMC free article] [PubMed] [Google Scholar]
- Zhang, X.-S., J. Wang and W. G. Hill, 2004. a Influence of dominance, leptokurtosis and pleiotropy of deleterious mutations on quantitative genetic variance at mutation-selection balance. Genetics 166: 597–610. [DOI] [PMC free article] [PubMed] [Google Scholar]
- Zhang, X.-S., J. Wang and W. G. Hill, 2004. b Redistribution of gene frequency and changes of genetic variation following a bottleneck in population size. Genetics 167: 1475–1492. [DOI] [PMC free article] [PubMed] [Google Scholar]