

Abstract
We use evolutionary trees of haplotypes to study phenotypic associations by exhaustively examining all possible biallelic partitions of the tree, a technique we call tree scanning. If the first scan detects significant associations, additional rounds of tree scanning are used to partition the tree into three or more allelic classes. Two worked examples are presented. The first is a reanalysis of associations between haplotypes at the Alcohol Dehydrogenase locus in Drosophila melanogaster that was previously analyzed using a nested clade analysis, a more complicated technique for using haplotype trees to detect phenotypic associations. Tree scanning and the nested clade analysis yield the same inferences when permutation testing is used with both approaches. The second example is an analysis of associations between variation in various lipid traits and genetic variation at the Apolipoprotein E (APOE) gene in three human populations. Tree scanning successfully identified phenotypic associations expected from previous analyses. Tree scanning for the most part detected more associations and provided a better biological interpretative framework than single SNP analyses. We also show how prior information can be incorporated into the tree scan by starting with the traditional three electrophoretic alleles at APOE. Tree scanning detected genetically determined phenotypic heterogeneity within all three electrophoretic allelic classes. Overall, tree scanning is a simple, powerful, and flexible method for using haplotype trees to detect phenotype/genotype associations at candidate loci.
MANY studies attempt to associate trait variation with genetic variation at a candidate gene by employing separate tests at each polymorphic nucleotide site within the gene, even when the sites display extensive linkage disequilibrium. Increasingly, there is an appreciation that using haplotypes can often augment power for detecting phenotypic associations and can eliminate the difficulties of statistical dependence among polymorphic sites showing linkage disequilibrium (Drysdale et al. 2000; Martin et al. 2000; Seltman et al. 2001; Balciuniene et al. 2002; Knoblauch et al. 2002; Van Eerdewegh et al. 2002; Zaykin et al. 2002). The tendency for haplotype analyses to show increased power over single-nucleotide polymorphism (SNP) analyses is not surprising if SNPs do not always affect phenotypes in isolation but rather affect the phenotype through the joint genetic effects of two or more SNPs.
An evolutionary tree of the haplotypes at a candidate locus or DNA region can be estimated when there is little to no recombination in the DNA region. Given that there is increasing evidence for areas of low recombination separated by recombination hotspots (Templeton et al. 2000; Jeffreys et al. 2001; Reich et al. 2002), haplotype variation in many genomic regions can be organized into haplotype trees. Just as SNPs can be placed into the context of a haplotype to increase the level of biological information, so can haplotypes be placed into their evolutionary context to further augment the amount of biological information. Templeton et al. (1987) were the first to propose using haplotypes and their evolutionary trees in phenotype/genotype association studies through nested clade analysis (NCA) in which the branches of the haplotype tree are used to define a nested hierarchy of clades (“branches”) of haplotypes. The fundamental premise of NCA is that any mutation having functional significance will be imbedded in the historical framework defined by the haplotype tree and therefore whole branches (clades) of this tree will show similar functional attributes. Nesting has several advantages. First, nesting categories are determined exclusively by the evolutionary history of the haplotypes without any consideration of phenotypic data, thereby eliminating a source of potential bias in phenotype/genotype association studies. Second, the clades define a nested design that makes full and efficient use of the available degrees of freedom and performs only evolutionarily relevant contrasts. Third, statistical power is enhanced by pooling haplotypes into clades, thereby directly addressing the problem of too much haplotype diversity eroding statistical power by creating sparse data sets.
Despite these advantages, NCA has a serious limitation: the nested design is for haplotypes, not genotypes. This is not a problem when the phenotype is biologically expressed in a haploid or effectively haploid individual at the candidate gene, such as associations between an X-linked candidate gene with a male phenotype, or with homozygous strains, as in the Drosophila example first analyzed by Templeton et al. (1987). However, when dealing with diploid genotypes in natural populations, a single individual will likely bear two distinct haplotypes. The haploid nature of the nested design is not a problem for some types of studies with diploid data. For example, many case control studies test for differences in relative allele frequency between cases and controls. Given that allele frequency is a haploid genetic measure, it is straightforward to extend NCA to case-control studies (Templeton 1995). NCA can also be used in designs based upon the transmission disequilibrium test that uses the gamete types transmitted from parent to offspring for estimating genotype/phenotype associations (Seltman et al. 2001).
Other than these special designs, NCA requires a statistical mapping of diploid phenotypes upon haploid haplotypes when the data include heterozygous diploid genotypes (Templeton et al. 1988). Such a mapping can be executed with the traditional quantitative genetic measurement of average excess (Templeton et al. 1988) or average effect (Hallman et al. 1994). Unfortunately, such a diploid NCA is cumbersome and difficult to implement in many cases. Moreover, average excesses or effects are measures of the marginal phenotypic effects (the “additive genetic” component of phenotypic variance in quantitative genetics) of a haplotype or clade of haplotypes, and the phenotypic variance attributable to dominance effects is ignored.
To circumvent these problems, we propose a new method called tree scanning. Tree scanning partitions the haplotype tree into two or more mutually exclusive and exhaustive clades and then treats each clade as an “allele” in a genotypic analysis of phenotypic associations. A tree scan starts by exhaustively examining all possible biallelic partitions of the haplotype tree created by cutting a branch in the haplotype tree and then grouping together all the haplotypes on one side of the cut into allelic class A and all the haplotypes on the other side of the cut into allelic class B. If a scan over all branches of the haplotype tree detects an allelic partition of the tree whose resulting genotypes explain a significant amount of phenotypic variance, additional rounds of tree scanning within the two significant allelic classes defined by the initial round are used to partition the tree into three or more allelic classes. In analogy with a genome scan that uses marker loci to localize phenotypic associations to physical sections of a chromosome, the tree scan uses the mutations that arose in evolutionary history to localize phenotypic associations to temporal sections of the haplotype tree. Just as adjacent markers in a genome scan yield highly correlated phenotypic associations, so do adjacent branches in a tree scan. Therefore, one expects to see a peak of association that falls off with increasing distance in the haplotype tree, just as genome scans produce peaks of phenotypic association that fall off with increasing physical distance on the chromosome from the responsible variation.
Unlike NCA, tree scanning is straightforward to implement for diploid data and can directly address dominance because it uses the haplotype tree to define a series of standard single-gene phenotype/genotype association tests. Two worked examples are given. The first is the alcohol dehydrogenase (Adh) data from Drosophila (Aquadro et al. 1986) that were previously analyzed with NCA (Templeton et al. 1987). This example allows a direct comparison of NCA with tree scanning. For a second example, we analyze variation at the human autosomal Apoprotein E (APOE) gene for associations with various blood measures of lipid metabolism.
MATERIALS AND METHODS
Population samples:
Aquadro et al. (1986) bred 41 homozygous strains of the fruit fly Drosophila melanogaster that were coisogenic except for a small region around the Adh gene. They surveyed the 41 homozygous strains for restriction site variation at the Adh gene and measured them for alcohol dehydrogenase enzyme activity.
For the APOE study, three human populations were sampled: 702 unrelated African-Americans (483 females and 219 males) from Jackson, Mississippi (J); 337 unrelated individuals (188 females and 149 males) from North Karelia, Finland (N); and 854 unrelated non-Hispanic European-Americans (456 females and 398 males) from Rochester, Minnesota (R). Because we excluded haplotypes found fewer than five times in the combined sample (see below), some individuals were excluded for a total in this study of 470 females and 214 males from the Jackson population, 187 females and 146 males from the North Karelia population, and 449 females and 392 males from the Rochester population. Individuals were genotyped for the APOE SNPs that were found to be segregating in their respective population in the resequencing study of a 5.5-kb section of the APOE gene (Fullerton et al. 2000): 16 SNPs for J, 14 for N, and 13 for R, for a total of 21 distinct SNPs. All individuals were measured for fasting (12 hr for J and R, 4 hr for N) blood levels of total cholesterol (TC), high-density lipoprotein cholesterol (HDL-C), triglycerides (TG), and apolipoprotein E (ApoE).
Haplotype determination:
Haplotypes were directly observable in the homozygous strains of Drosophila. The human haplotypes were inferred from the SNP genotypic data using the program PHASE, version 1 (Stephens et al. 2001), that estimates haplotypes using a Bayesian procedure with a prior based on neutral, coalescent theory. PHASE was applied separately to each of the three samples. A total of 78 haplotypes were inferred for the combined three samples. Recent studies (Adkins 2004) indicate that haplotype inference is accurate for haplotypes with a frequency of ≥1%. Given that our human samples averaged ∼600 individuals, we therefore discarded any haplotypes that were inferred to occur five or fewer times in the combined sample, leaving a total of 39 haplotypes in the combined sample (Table 1).
TABLE 1.
InferredAPOE haplotypes used in this study
| Haplotype no.a |
Nucleotide state at polymorphic SNPs, 5′–3′ |
Inferred no. in sample |
|---|---|---|
| 1 | CCACATGGGCGATTCCTCCAT | 1151 |
| 2 | CCACTTGGGCGATTCCTCCAT | 219 |
| 4 | CCACATTGGCAGTTCCCCCAT | 382 |
| 6 | TCACATGGGCGGTTCCTCCAT | 58 |
| 7 | CCACATGGGCGGTTCCTCCAT | 188 |
| 8 | CCACATGGGCGGTTCCCCCAT | 66 |
| 9 | CCGCATTGGCGGTTCCCCCAT | 10 |
| 10 | TCACACGGGCGGTTCCTTCAT | 5 |
| 11 | CCACATGGGCGATTCCTCCAC | 290 |
| 12 | CCGCTTGGGCGGTTCCCCCAT | 41 |
| 13 | CCACATGGGCGGTTCCTCTAT | 140 |
| 14 | CCGCTTTGGCGGTTCCCCCAT | 89 |
| 15 | TCACATGGGCGGTTCCTTCAT | 29 |
| 16 | CCACATGCGCGGTTCCTCCAT | 23 |
| 17 | CCACTTGGGCGGTTCCCCCCT | 22 |
| 18 | CCACACTGGCAGTTCCCCCAT | 23 |
| 19 | CCACTTGGGCGGTTCCTCTAT | 100 |
| 20 | CCACATTCGCGGTTCCTCCAT | 606 |
| 21 | CCACTTGGGCGGTTCCTCCAT | 12 |
| 22 | CCACATGGGCGGTTCCCCCCT | 97 |
| 23 | CCACTTTCGCGGTTCCTCCAT | 305 |
| 24 | CTACTTGGGCGGTTGCTCCAT | 20 |
| 25 | CCACACGGGCGGTTCCTCTAT | 120 |
| 26 | CCACATGGGCAGTTCCCCCAT | 6 |
| 27 | CCACTTTGGCGGTTCCCCCAT | 65 |
| 28 | CCACATTGGCGGTTCCTCCAT | 20 |
| 33 | CCACACGGGCGGTTCCTCCAT | 6 |
| 37 | CCACACGGGCGATTCCTCCAT | 30 |
| 38 | CCGCTTTGGCGGTTCCTCCAT | 6 |
| 39 | CCACACGGGCGGTTCCCCCAT | 5 |
| 42 | CCACACTCGCGGTTCCTCCAT | 15 |
| 45 | CCACATTCACGGTTCCTCCAT | 7 |
| 46 | CCACACGGGCGATTCCTCCAC | 10 |
| 47 | CCACATTGGCAGTCCCCCCAT | 12 |
| 48 | CCACACTCGTGGTTCCTCCAT | 55 |
| 49 | CCACATTCGCGGGTCCTCCAT | 21 |
| 57 | CCACATTGGCGATTCCTCCAT | 15 |
| 64 | CCACTTTGGCGGTTCCTCTAT | 9 |
| 65 | CCACATTGGCGATTCCTCCAC | 14 |
The haplotype number refers to the number in the original set of 78 inferred haplotypes. Only 39 haplotypes are in this table.
Estimation of haplotype trees:
We use the Adh haplotype tree that Aquadro et al. (1986) estimated through maximum parsimony. A statistical parsimony tree (Templeton et al. 1992) was estimated from the 39 ApoE haplotypes with the program TCS (Clement et al. 2000; available at http://darwin.uvigo.es). TCS does not always give a single best tree, but instead retains all branches that have 95% confidence under a neutral, finite-sites model of DNA evolution, which often results in phylogenetic ambiguity in the haplotype network due to multiple mutational hits at the same site. The estimated tree for APOE had several loops reflecting multiple hits and/or haplotype inference errors. When possible, loops were resolved using the coalescent criteria given by Crandall and Templeton (1993).
Implementation of the tree scan:
Tree scanning is implemented with the program TREESCAN, downloadable from http://darwin.uvigo.es. In the first round of tree scanning, a branch is cut in the haplotype tree. All of the haplotypes on one side of the cut are grouped together and treated as a single allele, say A. All the haplotypes on the other side of the cut are grouped together and treated as a single allele, say B. These two alleles define three potential genotypes: AA, AB, and BB. Associations between phenotypes and these genotypes are measured by the F-statistic from a standard one-way ANOVA. (This analysis assumes continuous phenotypes, the only case considered in this article. For discrete phenotypes, phenotype/genotype associations would be evaluated using a different statistic, such as a contingency chi square.)
The human samples were stratified by population and gender, for a total of six separate analyses of each of the four lipid traits. In all three human samples, the distributions of TG and ApoE were significantly positively skewed in both genders. The natural log (ln) transformation of these variables (ln TG and ln ApoE) reduced skewness to nonsignificant values (P > 0.05) in all cases. Therefore the human traits used in this study are TC, HDL, ln TG, and ln ApoE. All traits within each population and gender were adjusted for age by using the residuals after a linear regression on age.
Because some of the genotypes defined by this procedure may be empty or have few observations, the statistical significance of the resulting F-test statistic is evaluated under the null hypothesis of no phenotype/genotype association by randomly permuting the phenotypic observations across the genotypic categories to generate the null distribution. In the current analyses, 5000 random permutations were used to generate these null distributions.
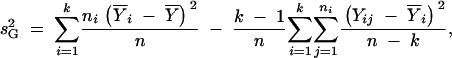
The Boerwinkle and Sing (1986) bias-corrected estimator of genetic variance, s2G, is used to obtain an estimate of the contribution of the genetic model to explaining phenotypic variance that is adjusted for the number of genotypic classes considered in the model
 |
1 |
where n is the total sample size, k is the number of genotypic classes with observations,  is the sample grand mean, ni is the number of individuals in the ith genotypic class, and Yij is the phenotype of the jth individual with genotype i. Equation 1 can be divided by the total phenotypic variance to obtain pvk, an estimate of the proportion of the total phenotypic variance in the population sampled explained by the k genotypes.
The above steps are repeated for each branch of the haplotype tree. Because some partitions result in one of the alleles being extremely rare, we implement tree scanning with the option of skipping the test when the rarer allele has c observations or less. This cuts down on computational time by avoiding those cases that a priori have little chance of yielding a statistically significant result and augments statistical power by reducing the total number of tests when correcting the significance level for multiple tests. For the human data, we set c = 5. For the Adh data set we performed all tests regardless of sample sizes. This was done so that the tree-scanning results would be comparable to those of the original NCA upon Adh (Templeton et al. 1987) in which no contrasts were excluded. After performing the above analyses upon each branch in the tree (or the subset not culled if c > 1), the significance levels of the permutation tests are adjusted for multiple testing through the step-down, stepwise, resampling method of Westfall and Young (1993) with enforced monotonicity that incorporates correlation structure. Details are in the TREESCAN documentation available at http://darwin.uvigo.es.
The highly correlated nature of the haplotype categories defined by cutting adjacent branches can sometimes result in multiple significant test results being clustered in the haplotype tree. We identify all sets of branches such that each branch in the set has a significant pvk (P-values ≤ 0.05) and is adjacent in the tree to one or more other branches in the same set. For each set we identify the branch associated with the highest, statistically significant value of pvk and call it the peak branch for its set. The peak branch for each set is regarded as cut in the second round of the tree scan, which therefore begins with the haplotypes already clustered into two or more alleles.
The second round of tree scanning subdivides one of the alleles from the first-round scan into two alleles. For example, if the first round of tree scanning cut a single branch to create two allelic categories, say A and B, then the second round of tree scanning subdivides either the A allele into two alleles, say A′ and A″, or the B allele into B′ and B″, thereby converting the first-round two-allele system into a three-allele system. Once again, the association between phenotypes and genotypes is measured by an F-statistic from a one-way ANOVA. However, the testing procedure is now altered to reflect the conditional nature of the inference. For example, suppose the first round subdivided the tree into two alleles, A and B, and a second-round cut is made within the A allele to form three alleles, A′, A″, and B. The test results should focus exclusively upon the variation associated with the A′ and A″ alleles (the new alleles created by the second round of tree scanning) because the B allele is regarded as given. These three alleles define six possible genotypes: A′A′, A′A″, A″A″, A′B, A″B, and BB. The BB genotype bears none of the second-round alleles, and it has already been inferred to have significant phenotypic differences from some or all of those genotypes with A category alleles. Hence, individuals who are BB are completely excluded from the second-round permutation procedure. The remaining five genotypes are subdivided into two categories, those that have only A class alleles (A′A′, A′A″, and A″A″), and those that have one A class allele and one B allele (A′B and A″B). To fix the effect of the B allele so that it can make no contribution to the significance of the F-statistic, phenotypes are permutated only within the two genotypic categories of having two A class alleles or of having one A class allele and one B allele. By excluding BB and restricting the permutations within genotypic classes with the same number of B alleles (either 0 or 1), the significance of our second-round F-statistics depends exclusively upon the phenotypic differences associated with the A′ and A″ alleles. Similar considerations hold in the second-round cut in the B class to create B′ and B″ alleles or when there are multiple first-round allelic categories.
After the statistical significance of the second-round cuts has been determined, the correction for multiple comparisons is applied separately to the branches cut within the A allele and to branches cut within the B allele. This reflects the conditional nature of the second round of the tree scan in which we consider the two distinct biological hypotheses of heterogeneity within A and of heterogeneity within B. Accordingly all corrections for multiple testing are stratified within A and B. As before, peaks are identified by pvk.
Further rounds are possible, but we found no additional phenotypic signals after two rounds in either of the two data sets analyzed. Another extension is to cut certain branches on the basis of prior information and then cut an additional branch to search for significant phenotypic associations in addition to that associated with the branches cut on the basis of prior information. For example, two polymorphic coding sites (at positions 3937 and 4075) that jointly determine the three common protein electrophoretic alleles ε2, ε3, and ε4 at the APOE locus have been associated with many phenotypic effects related to blood lipids and coronary artery disease in previous studies (Sing and Davignon 1985; Boerwinkle et al. 1991; Kaprio et al. 1991; Stengård et al. 1995, 1996). Accordingly, an analysis was implemented for APOE using the program MacAnova 4.13 (Bingham and Oehlert 2003) in which the two branches associated with these two positions are cut a priori and a third branch is then cut to search for heterogeneity within the traditional electrophoretic allele classes.
Single SNP analysis:
To compare the results of tree scanning to the more typical analysis in which each SNP is tested one-by-one for phenotypic associations, a statistical analysis for phenotypic heterogeneity was performed upon the genotypes defined by each SNP (all were biallelic) using the same F-statistics, permutational testing procedure, correction for the number of genotypic categories (Equation 1), and method for correcting for multiple tests that were used in the tree scan.
RESULTS
Adh in Drosophila:
Figure 1 shows the Adh haplotype tree and the nested design used by Templeton et al. (1987). The NCA of the activity of the enzyme alcohol dehydrogenase (Adh) identified four branches with statistically significant associations (P < 0.05) using a standard, parametric nested analysis of variance (Templeton et al. 1987), as indicated by asterisks in Figure 1.
Figure 1.—

The nested clade analysis of the Adh haplotype tree with the phenotype of Alcohol dehydrogenase activity in Drosophila melanogaster. Haplotypes are indicated by the numbers 1–25. Each double-headed arrow corresponds to a single mutational change in this unrooted tree. A 0 indicates an intermediate haplotype state not found in the current sample but inferred through maximum parsimony. Haplotypes are nested together into one-step clades, indicated by 1-. One-step clades are then nested into two-step clades, indicated by 2-, which in turn are nested into the three step clades, 3-1 and 3-2. A nested analysis of variance without correction for multiple testing detected statistically significant phenotypic transitions on four branches, as indicated by asterisks (Templeton et al. 1987). A nonparametric permutation test detected three significant phenotypic transitions, as indicated by the circled asterisks, but without correction for multiple testing (Templeton et al. 1988).
Table 2 gives the initial results of the tree-scan tests for association between the phenotype of Adh activity and the Adh haplotype tree based upon 5000 permutations. Figure 2 shows these same results graphically. The partition that splits the tree between haplotypes 1 and 15 explains 81% of the variance of Adh activity and is the only peak. The 1–15 branch is therefore cut to form two allelic classes, A (haplotypes 1–14) and B (haplotypes 15–25). The results of the second round are given in Table 3 and shown in Figure 3. Eighty-four percent of the phenotypic variance was explained by the 0-8 split within A when coupled with the first-round 1-15 split.
TABLE 2.
Initial tree scan of theAdh haplotype tree for the phenotype of Adh activity
| Branch | F-statistic | pvk | Probability | Corrected probability |
|---|---|---|---|---|
| 1–15 | 176.09 | 0.81 | 0.0000 | 0.0000 |
| 1–2 | 124.57 | 0.75 | 0.0000 | 0.0000 |
| 2–3 | 66.68 | 0.62 | 0.0000 | 0.0000 |
| 15–22 | 16.14 | 0.27 | 0.0002 | 0.0010 |
| 22–24 | 6.84 | 0.12 | 0.0106 | 0.0994 |
| 15–20 | 6.54 | 0.12 | 0.0050 | 0.1026 |
| 3–13 | 5.28 | 0.09 | 0.0244 | 0.1796 |
| 13–14 | 4.74 | 0.08 | 0.0290 | 0.2120 |
| 20–21 | 4.68 | 0.08 | 0.0086 | 0.2900 |
Branches are indicated by the two haplotypes they interconnect. The probability of the F-statistic under the null hypothesis of no phenotypic differences across genotypes is evaluated through random permutation testing, and these probabilities are then corrected for multiple comparisons. Only branches that are significant at the P ≤ 0.05 level, with or without correction, are reported.
Figure 2.—

The results of the first round of tree scanning on the Adh haplotype tree for the phenotype of Adh activity. The haplotype tree is the same as shown in Figure 1, but drawn in a different fashion. Double-headed arrows indicate single mutational changes. Dashed vertical lines are used to indicate multiple branches coming off a single node, but the dashed lines themselves do not indicate any mutational change. The pvk values that were statistically significant at the 0.05 level of probability with and without correcting for multiple tests are shown above the branch with which they were associated.
TABLE 3.
Results from the second round of tree scanning theAdhdata set conditioned on the1–15 branch being cut to define two initial alleles,A andB
| Branch | F-statistic | pvk | Probability | Corrected probability |
|---|---|---|---|---|
| Within A 0–8 | 109.59 | 0.84 | 0.0004 | 0.0006 |
| 8–9 | 94.59 | 0.82 | 0.0248 | 0.2740 |
| Within B 17–19 | 136.56 | 0.87 | 0.0388 | 0.1962 |
Only branches that are significant at the P ≤ 0.05 level, with or without correction, are reported.
Figure 3.—

The results of the second round of tree scanning on the Adh haplotype tree for the phenotype of Adh activity conditioned upon cutting the branch between haplotypes 1 and 15 to make two prior allelic classes, A and B. The pvk values in this case show the amount of phenotypic variance explained by cutting the 1–15 branch and a second branch within A or B. The pvk values are shown above the branch cut in addition to the 1–15 branch.
The two branches with significant phenotypic associations in the tree scan are identical to two branches with the strongest statistical signal in the original NCA. The tree-scan analysis is therefore consistent with the nested clade analysis, but appears to have detected fewer associations. However, this appearance may be misleading. The NCA and tree-scan analyses of the Adh haplotype tree differ in three regards: (1) using the haplotype tree to define a nested design vs. using the haplotype tree to define bi- and triallelic genotype contrasts, (2) evaluating the significance through a parametric nested analysis of variance (NANOVA) vs. nonparametric permutation testing, and (3) not adjusting the test statistics for multiple tests vs. such an adjustment. To focus just on the impact of how the haplotype tree was used (difference 1), we need to make the nested clade and tree-scan analyses comparable for the latter two points. Difference 2 (NANOVA vs. permutation testing) has already been addressed for the Adh tree (Templeton et al. 1988). Figure 1 shows that only three significant effects are detected in the NCA using permutational testing, including the two detected by tree scanning. These results are consistent with the well-known fact that nonparametric tests are generally of lower power than appropriate parametric tests. The advantage of the nonparametric test is greater robustness to deviations from the parametric distributional assumptions, including applicability to statistics whose distributional properties are poorly known. Moreover, the nonparametric test is applicable to effectively haploid samples as well as outbred diploid samples, whereas the parametric NANOVA can be applied only to effectively haploid samples.
To adjust for the fact that the NCA with permutational testing did not correct for multiple tests (Templeton et al. 1988), we examine the tree-scan tests without correction for multiple testing. As can be seen from Table 3, the uncorrected P-value for the 17–19 branch in the tree-scan analysis is 0.039, a value slightly below the uncorrected P-value of 0.048 for this branch in the nested clade analysis with permutational testing (Templeton et al. 1988, Table 1). Hence, when comparable statistical tests and criteria are used, the nested clade analysis and the tree-scan analysis of the Adh data set yield identical inferences at similar P-levels.
APOE tree-scan analysis:
Much phylogenetic ambiguity is present in the statistical parsimony tree of the APOE haplotypes, as shown in Figure 4. This ambiguity can be resolved to yield 48 distinct trees, each with 38 branches. We applied tree scanning to all possible resolutions of this tree as a check on the robustness of our inferences to phylogenetic ambiguity. With 48 alternative trees each with 38 branches, there are a total of 48 × 38 = 1824 branches. Because the alternative trees affect only a few allele groupings, the phylogenetic ambiguity shown in Figure 4 adds only 22 additional branches to our analysis of APOE, for a total of 60 branches. Moreover, because not all haplotypes are present in every population sample and many haplotypes or groups of haplotypes have fewer than five observations in a given stratum, the tree scan of any particular sample always involved <60 branches.
Figure 4.—

The estimated haplotype tree for ApoE under statistical parsimony. Haplotypes are designated by the numbers given in Table 1, with 0 indicating intermediate haplotypes not present in the sample. Each double-headed arrow indicates a single-nucleotide change, and the dotted lines show possible alternative branches that are due to phylogenetic ambiguity. The number by each double-headed arrow indicates the DNA position that mutated using the numbers given in Fullerton et al. (2000). Boxes enclose those haplotypes that belong to the three major electrophoretic allele classes: ε2, ε3, and ε4.
Table 4 presents those branches that had statistically significant phenotypic associations (P ≤ 0.05, after adjusting for multiple testing) in each of the six samples defined by geographic location and gender. Many of the significant branches for a particular phenotype in a given population are adjacent on the haplotype tree, so Figure 5 shows only the peak branches from Table 4.
TABLE 4.
Branches with statistically significant (≤0.05) phenotypic associations after correcting for multiple testing from the first round of tree scanning of theAPOEhaplotype tree in six human samples defined by geographical location and gender
| Trait | Sample | Branch | F-statistic | pvk | Corrected probability |
|---|---|---|---|---|---|
| ln ApoE | J female | 7–13 | 35.98 | 0.130 | 0.0000 |
| ln ApoE | J female | 7–8 | 13.28 | 0.050 | 0.0090 |
| ln ApoE | J female | 6–15 | 21.12 | 0.041 | 0.0156 |
| ln ApoE | J male | 7–13 | 16.04 | 0.123 | 0.0000 |
| ln ApoE | J male | 6–15 | 15.14 | 0.062 | 0.0152 |
| ln ApoE | N female | 13–25 | 8.48 | 0.074 | 0.0102 |
| ln ApoE | N female | 7–13 | 8.00 | 0.070 | 0.0160 |
| ln ApoE | N female | 7–8 | 6.35 | 0.054 | 0.0272 |
| ln ApoE | R female | 7–8 | 39.63 | 0.147 | 0.0000 |
| ln ApoE | R female | 7–13 | 24.00 | 0.093 | 0.0000 |
| ln ApoE | R female | 8–26 | 22.02 | 0.086 | 0.0000 |
| ln ApoE | R female | 4–26 | 21.64 | 0.084 | 0.0000 |
| ln ApoE | R female | 8–22 | 12.58 | 0.049 | 0.0062 |
| ln ApoE | R female | 13–19 | 10.40 | 0.040 | 0.0062 |
| ln ApoE | R female | 13–25 | 18.03 | 0.037 | 0.0062 |
| ln ApoE | R male | 7–8 | 26.48 | 0.115 | 0.0000 |
| ln ApoE | R male | 8–26 | 19.99 | 0.088 | 0.0000 |
| ln ApoE | R male | 4–26 | 19.99 | 0.088 | 0.0000 |
| ln ApoE | R male | 7–13 | 10.18 | 0.045 | 0.0050 |
| ln ApoE | R male | 4–18 | 16.02 | 0.037 | 0.0132 |
| TC | J female | 7–13 | 8.96 | 0.033 | 0.0352 |
| TC | J male | 1–2a | 6.64 | 0.050 | 0.0424 |
| TC | R female | 7–13 | 11.76 | 0.046 | 0.0014 |
| TC | R female | 13–19 | 6.06 | 0.022 | 0.0358 |
| HDL-C | R female | 13–19 | 6.71 | 0.025 | 0.0366 |
| ln TG | N female | 20–23 | 8.74 | 0.076 | 0.0148 |
The populations sampled are J, Jackson; N, North Karelia; and R, Rochester.
This branch association was sensitive to the phylogenetic ambiguity in the tree and did not hold up for all possible phylogenetic resolutions.
Figure 5.—

Results of the first round of tree scanning on the ApoE haplotype tree for four lipid phenotypes in three human populations stratified by gender. The tree drawing conventions are the same as those given in Figure 2, but with the addition of dotted lines that show possible alternative branches that are due to phylogenetic ambiguity. Only the peak associations after correction for multiple testing are shown. Above every peak association are letters that indicate the population and gender for which the association was found: JF, Jackson females; JM, Jackson males; NF, North Karelia females; RF, Rochester females; and RM, Rochester males.
To obtain the second round of tree scanning for the APOE tree, all peak branches for a particular trait and population sample identified in the first round of testing (Figure 5) were cut one by one, and then the same trait and population sample were analyzed by an additional cut in the APOE tree conditioned on the first-round peak being cut. Table 5 shows the branches conditioned on the cut branch that had statistically significant associations (P ≤ 0.05) after adjusting for multiple testing in the second round of tree scanning and Figure 6 shows the second-round peaks. The combined analyses over all traits and population samples carried out in the two rounds of tree scanning as summarized in Figures 5 and 6 identified 16 significant peak splits in the APOE tree located on eight distinct branches, 11 of which are associated with ln ApoE, the phenotype most directly related to the function of the candidate gene.
TABLE 5.
Branches with statistically significant (≤0.05) phenotypic associations after correcting for multiple testing from the second round of tree scanning of theApoE haplotype tree in six human populations defined by geographical location and gender
| Trait | Sample | First-round cut branch |
Second-round branch |
F-statistic | pvk | Corrected probability |
|---|---|---|---|---|---|---|
| ln ApoE | J females | 7–13 | 6–15 | 35.90 | 0.182 | 0.0334 |
| ln ApoE | J females | 6–15 | 7–13 | 35.90 | 0.182 | 0.0000 |
| ln ApoE | J females | 6–15 | 7–8 | 14.38 | 0.079 | 0.0170 |
| ln ApoE | J males | 7–13 | 6–15 | 14.40 | 0.200 | 0.0024 |
| ln ApoE | J males | 6–15 | 7–13 | 14.40 | 0.200 | 0.0000 |
| ln ApoE | J males | 6–15 | 7–8 | 8.85 | 0.128 | 0.0122 |
| ln ApoE | N females | 13–25 | 1–7 | 6.31 | 0.124 | 0.0294 |
| ln ApoE | N females | 13–25 | 7–8 | 6.25 | 0.123 | 0.0312 |
| ln ApoE | N females | 13–25 | 20–23 | 7.29 | 0.119 | 0.0424 |
| ln ApoE | R females | 7–8 | 7–13 | 24.24 | 0.206 | 0.0014 |
| ln ApoE | R males | 7–8 | 7–13 | 13.74 | 0.140 | 0.0426 |
The populations sampled are J, Jackson; N, North Karelia; and R, Rochester.
Figure 6.—

Results of the second round of tree scanning on the ApoE haplotype tree for four lipid phenotypes in three human populations stratified by gender. The tree-drawing conventions are the same as those given in Figure 5. Only the peak associations after correction for multiple testing are shown above the branch cut in addition to the conditional cut, which is indicated below the corresponding pvk value. Above every peak association are letters that indicate the population and gender for which the association was found: JF, Jackson females; JM, Jackson males; NF, North Karelia females; RF, Rochester females; and RM, Rochester males.
The tree-scan results are consistent with the prior literature that branches 7–8 (ε3 vs. ε4) and 7–13 (ε3 vs. ε2) should delineate significant phenotypic effects. Ten of the 16 distinct phenotypic associations found by tree scanning include branches 7–8 and/or 7–13 (Tables 4 and 5) and 8 peak associations map to branches 7–8 or 7–13 (Figures 5 and 6). Moreover, the strongest phenotypic effects are associated with these two branches. Even though these two branches are adjacent in the APOE tree (Figure 4), two rounds of tree scanning successfully separated their effects. For example, Figure 5 shows that the first round of tree scanning detected a significant peak association on the 7–8 branch with the phenotype of ln ApoE in both Rochester males and females, our largest sample. The 7–8 branch was therefore cut in the Rochester populations for the second round of tree scanning on the phenotype of ln ApoE. As can be seen in Figure 6, a second peak association was mapped in the second round of tree scanning to the 7–13 branch in both genders.
Besides the 7–8 and 7–13 branches that define the traditional protein electrophoretic alleles at the APOE gene, the only other branch that shows replication in its phenotypic associations in the tree scan is the 6–15 branch for the phenotype of ln ApoE in Jackson males and females (Figures 5 and 6). This branch is absent in the other two populations, so replication across populations cannot be tested. Interestingly, the 6–15 branch is defined by an amino acid coding change at site 4036 in the APOE DNA sequence. Only 4 of the 21 SNPs scored in this study involve coding sequence, yet 10 of the 16 peaks map to three branches defined by amino acid coding SNPs. Hence, all three of these amino acid changes appear to be important in the Jackson population in influencing the level of ln ApoE. These results suggest that the ε3 allelic class has internal phenotypic heterogeneity in the Jackson sample and should be subdivided into two alleles by the state of this third polymorphic amino acid coding position.
Of the remaining six phenotypic peaks, four are detected in North Karelia females on three branches (branch 13–25 for ln ApoE, branch 20–23 for ln TG and ln ApoE, and branch 1–7 for ln ApoE). All three of these branches are found in all population samples, so the lack of replicability across populations is not simply due to the absence of the appropriate genetic variants. One of these associations from the first round of tree scanning is with the phenotype of ln ApoE and maps to a branch adjacent to the 7–13 branch, which is also statistically significant (Table 4). In this case, the peak defined by the pvk values is not very pronounced, going from 7.4% for the 13–25 branch to 7.0% for the 7–13 branch. It is therefore possible that the true phenotypic association in this case is actually due to the 7–13 branch and that tree scanning assigned the association to an adjacent branch due to stochastic fluctuations arising from the shallowness of the peak. However, the remaining three associations in North Karelia females do not include any of the branches associated with amino acid changes in the statistically significant set (Tables 4 and 5), so North Karelia females remain an outlier in the tree-scan analysis. The North Karelia sample is also atypical because it has one of the highest incidences of coronary artery disease known from studies of human populations throughout the world (Tunstall-Pedoe et al. 1994).
Only one detected association is sensitive to the ambiguity of the tree topology (the 1–2 branch in Figure 5). When haplotype 21 connects directly to haplotype 2, we detect a significant association with the phenotype of total cholesterol on the 1–2 branch in Jackson males, but when haplotype 21 connects to haplotype 7, no significant association is detected. Until this evolutionary ambiguity can be resolved (which in turn may be due to an error in an inferred haplotype), we would regard such phylogenetically sensitive inferences as tentative.
APOE tree-scan analysis using prior knowledge:
Table 6 shows those branches with significant phenotypic associations given that the 7–8 and 7–13 branches of the APOE haplotype tree were cut on the basis of prior information that the traditional ε2, ε3, and ε4 allelic classes have strong phenotypic associations. Two new associations emerge with the addition of this prior information (Table 6) beyond that already shown in Figures 5 and 6: a significant effect on HDL-C in North Karelia females that is evenly distributed across three adjoining branches within the ε4 portion of the haplotype tree and a significant effect on ln TG in Rochester males localized to branch 4–18, also within the ε4 portion of the haplotype tree. The results shown in Table 6 along with the original tree-scan results in Tables 4 and 5 indicate that there is significant functional heterogeneity within all three of the traditional electrophoretic allelic classes at the APOE gene.
TABLE 6.
Branches with statistically significant (≤0.05) phenotypic associations after correcting for multiple testing conditioned upon the prior cutting of the7–8 and7–13 branches of theApoE haplotype tree in six human samples defined by geographical location and gender
| Branches with significant effects for the phenotype of
|
||||
|---|---|---|---|---|
| Sample | ln TG | TC | HDL-C | ln ApoE |
| J females | 6–15 (4036) | |||
| J males | 1–2a (560) | 6–15 (4036) | ||
| N females | 20–23 (560) | 8–22 (4951):8–26 (1998):4–26a (832) |
13–19 (560):13–25 (624) 20–23 (560) |
|
| N males R females R males |
4–18 (624) | |||
The populations sampled are J, Jackson; N, North Karelia; and R, Rochester. Branches are indicated by the haplotypes they connect, and the SNP number associated with the branch is indicated in parentheses. Sets of branches that are contiguous in the tree are separated by a colon whereas noncontiguous sets appear on separate lines
This set of branch associations was sensitive to the phylogenetic ambiguity in the tree and did not hold up for all possible phylogenetic resolutions.
APOE single SNP analysis:
Table 7 shows the results of the single SNP analysis. A total of 22 significant associations were discovered after correction for multiple testing. Eighteen of these SNP associations correspond to the mutations that define branches with significant associations in the tree scan for the corresponding trait, population, and gender. Four SNP associations have no corresponding significant branch in the tree-scan analysis, and 10 branch associations have no corresponding significant SNP association. Therefore, although the two analyses yield largely concordant inferences, the tree scan detected more associations overall than the single SNP analysis.
TABLE 7.
SNPs with statistically significant (≤0.05) phenotypic associations after correcting for multiple testing in six human samples defined by geographical location and gender
| SNPs with significant effects for
|
||||
|---|---|---|---|---|
| Sample | ln TG | TC | HDL-C | ln ApoE |
| J females | 4075 | 3937, 4036, 4075 | ||
| J males | 3937, 4036, 4075 | |||
| N females | 832, 3937, 4075 | |||
| N males | 624 | |||
| R females | 4075 | 624, 1998, 3937, 4075, 4951 |
||
| R males | 832, 1998, 3937, 4075, 4951 |
|||
The populations sampled are J, Jackson; N, North Karelia; and R, Rochester. SNPs are indicated by the DNA position numbers given in Fullerton et al. (2000).
DISCUSSION
The analysis of the Drosophila ADH tree allows a direct comparison between the nested clade analysis and tree scanning. When comparable statistical tests and criteria are used, the nested clade analysis and the tree-scan analysis of the Adh data set yield identical inferences at similar P-levels. Hence, these two different methods use the evolutionary historical information in the haplotype tree in a similar fashion. In contrast, a standard parametric analysis of variance (ANOVA) on these data that makes no use of the Adh haplotype tree detects only the phenotypic effects associated with the 1–15 branch (Templeton et al. 1987, 1988) even with no correction for multiple tests. Both nested clade analysis and tree scanning detected additional allelic categories with distinct phenotypic associations that are invisible to the standard ANOVA (Templeton et al. 1987, Table 1). Thus, placing haplotypes into their evolutionary context clearly augments our ability to detect current genotype/phenotype associations in this example.
The APOE analysis identified the associations expected from the prior literature as well as several additional associations. Of 16 different peak inferences, only one was sensitive to the ambiguity reflected by the 48 distinct haplotype trees under statistical parsimony. The existence of even this one phylogenetically sensitive inference illustrates the importance of estimating haplotype trees with an algorithm such as TCS, which yields a 95% confidence set of phylogenetic connections rather than just a single best tree. In a fully resolved tree of n haplotypes, there will be n − 1 branches. In the case of APOE, we had 39 haplotypes, so a fully resolved tree would require scanning 38 branches. However, because of ambiguities in tree topology and/or haplotype inference, we had to consider alternative resolutions, causing us to consider a total of 60 possible branches. The number of tests performed has a direct impact on the statistical power to detect phenotypic associations when the correction for multiple tests is executed. Hence, if the APOE tree were more resolved, our statistical power would increase. Nevertheless, the APOE results clearly show that tree scanning can and does work even when there is much ambiguity in the tree topology.
The problem of phylogenetic/haplotype ambiguity can be completely avoided by testing for associations with the SNPs directly. This has the advantage of directly increasing power by reducing the number of tests. There are only 21 SNPs, but there are 38 branches in a fully resolved tree and 60 branches in the set of probable trees. If tree scanning is to have an advantage over SNP analyses, it must tap into sufficient additional biological information that more than compensates for this penalty in statistical power when correcting for multiple tests. As can be seen by contrasting Tables 4 and 5 vs. 7, more traits had significant associations in more populations with tree scanning than with multiple single SNP analyses. Obviously, there is biological information in the haplotypes and their evolutionary relationships that more than compensates for the need of additional testing.
The results for Jackson females reveal an additional benefit of tree scanning over single SNP analyses. The single SNP analyses find a significant association of ln ApoE with SNPs 3937, 4036, and 4075 (Table 7); the tree scan finds the phenotype of ln ApoE is significantly associated with branches 7–8 (defined by SNP 3937), 6–15 (defined by SNP 4036), and 7–13 (defined by SNP 4075) (Tables 4 and 5). Although the results seem to be identical, they are not. The three SNPs associated with ln ApoE variation in the single SNP analyses are tightly linked in a small portion of the APOE gene spanning just 138 bp. An investigator obtaining these results would be faced with the conundrum of whether or not these three statistically significant signals were three biologically independent signals or just one signal confounded by tight linkage. The results of the single SNP analyses per se yield no insight into how to resolve this conundrum. In contrast, the tree-scan analysis makes it clear on the first round (and confirmed by the second round) that these three significant sites map onto two biologically distinct impacts on the phenotype of ln ApoE; one peak is associated with branch 7–13 (SNP 4075) and a second, distinct peak is associated with branch 6–15 (SNP 4036). Similar situations occur in Jackson males and in Rochester females and males for ln ApoE. In all of these cases, SNP analyses find multiple SNPs showing linkage disequilibrium that are associated with variation in ln ApoE. Tree scanning identifies the branches associated with these same SNPs, but then localizes these effects on ln ApoE to a smaller number of branches and identifies distinct associations. In general, when dealing with small DNA regions characterized by much internal linkage disequilibrium, the results of multiple single SNP analyses are difficult to interpret biologically. By utilizing the structure of the haplotype tree (one of the major determinants of the pattern of linkage disequilibrium in the DNA region), tree scanning makes use of the internal linkage disequilibrium and identifies subsets of the statistically significant associations that represent biologically distinct phenotypic associations. This is a tremendous advantage of tree scanning (and nested clade analysis) over single SNP analyses.
Another advantage of tree scanning is how it deals with homoplasy. Homoplasy occurs when the same mutational transition occurs more than once in the evolutionary history of the gene region. Homoplasy is a common phenomenon, found in almost all human haplotype trees, including the APOE tree. The commonness of multiple mutational hits at the same nucleotide site is to be expected because the mutagenic process is highly nonrandom in humans, resulting in mutational hotspots (Templeton et al. 2000). The impact of homoplasy upon the relative merits of tree scanning vs. SNP analyses depends upon whether or not the nucleotide site showing multiple mutational hits is also a functional site. In most cases, a SNP will be a marker rather than a directly functional mutation, and in this case tree scanning has a great advantage over multiple single SNP analyses because the tree itself adjusts for homoplasy. For example, tree scanning found significant associations of ln TG and ln ApoE with branch 20–23 in the North Karelia females and of HDL C with branch 13–19 in Rochester females, all defined by mutations at site 560. The single SNP analysis of site 560 found none of these associations, despite its a priori advantage in statistical power when correcting for multiple testing. Site 560 shows much homoplasy, having mutated a minimum of four times in the APOE tree. Thus, when one pools together all the copies of this gene with A at site 560 into one allele and all the copies with T at this site into a second allele, one is actually pooling together into a single allele the products of two or more distinct mutations. In population genetics parlance, these alleles are identical-by-state but not identical-by-descent. If the site being used to define such alleles is not functional per se, the signal of functionality due to linkage disequilibrium with another site is weakened by pooling sequences that are not identical-by-descent. In contrast, tree scanning considers every detected mutation at this site separately, so if only one of the multiple mutational events is in strong linkage disequilibrium with a functional marker, its signal of phenotypic association is not diluted by pooling it with the other homoplasious mutational events. Thus, tree scanning can detect an association with a branch associated with a homoplasious marker site that is invisible to single SNP association studies.
This advantage of tree scanning in dealing with homoplasy is lost when the nucleotide site showing homoplasy is also the functional site. Note that the single SNP analysis detected a significant association of site 832 with the phenotype of ln ApoE in North Karelia females and Rochester males, but none of the branches associated with a significant impact on ln ApoE in the tree scan are marked by this SNP. Site 832 also shows much homoplasy, mutating at least six times in the APOE haplotype tree. However, unlike site 560, there is evidence that site 832 codes for a functional variation. This site is in the promotor region of the APOE gene, and lower levels of the ApoE protein are associated with the T nucleotide state at this SNP as compared to the G state, an effect that may be attributable to differential binding of nuclear proteins involved with cis-acting transcriptional regulation (Artiga et al. 1998). If the functional effect of a homoplasious SNP does not depend greatly upon the context defined by other SNPs, the single SNP analysis will have greater sensitivity than the tree scan because the tree scan splits up the sample into many separate allelic categories. To test the functionality of homoplasious sites, we recommend that each homoplasious SNP (identifiable from the haplotype tree) also be subjected to a single-site analysis for phenotypic association. A discrepancy in which the single SNP analysis finds a phenotypic association and the tree scan does not would suggest that the homoplasious site itself might have functional significance. Instead of such a discrepancy being a problem, tree scanning coupled with single homoplasious site analyses enables us to make more powerful biological inference and leads to avenues of investigation that would not otherwise be known. In this case, tree scanning can suggest functional hypotheses for individual sites, as it does in the case of site 832.
Another advantage of tree scanning is that it is easy to incorporate prior information. As mentioned above, there is much prior information that sites 3937 and 4075 are functionally important. When we incorporated this prior information, thereby starting with a three-allele system (corresponding to the traditional ε2, ε3, and ε4 alleles), tree scanning detected two additional peak associations (Table 6) and showed that there is functional heterogeneity within each of the traditional electrophoretic alleles. The fact that additional associations were found in this analysis indicates that prior knowledge can augment the power of the tree scan.
We can also use Table 6 to compare tree scanning with the work of Stengård et al. (2002) on the same data set analyzed in this article. Stengård et al. (2002) also accepted the ε2, ε3, and ε4 allelic classes as functionally significant on the basis of prior knowledge and looked for heterogeneity within these three allelic classes by asking if adding on a third SNP in addition to SNPs 3937 and 4075 (the two that define the ε2, ε3, and ε4 alleles) would significantly improve the explanation of phenotypic variance. Thus, contrasting their results with the results given in Table 6 provides a direct comparison of the strategies of adding a third SNP vs. cutting a third branch in the prior allelic classes. Stengård et al. (2002) found five cases in which a third SNP did indeed result in significant improvement in explaining phenotypic variance, and three of these are also found by tree scanning (the ones found in Jackson females and males in Table 6). However, Stengård et al. (2002) did not correct for multiple tests, so to make the analyses more comparable, we must look at the uncorrected P-values in the tree. Using uncorrected P-values, the same SNPs identified as significant by Stengård et al. (2002) are also identified by tree scanning with similar levels of uncorrected significance with the exception of SNP 1575 in North Karelia males for ln ApoE. Because we excluded some of the data as described in materials and methods, there were no observations to test the branch associated with SNP 1575 (branch 42–48) in the tree-scan analysis. Thus, tree scanning detected all of the effects found by Stengård et al. (2002) that were possible to test. The main difference between tree scanning and adding a third SNP is that tree scanning detected five additional branches with significant phenotypic associations even with correction for multiple testing (Table 6). These five associations were actually stronger than the two detected by Stengård et al. (2002) that were not significant after correction for multiple testing in the tree scan. The reason these stronger associations were not detected by Stengård et al. (2002) is due in all cases to homoplasy: the highly homoplasious SNPs 560, 624, and 832 define these additional branches. Overall, the tree scan detected the same effects as that by adding a third SNP in the analysis of Stengård et al. (2002), but found additional and stronger phenotypic associations with branches defined by homoplasious SNPs than with those found just by adding a third SNP.
The examples analyzed in this article show that tree scanning has much promise as a tool for discovering phenotypic associations with genetic variation in candidate genes. The Adh example indicates that tree scanning is comparable to nested clade analyses using permutation testing. The concordance of the results also indicates that both methods extract comparable information from the haplotype tree. When standard NANOVA is not an option, tree scanning has many advantages over nested clade analysis: it is simple to implement; it allows an evaluation of all the phenotypic effects associated with genotypes, including dominance and recessiveness; it is simple to accommodate phylogenetic ambiguity in the tree; and it is easy to incorporate prior information about functional variation. The APOE example reveals that tree scanning yields results that are concordant with prior information about allele classes with functional significance, indicating that the tree-scan inferences have biological validity in this case. Tree scanning found more phenotypic associations than single SNP analyses and other alternatives did, particularly at sites that have experienced multiple mutational hits. This is an important property of tree scanning because SNPs associated with mutagenic sites are extremely common in some candidate regions (Templeton et al. 2000). Finally, tree scanning provides clearer biological interpretations than single SNP analyses do, such as the ability to identify biologically distinct associations within a highly correlated data set.
Acknowledgments
We thank Deborah Nickerson for genotyping the APOE SNPs and Gary W. Oehlert and Christopher Bingham for the help in using the MacAnova program. We thank the following employees of Variagenics for their valuable input into the general problem of phenotype/genotype associations and into the development of the tree-scanning program: Vincent Stanton, Jr., Daniel Chasman, Lakshman Subrahmanyan, and Carsten Wiuf. We thank Anthony Brown and three anonymous reviewers for their suggestions on an earlier draft of this article. We gratefully acknowledge support from the Burroughs Wellcome Fund Innovation Award in Functional Genomics (100133); a National Science Foundation predoctoral fellowship award to Taylor Maxwell; and the National Institutes of Health grants HL39107, HL58240, HL072905 and GM65509.
References
- Adkins, R., 2004. Comparison of the accuracy of methods of computational haplotype inference using a large empirical dataset. BMC Genet. 5: 22. [DOI] [PMC free article] [PubMed] [Google Scholar]
- Aquadro, C. F., S. F. Desse, M. M. Bland, C. H. Langley and C. C. Laurie-Ahlberg, 1986. Molecular population genetics of the Alcohol dehydrogenase gene region of Drosophila melanogaster. Genetics 114: 1165–1190. [DOI] [PMC free article] [PubMed] [Google Scholar]
- Artiga, M. J., M. J. Bullido, I. Sastre, M. Recuero, M. A. Garcia et al., 1998. Allelic polymorphisms in the transcriptional regulatory region of the apolipoprotein E gene. FEBS Lett. 421: 105–108. [DOI] [PubMed] [Google Scholar]
- Balciuniene, J., L. Emilsson, L. Oreland, U. Pettersson and E. E. Jazin, 2002. Investigation of the functional effect of monoamine oxidase polymorphisms in human brain. Hum. Genet. 110: 1–7. [DOI] [PubMed] [Google Scholar]
- Bingham, C., and G. W. Oehlert, 2003 MacAnova Reference Manual, Version 4.13, Technical Report No. 618. School of Statistics, University of Minnesota, Minneapolis.
- Boerwinkle, E., and C. F. Sing, 1986. Bias of the contribution of single locus effects to the variance of a quantitative trait. Am. J. Hum. Genet. 39: 137–144. [PMC free article] [PubMed] [Google Scholar]
- Boerwinkle, E., S. A. Brown, K. Rohrbach, J. A. M. Gotto and W. Patsch, 1991. Role of apolipoprotein E and B gene variation in determining response of lipid, lipoprotein, and apolipoprotein levels to increased dietary cholesterol. Am. J. Hum. Genet. 49: 1145–1154. [PMC free article] [PubMed] [Google Scholar]
- Clement, M., D. Posada and K. Crandall, 2000. TCS: a computer program to estimate gene genealogies. Mol. Ecol. 9: 1657–1659. [DOI] [PubMed] [Google Scholar]
- Crandall, K. A., and A. R. Templeton, 1993. Empirical tests of some predictions from coalescent theory with applications to intraspecific phylogeny reconstruction. Genetics 134: 959–969. [DOI] [PMC free article] [PubMed] [Google Scholar]
- Drysdale, C. M., D. W. McGraw, C. B. Stack, J. C. Stephens, R. S. Judson et al., 2000. Complex promoter and coding region beta 2-adrenergic receptor haplotypes alter receptor expression and predict in vivo responsiveness. Proc. Natl. Acad. Sci. USA 97: 10483–10488. [DOI] [PMC free article] [PubMed] [Google Scholar]
- Fullerton, S. M., A. G. Clark, K. M. Weiss, D. A. Nickerson, S. L. Taylor et al., 2000. Apolipoprotein E variation at the sequence haplotype level: implications for the origin and maintenance of a major human polymorphism. Am. J. Hum. Genet. 67: 881–900. [DOI] [PMC free article] [PubMed] [Google Scholar]
- Hallman, D. M., S. Visvikis, J. Steinmetz and E. Boerwinkle, 1994. The effect of variation in the apolipoprotein B gene on plasmid lipid and apolipoprotein B levels. I. A likelihood-based approach to cladistic analysis. Ann. Hum. Genet. 58: 35–64. [DOI] [PubMed] [Google Scholar]
- Jeffreys, A., L. Kauppi and R. Neummann, 2001. Intensely punctate meiotic recombination in the class II region of the major histocompatibilty complex. Nat. Genet. 29: 217–222. [DOI] [PubMed] [Google Scholar]
- Kaprio, J., R. E. Ferrell, B. A. Kottke, M. I. Kamboh and C. F. Sing, 1991. Effects of polymorphisms in apolipoproteins E, A-IV, and H on quantitative traits related to risk for cardiovascular disease. Arterioscler. Thromb. 11: 1330–1348. [DOI] [PubMed] [Google Scholar]
- Knoblauch, H., A. Bauerfeind, C. Krahenbuhl, A. Daury, K. Rohde et al., 2002. Common haplotypes in five genes influence genetic variance of LDL and HDL cholesterol in the general population. Hum. Mol. Genet. 11: 1477–1485. [DOI] [PubMed] [Google Scholar]
- Martin, E. R., E. H. Lai, J. R. Gilbert, A. R. Rogala, A. J. Afshari et al., 2000. SNPing away at complex diseases: analysis of single-nucleotide polymorphisms around APOE in Alzheimer disease. Am. J. Hum. Genet. 67: 383–394. [DOI] [PMC free article] [PubMed] [Google Scholar]
- Reich, D. E., S. F. Schaffner, M. J. Daly, G. McVean, J. C. Mullikin et al., 2002. Human genome sequence variation and the influence of gene history, mutation and recombination. Nat. Genet. 32: 135–142. [DOI] [PubMed] [Google Scholar]
- Seltman, H., K. Roeder and B. Devlin, 2001. Transmission/disequilibrium test meets measured haplotype analysis: family-based association analysis guided by evolution of haplotypes. Am. J. Hum. Genet. 68: 1250–1263. [DOI] [PMC free article] [PubMed] [Google Scholar]
- Sing, C. F., and J. Davignon, 1985. Role of the Apolipoprotein E polymorphism in determining normal plasma lipid and lipoprotein variation. Am. J. Hum. Genet. 37: 268–285. [PMC free article] [PubMed] [Google Scholar]
- Stengård, J. H., K. E. Zerba, J. Pekkanen, C. Ehnholm, A. Nissinen et al., 1995. Apolipoprotein E polymorphism predicts death from coronary heart disease in a longitudinal study of elderly Finnish men. Circulation 91: 265–269. [DOI] [PubMed] [Google Scholar]
- Stengård, J. H., J. Pekkanen, C. Ehnholm, A. Nissinen and C. F. Sing, 1996. Genotypes with the Apolipoprotein Epsilon-4 allele are predictors of coronary heart disease mortality in a longitudinal study of elderly Finnish men. Hum. Genet. 97: 677–684. [DOI] [PubMed] [Google Scholar]
- Stengård, J. H., A. G. Clark, K. M. Weiss, S. Kardia, D. A. Nickerson et al., 2002. Contributions of 18 additional DNA sequence variations in the gene encoding Apoliprotein E to explaining variation in quantitative measures of lipid metabolism. Am. J. Hum. Genet. 71: 501–517. [DOI] [PMC free article] [PubMed] [Google Scholar]
- Stephens, M., N. J. Smith and P. Donnelly, 2001. A new statistical method for haplotype reconstruction from population data. Am. J. Hum. Genet. 68: 978–989. [DOI] [PMC free article] [PubMed] [Google Scholar]
- Templeton, A. R., 1995. A cladistic analysis of phenotypic associations with haplotypes inferred from restriction endonuclease mapping or DNA sequencing. V. Analysis of case/control sampling designs: Alzheimer's disease and the Apoprotein E locus. Genetics 140: 403–409. [DOI] [PMC free article] [PubMed] [Google Scholar]
- Templeton, A. R., E. Boerwinkle and C. F. Sing, 1987. A cladistic analysis of phenotypic associations with haplotypes inferred from restriction endonuclease mapping. I. Basic theory and an analysis of alcohol dehydrogenase activity in Drosophila. Genetics 117: 343–351. [DOI] [PMC free article] [PubMed] [Google Scholar]
- Templeton, A. R., C. F. Sing, A. Kessling and S. Humphries, 1988. A cladistic analysis of phenotypic associations with haplotypes inferred from restriction endonuclease mapping. II. The analysis of natural populations. Genetics 120: 1145–1154. [DOI] [PMC free article] [PubMed] [Google Scholar]
- Templeton, A. R., K. A. Crandall and C. F. Sing, 1992. A cladistic analysis of phenotypic associations with haplotypes inferred from restriction endonuclease mapping and DNA sequence data. III. Cladogram estimation. Genetics 132: 619–633. [DOI] [PMC free article] [PubMed] [Google Scholar]
- Templeton, A. R., A. G. Clark, K. M. Weiss, D. A. Nickerson, E. Boerwinkle et al., 2000. Recombinational and mutational hotspots within the human Lipoprotein Lipase gene. Am. J. Hum. Genet. 66: 69–83. [DOI] [PMC free article] [PubMed] [Google Scholar]
- Tunstall-Pedoe, H., K. Kuulasmaa, P. Amouyel, D. Arveiler, A. Rajakangas et al., 1994. Myocardial infarction and coronary deaths in the World Health Organization MONICA Project. Registration procedures, event rates, and case-fatality rates in 38 populations from 21 countries in four continents. Circulation 90: 583–612. [DOI] [PubMed] [Google Scholar]
- Van Eerdewegh, P., R. D. Little, J. Dupuis, R. G. D. Mastro, K. Falls et al., 2002. Association of the ADAM33 gene with asthma and bronchial hyperresponsiveness. Nature 418: 426–430. [DOI] [PubMed] [Google Scholar]
- Westfall, P. H., and S. S. Young, 1993 Resampling-Based Multiple Testing. John Wiley & Sons, New York.
- Zaykin, D. V., P. H. Westfall, S. S. Young, M. A. Karnoub, M. J. Wagner et al., 2002. Testing association of statistically inferred haplotypes with discrete and continuous traits in samples of unrelated individuals. Hum. Hered. 53: 79–91. [DOI] [PubMed] [Google Scholar]