

Abstract
The shared ancestry of mouse inbred strains, together with the availability of sequence and phenotype information, is a resource that can be used to map quantitative trait loci (QTL). The difficulty in using only sequence information lies in the fact that in most instances the allelic state of the QTL cannot be unambiguously determined in a given strain. To overcome this difficulty, the performance of multiple crosses between various inbred strains has been proposed. Here we suggest and evaluate a general approach, which consists of crossing the two strains used initially to map the QTL and any new strain. We have termed these crosses “yin-yang,” because they are complementary in nature as shown by the fact that the QTL will necessarily segregate in only one of the crosses. We used the publicly available SNP database of chromosome 16 to evaluate the mapping resolution achievable through this approach. Although on average the improvement of mapping resolution using only four inbred strains was relatively small (i.e., reduction of the QTL-containing interval by half at most), we found a great degree of variability among different regions of chromosome 16 with regard to mapping resolution. This suggests that with a large number of strains in hand, selecting a small number of strains may provide a significant contribution to the fine mapping of QTL.
MOUSE-breeding strategies have led to the successful mapping of many QTL to a defined chromosomal region (Glazier et al. 2002; Korstanje and Paigen 2002). The challenge and promise, however, lie in identifying the actual genes and polymorphisms. Two major elements affect the ability to fine map QTL: the proportion of the phenotypic variance explained by the QTL and the extent of recombination around the QTL (Mackay 2001). Several strategies have been suggested for QTL fine mapping. These include relying on recombinations distributed throughout the genome, using such methods as heterogeneous stocks (Talbot et al. 1999), advanced intercross lines (Darvasi and Soller 1995), or recombinant inbred strain (for example, through recombinant inbred segregation tests, or RISTs). Alternatively, recombination breakpoints can be selectively produced in a desired specific region to fine map a specific QTL. These strategies include selecting individuals carrying a desirable recombination (i.e., selective phenotyping), recombinant progeny testing, or interval-specific congenic strains (Darvasi 1997, 1998).
The recent availability of whole-genome sequences and SNP databases for several mouse inbred strains presents a novel resource, which might be applicable to QTL mapping. Laboratory inbred strains of mice share a common ancestry. Therefore, in principle, a set of inbred strains might be analyzed as a segregating population for mapping purposes (provided sufficient statistical power; see below). In this sense, a set of inbred strains is similar to a set of recombinant inbred (RI) strains—with three major differences. First, while RI strains are generated from two parental strains, a set of inbred strains shares a more diverse ancestry. Second, the generation number of intercrossing in RI strains is significantly smaller than that in a set of inbred strains. The expected mapping resolution of a set of inbred strains is consequently expected to be higher than that of RI strains. In other words, the “haplotype blocks” in RI strains are significantly larger than those in a set of inbred strains. Third, the genetic variation in a set of inbred strains is expected to be higher and to contain a nonrandom composition of ancestral DNA, as opposed to RI strains that are created from only two parental strains and will generally have a random mixture of those two strains. It is important to note, however, that apart from these quantitative differences, the two resources (RI strains and a set of inbred strains) are conceptually similar in the context of gene mapping. While RI strains have been a successful resource for mapping Mendelian genes and markers (Taylor 1989), the relatively low number of currently available RI strains makes this resource significantly underpowered for QTL mapping (Belknap et al. 1996).
Similarly to RI strains, the use of mouse inbred strains without the performance of any additional crosses has been suggested as an independent mapping resource. It has been proposed that the analysis of haplotype distribution and mean phenotypic values in several inbred strains may be used as “in silico” mapping for QTL (Grupe et al. 2001). Again similarly to RI strains, the relatively low number of inbred strains that may be used for this purpose makes the resource significantly underpowered in most relevant cases (Chesler et al. 2001; Darvasi 2001).
In spite of the relatively low statistical power of a small set of RI strains, it has been noted that such sets include a fairly large number of recombinations across the entire genome. RIST has been suggested as an approach that may take advantage of the abundance of accumulated recombination events and thereby overcome the lack of statistical power. In RIST, one specific RI strain is crossed independently with both parental strains and two segregating populations are created (backcross or F2). A previously mapped QTL will necessarily segregate in one cross, but not in the other. The QTL position is consequently confined to regions where the RI allele pattern is similar to one strain but not to the other.
The even-greater abundance of recombination events accumulated in a set of inbred strains can undoubtedly be used for fine QTL even with a small number of inbred strains. Multiple cross mapping (MCM; Hitzemann et al. 2000, 2003; Park et al. 2002) has been suggested and implemented for this specific purpose. This approach is based on the basic observation (similar to RIST) that if a QTL segregates between two inbred strains, the two crosses will necessarily carry different alleles at the causative polymorphism of the QTL. At the same time, if the QTL does not segregate, the crosses will share the same allele at the relevant locus. Using multiple crosses of four strains and medium-resolution haplotype data, Park et al. (2002) were able to reduce the number of candidate genes for metastatic efficiency to 23 genes of >400 genes located in a 10-cM region. Hitzemann et al. (2003) identified the Kcnj9 gene as the main candidate gene for basal locomotor activity in chromosome 1, using six intercrosses of four strains and a sorting algorithm interrogating sequence variations and brain gene expression.
We note here that the MCM approach can be reduced to the following implementation. Since the approach is appropriate for fine mapping, it is assumed that a QTL has been previously mapped in a cross between, for example, strain A and strain B. It is sufficient to cross each new strain available for interrogation with A and B. Each such strain crossed to A and B will exhibit a segregating QTL in only one of the crosses. The QTL allelic state in that strain will thus be defined (similar to RIST). Since each strain is crossed to the two strains where the QTL was initially mapped and the QTL will necessarily segregate in one cross but not in the other, we have termed this type of cross “yin-yang” (in this context, RIST represents a particular example of yin-yang crosses). Assuming that yin-yang crosses are performed, the mapping resolution of a set of inbred strains is determined solely by the sequence information and variation among the strains. In the current study we evaluate this approach to determining mapping resolution using the complete sequence information available for four inbred strains on chromosome 16.
MATERIALS AND METHODS
Yin-yang crosses:
A QTL is assumed to have been initially mapped to a specific chromosomal region through standard crosses of two inbred strains, A and B. Sequence information can further reduce the interval containing the QTL by eliminating regions shared by the two strains. A third strain (C) is then crossed separately with A and B to produce two independently segregating populations (backcrosses or F2). Given that the QTL segregates in the A × B cross, the QTL will necessarily segregate in one of the two crosses, A × C or B × C—but not in both. Detecting the cross in which the QTL segregates refines the QTL location to the region (or SNPs) where the strains in which the QTL segregated diverged (see Figure 1). Specifically, following the example of Figure 1, two possible outcomes exist: (1) if the QTL segregates in A × C and not in B × C, any sequence variation that diverges between A and B and between A and C but is identical in B and C can potentially be the functional polymorphism and (2) if the QTL segregates in B × C and not in A × C, any sequence variation divergent between A and B and between B and C but identical in A and C can potentially be the functional polymorphism.
Figure 1.—
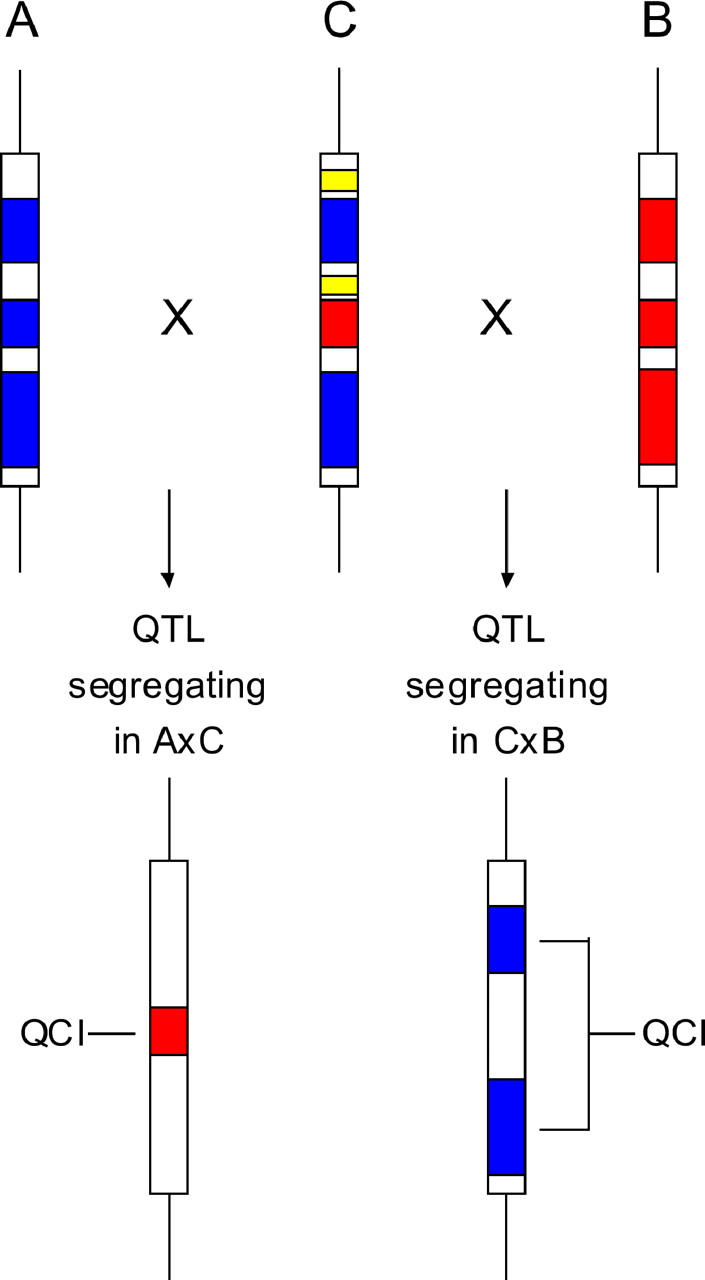
Schematic of yin-yang crosses. A and B are the strains initially used to map the QTL. The boxes represent the QTL-containing interval; red and blue parts in A and B represent regions in which sequence information reveals differences between the two strains, while white regions represent nonpolymorphic regions within the QTL-containing interval. C is the strain used to generate two independently segregating populations (yin-yang crosses). Blue and red in C represent regions where the allelic state is as in A or B strains, respectively. White refers to nonpolymorphic regions between strains A, B, and C. Yellow represents a region not polymorphic between strains A and B (and thus not relevant here) but polymorphic between strain C and the two other strains. Depending on whether strain C carries an allele at QTL according to strain A or B, a different cross will exhibit a segregating QTL. The QTL will segregate either in A × C or in C × B. Respectively, the vertical arrow on the left or the vertical arrow on the right will point to the resulting QCI (marked in red if the QTL segregated in A × C and marked in blue if the QTL segregated in C × B).
If the sequence information of a panel of inbred strains is available, strain C can then be optimally selected. The optimal strain will be that closest to having half of the A × B polymorphisms, with an allele as in A and the other half with an allele as in B. A sequential procedure can then be followed by further optimally selecting additional strains and performing yin-yang crosses with A and B. Alternatively, a selected set of strains (C1, C2, C3, …) can be crossed in parallel with A and B (A × C1, B × C1, A × C2, B × C2, A × C3, B × C3, …). Although crossing the entire set of strains at once is faster, a sequential procedure of crossing one optimal strain at a time can reduce the number of strains needed for a given resolution. It should be noted that if the QTL possesses only two alleles, the yin-yang crosses of any additional strain C1, C2, C3, … with A and B will provide all the necessary information for mapping purposes. Consequently, Ci × Cj crosses do not add information that cannot be achieved through A × Ci-B × Ci yin-yang crosses.
Mapping simulation:
The purpose of this simulation is to determine the mapping resolution achievable using full sequence information from four specific inbred strains. It is assumed that a QTL has been mapped using C57BL/6J (B6) and A/J (the most popular strains for QTL mapping) into a specific interval. It is further assumed that only one segregating QTL exists in that region and that the effect is caused by a single biallelic SNP (or biallelic haplotype across inbred strains). It can consequently be concluded that the QTL has one allele in A/J and a different allele in B6. Subsequently, yin-yang crosses are performed with either 129S1/SvImJ and 129X1/SvJ (considered as the same strain and denoted 129) or DBA/2J (D2; i.e., D2 × A/J and D2 × B6 or 129 × A/J and 129 × B6), followed by the other strain. The strain analyzed first (D2 or 129) is selected as the one being closest to or equally similar to A/J and B6 in the region being analyzed. A strain that is equally similar to A/J and B6 will refine the QTL location by ∼50%. With the sequence information available for A/J and B6, the QTL can be assigned at the first stage to regions or polymorphic loci between A/J and B6. If a strain, say D2, is then analyzed through yin-yang crosses with A/J and B6, its allelic state at the QTL will be determined depending on whether the QTL segregated in the D2 × A/J or D2 × B6 cross. The sequence information of D2 will further refine the QTL location (see Figure 1). Assuming that this process is followed, mapping resolution will be established according to the sequence variation among the four strains.
To evaluate this mapping resolution, each SNP polymorphic between A/J and B6 is successively simulated as the QTL. We consider cases in which the QTL were previously mapped into intervals of 1, 2, or 5 Mb. All the SNPs in the determined region were considered to have an equal likelihood of being the causative polymorphism. The causative SNP was assumed to be in the center of the interval (except at the chromosome extremes where the size of the interval, but not the centrality of the causative SNP, was retained). The number of SNPs diverging between A/J and B6 was set as the initial number of SNPs for that interval. With the introduction of a new strain, for example, D2, the allele state of D2 at the simulated SNP was determined. If the allele was as in A/J, the number of potential SNPs was then reduced to SNPs diverging between A/J and B6 and between D2 and B6 within the analyzed interval. If, however, the allele state of D2 at the simulated SNP was as in B6, the number of potential SNPs was reduced to SNPs divergent between A/J and B6 and also between D2 and A/J within the analyzed interval. To estimate the size of the QTL-containing interval (QCI) with 95% confidence, the studied region was divided into adjacent intervals of 100 kb. Then, the minimum number of 100-kb intervals (not necessarily adjacent) containing 95% of the SNPs defines the 95% QCI (for simplicity we refer henceforth to the 95% QCI and to its total length as the QCI). The QCI can be composed of several nonadjacent intervals. However, its total length is comparable to the length of a standard 95% confidence interval.
SNP database:
We used the public database of SNPs available at the Mouse Phenome Database (MPD 146.2), which is based on NCBI mouse genome assembly build 30 for most SNPs (http://aretha.jax.org/pub-cgi/phenome/mpdcgi?rtn=projects/details&id=146). This data set includes detailed SNP information for chromosome 16 as a result of the public mouse genome sequencing project using the C57BL/6J (B6) strain and Celera's sequencing project on the strains: DBA/2J (D2), A/J, 129S1/SvImJ, and 129X1/SvJ (Wiltshire et al. 2003). As is customary in these kinds of analyses, strains 129S1/SvImJ and 129X1/SvJ were considered as the same strain (denoted 129). This SNP database of chromosome 16 is currently the most comprehensive, publicly available database. We used a set of 22,814 SNPs with different alleles at the A/J and B6 strains and also available allele information for the D2 and 129 strains.
RESULTS AND DISCUSSION
To estimate the mapping resolution of the sequence-based approach using inbred strains and yin-yang crosses, we considered the average number of SNPs that remain potential candidate SNPs underlying the QTL as a function of the number of strains analyzed (Table 1). The QCI length also is considered as a function of the number of strains analyzed. As demonstrated in Table 1, the reduction in either the number of SNPs or the QCI is quite modest on average. The mean QCI reduction using four strains is 31, 44, and 54% for QTL initially mapped to 1, 2, and 5 Mb intervals, respectively. This is not surprising, since the use of only four strains indeed presents a rather limited amount of information, especially given the relative relation between these strains (Wiltshire et al. 2003). The maximum that can be expected is an average reduction (of the QCI or the number of SNPs) of 50% with each new strain introduced. Thus, for example, the number of SNPs can be reduced by 75% with four strains if the two additional strains are selected from a large panel of strains with sequence information. Generally, the number of SNPs or the QCI can be reduced 2n-fold (n is the number of strains used for yin-yang crosses) if a sufficient number of strains are available allowing the selection of an optimal strain in each stage. While in the initial stages, where the interval is relatively large, finding such strains will obviously be a relatively easy task, when the interval size is smaller, it will be more difficult, perhaps even impossible, to find such optimal new strains. As Table 1 demonstrates, the longer the initial interval, the more pronounced the average reduction becomes in both the number of SNPs and QCI. The same trend was observed for QTL initially mapped to intervals >5 Mb (data not shown). Unfortunately, there is limited value in directly applying this approach to QTL that were initially mapped to large intervals (i.e., 10–20 cM). Although the reduction in the QCI and the number of SNPs will be significant, it will not be sufficient to avoid reducing the standard confidence interval using other methods making the yin-yang crosses, in this case, significantly redundant.
TABLE 1.
The average number of SNPs and QCI (in megabases) as a function of the number of strains analyzed
| No. of SNPs
|
QCIa
|
||||||
|---|---|---|---|---|---|---|---|
| Initial length (Mb) | No. of strains: | 2 | 3 | 4 | 2 | 3 | 4 |
| 5 | 1901 | 1150 | 1091 | 3.16 (36.8) | 2.43 (51.3) | 2.28 (54.4) | |
| 2 | 870 | 596 | 580 | 1.40 (29.8) | 1.17 (41.5) | 1.13 (43.6) | |
| 1 | 492 | 367 | 362 | 0.79 (21.0) | 0.70 (29.8) | 0.69 (30.9) | |
See text for further definition of the QTL-containing interval. The numbers in parentheses represent the percentage of interval-length reduction.
Although the average reduction in number of SNPs or QCI is quite small, the distribution of the reduction has a significant variance. Figure 2 presents the distribution of QCI reduction following the analysis of all four inbred strains. In some regions the QCI is reduced to very short intervals (∼100 kb), while other regions are virtually unaffected by the procedure. Figure 3 presents two particular regions, each at a different extreme of the distribution. In one region, the number of potential SNPs was reduced to 5 SNPs, and in the other, to 1696 SNPs, following the analysis of all four strains. Similarly, the QCI was reduced in the high-resolution region from 5 to 0.4 Mb, and in the low-resolution region the reduction was only from 5 to 3.6 Mb. Again, the availability of several inbred strains with sequence information may allow selection of an inbred strain, which will locate us at the desirable extreme of the distribution.
Figure 2.—
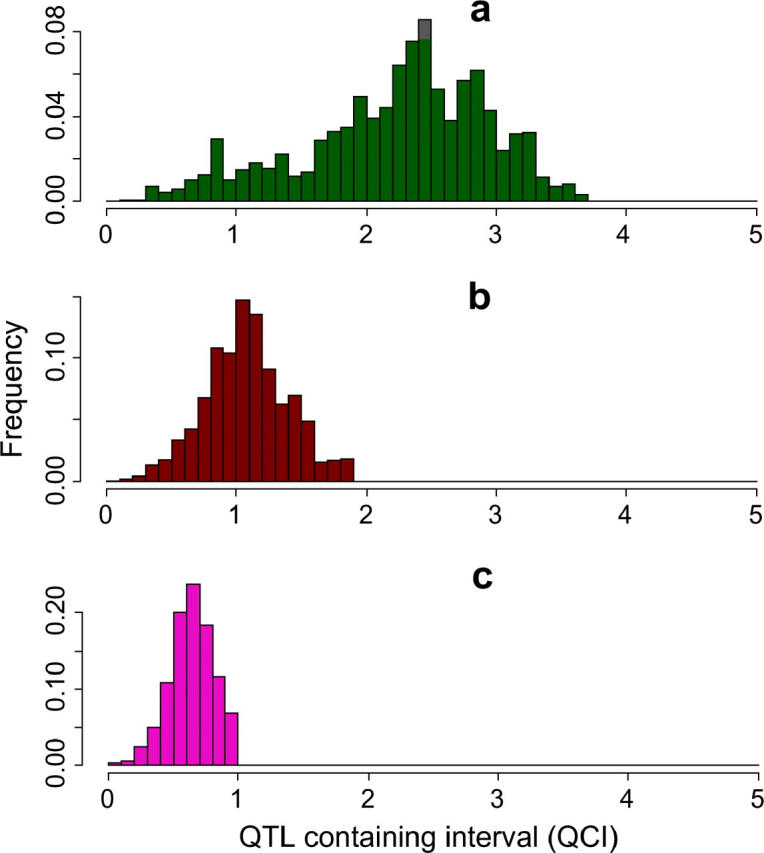
The distribution of QCI lengths. The QCI was calculated for 22,814 SNPs that were simulated as the causative effect. Each SNP was assumed to have been initially mapped to intervals of 5 Mb (a), 2 Mb (b), and 1 Mb (c). Following yin-yang crosses using all four inbred strains, the simulation defined a final QCI for each SNP. Here, the distribution of QCI lengths is presented in a histogram format.
Figure 3.—

Examples of two 5-Mb regions at the extremes of the QCI length distribution. The x-axis presents each region divided into 50 intervals of 100 kb. The number of potential SNPs in each 100-kb interval is shown by a solid bar. The first region, at the high mapping resolution extreme (chromosome 16, 10–15 Mb), is presented in a–c for the analysis of two, three, and four strains, respectively. The second region, at the low mapping resolution extreme (chromosome 16, 56–61 Mb), is presented in d–f for the analysis of two, three, and four strains, respectively. The total number of potential SNPs in the entire 5-Mb region and the corresponding total QCI length (see text for definition) are presented on top of each figure.
Assessment of the potential of this method to accurately locate a previously mapped QTL can be performed beforehand by examining the sequence information in the relevant chromosomal region with the strains available. Here we present the mapping resolution potential for chromosome 16, where the QTL was initially mapped in an A/J × B6 cross. D2 and 129 are subsequently used for additional fine mapping. Figure 4 presents the mapping resolution along chromosome 16 by calculating the average QCI length (a moving average of 100 SNPs) for two, three, and four strains and for initial QTL-containing intervals of 5, 2, and 1 Mb. The results show regions with high resolution (notably at positions 10–20 and 46–51 Mb) and other regions with modest or poor resolution. It should be noted that most of the mapping resolution is achieved by the initial sequence information of A/J and B6. With these four strains and for this chromosome, the effect of adding a fourth strain will virtually always fail to create a notable effect on mapping resolution.
Figure 4.—

Average mapping resolution, calculated as a moving average of the QCI lengths with a sliding window of 100 SNPs across chromosome 16. The average resolution is presented for the analysis of the sequence information of A/J × B6 alone (blue line) or when adding one (green line) or two (red line) additional inbred strains. We present results for QTL initially mapped to intervals of 5 Mb (a), 2 Mb (b), and 1 Mb (c).
Rather than providing a specific interval, the sequence-based approach supplies a list of potential polymorphisms. Obviously the list of polymorphisms can be translated into intervals (the QCI), as we present here for illustration purposes. Notwithstanding, the provided information is the list of potential polymorphisms, which may be the causative effect, given the inbred strain allelic state. Additional reduction in the critical region consequently can be achieved through sophisticated bioinformatics tools that evaluate the potential relevance of a particular SNP to the trait in question. This will result in a significant further reduction in the number of SNPs that need to be considered, as well as in prioritizing the selected SNPs for further functional examination.
It is important to exercise caution when considering this approach. The basic assumption underlying the ability to successfully apply the yin-yang approach is that a single biallelic SNP (or haplotype) affects the trait under study in the analyzed region. Furthermore, QTL that primarily exhibit epistatic effects will not be suitable for this kind of analysis in a straightforward manner. Nevertheless, situations violating these assumptions, such as multiple QTL in a region or private strain-specific alleles affecting the trait, will result in inconclusive results of the yin-yang analysis but are unlikely to produce false-negative results.
In the current study we used the data of only four strains, reflecting the only extensive public database currently available. Drawing definitive conclusions regarding the potential of this approach with a large number of strains will require further study and the availability of sequence information on a large number of strains. On the basis of the results presented here, it can be speculated that additional strains may allow the kind of mapping resolution over the entire genome, which was observed here only in limited regions. With sequence information in hand it will be possible to computerize the strain selection process to achieve optimal mapping resolution with a minimum number of strains requiring yin-yang crosses.
As is becoming evident, neither this nor similar approaches should be regarded as “holy grails” enabling identification of the QTL underlying genes. This approach still requires a significant amount of work and it is likely that the final mapping resolution will not locate the gene but provide a good starting point for additional technologies to locate and validate the actual genes.
Acknowledgments
This study was supported by the Israel Academy of Sciences and Humanities and by the Ministry of Science of Israel.
References
- Belknap, J. K., S. R. Mitchell, L. A. O'Toole, M. L. Helms and J. C. Crabbe, 1996. Type I and Type II error rates for quantitative trait loci (QTL) mapping studies using recombinant inbred mouse strains. Behav. Genet. 26: 149–160. [DOI] [PubMed] [Google Scholar]
- Chesler, E. J., S. L. Rodriguez-Zas and J. S. Mogil, 2001. In silico mapping of mouse quantitative trait loci. Science 294: 2423. [DOI] [PubMed] [Google Scholar]
- Darvasi, A., 1997. Interval-specific congenic strains (ISCS): an experimental design for mapping a QTL into a 1-centimorgan interval. Mamm. Genome 8: 163–167. [DOI] [PubMed] [Google Scholar]
- Darvasi, A., 1998. Experimental strategies for the genetic dissection of complex traits in animal models. Nat. Genet. 18: 19–24. [DOI] [PubMed] [Google Scholar]
- Darvasi, A., 2001. In silico mapping of mouse quantitative trait loci. Science 294: 2423. [PubMed] [Google Scholar]
- Darvasi, A., and M. Soller, 1995. Advanced intercross lines, an experimental population for fine genetic mapping. Genetics 141: 1199–1207. [DOI] [PMC free article] [PubMed] [Google Scholar]
- Glazier, A. M., J. H. Nadeau and T. J. Aitman, 2002. Finding genes that underlie complex traits. Science 298: 2345–2349. [DOI] [PubMed] [Google Scholar]
- Grupe, A., S. Germer, J. Usuka, D. Aud, J. K. Belknap et al., 2001. In silico mapping of complex disease-related traits in mice. Science 292: 1915–1918. [DOI] [PubMed] [Google Scholar]
- Hitzemann, R., K. Demarest, J. Koyner, L. Cipp, N. Patel et al., 2000. Effect of genetic cross on the detection of quantitative trait loci and a novel approach to mapping QTLs. Pharmacol. Biochem. Behav. 67: 767–772. [DOI] [PubMed] [Google Scholar]
- Hitzemann, R., B. Malmanger, C. Reed, M. Lawler, B. Hitzemann et al., 2003. A strategy for the integration of QTL, gene expression, and sequence analyses. Mamm. Genome 14: 733–747. [DOI] [PubMed] [Google Scholar]
- Korstanje, R., and B. Paigen, 2002. From QTL to gene: the harvest begins. Nat. Genet. 31: 235–236. [DOI] [PubMed] [Google Scholar]
- Mackay, T. F. C., 2001. The genetic architecture of quantitative traits. Annu. Rev. Genet. 35: 303–339. [DOI] [PubMed] [Google Scholar]
- Park, Y. G., L. Lukes, H. Yang, M. T. Debies, R. S. Samant et al., 2002. Comparative sequence analysis in eight inbred strains of the metastasis modifier QTL candidate gene Brms1. Mamm. Genome 13: 289–292. [DOI] [PubMed] [Google Scholar]
- Talbot, C. J., A. Nicod, S. S. Cherny, D. W. Fulker, A. C. Collins et al., 1999. High-resolution mapping of quantitative trait loci in outbred mice. Nat. Genet. 21: 305–308. [DOI] [PubMed] [Google Scholar]
- Taylor, B. A., 1989 Recombinant-inbred strains, pp. 773–796 in Genetic Variants and Strains of the Laboratory Mouse, edited by M. F. Lyon and A. G. Searle. Oxford University Press, Oxford.
- Wiltshire, T., M. T. Pletcher, S. Batalov, S. W. Barnes, L. M. Tarantino et al., 2003. Genome-wide single-nucleotide polymorphism analysis defines haplotype patterns in mouse. Proc. Natil. Acad. Sci. USA 100: 3380–3385. [DOI] [PMC free article] [PubMed] [Google Scholar]