Abstract
Plant endo-β-1,3-glucanases (EGases) degrade the cell wall polysaccharides of attacking pathogens and release elicitors of additional plant defenses. Isozymes EGaseA and EGaseB of soybean differ in susceptibility to a glucanase inhibitor protein (GIP1) produced by Phytophthora sojae, a major soybean pathogen. EGaseA, the major elicitor-releasing isozyme, is a high-affinity ligand for GIP1, which completely inhibits it, whereas EGaseB is unaffected by GIP1. We tested for departures from neutral evolution on the basis of partial sequences of EGaseA and EGaseB from 20 widespread accessions of Glycine soja (the wild progenitor of soybean), from 4 other Glycine species, and across dicotyledonous plants. G. soja exhibited little intraspecific variation at either locus. Phylogeny-based codon evolution models detected strong evidence of positive selection on Glycine EGaseA and weaker evidence for selection on dicot EGases and Glycine EGaseB. Positively selected peptide sites were identified and located on a structural model of EGase bound to GIP1. Positively selected sites and highly variable sites were found disproportionately within 4.5 Å of bound GIP1. Low variation within G. soja EGases, coupled with positive selection in both Glycine and dicot lineages and the proximity of rapidly evolving sites to GIP1, suggests an arms race involving repeated adaptation to pathogen attack and inhibition.
AMONG the complex interspecific relationships arising through coevolution, the enmeshed attack and defense systems of plants and their pathogens are among the most intricate (Somssich and Hahlbrock 1998; Dangl and Jones 2001). One promising approach to understanding their coevolution is to elucidate the long-term pattern of selection acting on individual biochemical components that govern plant-pathogen interactions. Analysis of molecular variation at plant R-genes that function in recognition of invading pathogens has revealed a variety of evolutionary patterns, including strong balancing selection in some cases and evidence of selective sweeps, indicative of an arms race, in others (Bergelson et al. 2001; Mondragón-Palamino et al. 2002; De Meaux and Mitchell-Olds 2003). Similar analyses of genes involved in defense deployment (rather than recognition) reveal recent or repeated selective sweeps (De Meaux and Mitchell-Olds 2003). However, in only one case, that of the pathogen-produced cell wall degrading enzyme polygalacturonase (PG) and its plant-produced inhibitor protein (PGIP), has selection on a pair of antagonistically interacting components been examined (Stotz et al. 2000; Götesson et al. 2002). Here we analyze genetic variation at two plant endoglucanase loci, cell wall degrading enzymes whose role in defense and interaction with a pathogen-produced inhibitor protein have been carefully documented (Ham et al. 1997; Rose et al. 2002; York et al. 2004).
Plant cells are surrounded by rigid walls composed of complex polysaccharides and diverse proteins (Carpita and Gibeaut 1993; Reiter 2002; O'Neill and York 2003). In addition to providing structural support, cell walls constitute an important line of defense against pathogens. To penetrate and nutritionally utilize plant cell walls, pathogens secrete a remarkable array of polysaccharide degrading enzymes, including exo- and endopolygalacturonases, cellulases, pectinases, rhamnogalacturonase, and xylanases (Walton 1994; de Vries and Visser 2001; Lev and Horwitz 2003). Some of these exist in large multigene families that exhibit diverse patterns of expression, suggesting functional specialization (Götesson et al. 2002). As a countermeasure, plants deploy cell wall-associated inhibitor proteins of these degradative glycanhydrolases (Stahl and Bishop 2000; de Vries and Visser 2001; Qin et al. 2003). For example, inhibitors of microbial PGs not only directly retard pathogen penetration, but also inhibit pathogen degradation of the cell wall-derived oligogalacturonides that elicit induced defenses (Côté et al. 1998; Esquerre-Tugaye et al. 2000; Ridley et al. 2001).
Plants further guard against pathogens through glycanhydrolytic attack on the cell walls of invading pathogenic bacteria, fungi, and oomycetes. The best-known defensive glycanhydrolases are chitinases and endo-β-1,3-glucanases (EGases), many of which are expressed in response to pathogen attack and can confer resistance against specific pathogens(Broglie et al. 1991; Grison et al. 1996; Jin et al. 1999; Leubner-Metzger and Meins 1999). Considerable evidence suggests that these enzymes protect plants through two distinct mechanisms. First, they may directly impair microbial growth and proliferation by hydrolyzing the chitin and β-1,3/1,6-glucan components of the pathogen cell wall, rendering cells susceptible to lysis and additional defense responses. Second, cell wall fragments released by chitinolytic and glucanolytic activity elicit a wide range of further defense responses (Côté et al. 1998). In turn, pathogens may resist glycanhydrolytic attack by deploying inhibitors of chitinases and endo-β-1,3-glucanases, by cell wall modification, or by proteolytic attack (Esquerre-Tugaye et al. 2000; Stahl and Bishop 2000; Rose et al. 2002; York et al. 2004). The systems of attack and counterattack centered on cell walls of both plants and pathogens seem likely to favor a coevolutionary series of advantageous countermeasures in each interactor, which may include selective sweeps of favorable mutations and the recruitment of new proteins to the interaction.
Isozymes of plant glycanhydrolases vary in their susceptibility to pathogen-produced inhibitors. For example, two class I chitinases isolated from Phaseolus vulgaris differed in their susceptibility to allosamidin, a bacterial inhibitor (Londershausen et al. 1996), despite differing by only four amino acid substitutions (J. Bishop, unpublished data). Variability in pathogen cell wall architecture and enzymatic inhibitors have been proposed as agents of positive selection detected in the active site of class I chitinases (Bishop et al. 2000), a circumstance conducive to the strong coevolutionary interactions characteristic of an arms race. One prediction of this hypothesis is that both members of an antagonistically interacting glycanhydrolase-inhibitor system should exhibit the signature of rapid adaptive evolution. This hypothesis has been supported by analysis of endoPGs from fungal and oomycetous pathogens and analysis of corresponding plant polygalacturonase inhibitor proteins (PGIPs) that revealed positive selection driving evolution of both the enzyme and the inhibitor (Stotz et al. 2000; Götesson et al. 2002).
Soybean endo-β-1,3-glucanases and corresponding glucanase inhibitor proteins (GIPs) secreted by the oomycete root pathogen Phytophthora sojae are an attractive system for studying the coevolution of enzyme-inhibitor systems. P. sojae GIPs inhibit up to 85% of soybean endoglucanase activity and appear to be highly specific for particular EGases (Ham et al. 1997). For example, GIP1 completely inhibits soybean EGaseA, which acts as a high-affinity ligand for GIP1, but it does not bind or inhibit the isozyme EGaseB, tobacco PR-2 (an EGase that is structurally similar to EGaseB), or an endogenous P. sojae EGase (Ham et al. 1997). EGaseA and EGaseB further differ in that EGaseA is constitutively produced, releases elicitors of additional defense reactions when soybean is challenged by P. sojae, and was shown experimentally to increase resistance to P. sojae, whereas EGaseB is induced upon pathogen attack and is not known to increase resistance (Yoshikawa et al. 1990; Rose et al. 2002). Although the corresponding genes remain uncloned, GIP activity has also been reported from the fungal pathogen Colletotrichum lindemuthianum (Albersheim and Valent 1974), suggesting that dicot EGases may face a broad range of GIPs. In this study we examined EGaseA and EGaseB for evidence of positive selection at three taxonomic scales—within the wild progenitor of soybean, Glycine soja, across the genus Glycine, and across all dicotyledonous plants.
MATERIALS AND METHODS
EGaseA corresponds to previously identified soybean genes Sglu2 and SGN1, which encode extracellular class III endoglucanases (Rose et al. 2002). SGN1 is produced constitutively and its expression increases in response to pathogens (Takeuchi et al. 1990; Cheong et al. 2000). Southern blots indicated that SGN1 is a single-copy gene in G. max cv. Williams (Cheong et al. 2000), but present in 4 copies (and possibly as many as 17) in G. max cv. Minsoy (Jin et al. 1999). EGaseB corresponds to soybean gene Sglu5, of which there are possibly six copies in soybean cv. Minsoy (Jin et al. 1999), and which encodes an acidic extracellular class II EGase with similarity to tobacco PR-2 (Rose et al. 2002). Previous analyses have compared EGaseA and EGaseB sequences using a truncated EGaseB-predicted open reading frame (Rose et al. 2002). For the current study, the full-length EGaseB sequence (accession AY461847) was amplified by PCR from a soybean hypocotyl cDNA library using a vector-specific primer and a number of EGaseB gene-specific PCR primers. EGaseA and EGaseB are without introns and the encoded proteins share ∼50% amino acid identity.
Partial EGaseA and EGaseB sequences were amplified from 20 accessions of G. soja drawn from throughout G. soja's range in Japan, China, S. Korea, and far eastern Russia and from 4 other Glycine species native to Australia, G. canescens, G. falcata, G. latrobeana, and G. tabacina. Seeds for all accessions were obtained from the USDA Soybean Germplasm Collection (see supplementary Table 1 at http://www.genetics.org/supplemental/). Genomic DNA was extracted from Glycine spp. leaves using a modified Dellaporta protocol (Dellaporta et al. 1985). PCR conditions for all genes were 35 cycles of 1 min at 94°, 1 min at 60°, and 2 min at 72° using AmpliTaq Gold per instructions, with 1 μg total plant DNA as substrate. EGaseA and EGaseB primers (EGaseA forward 5′ tccggggtatgttatggaaga 3′, reverse 5′ ggccatccactctcagacaca 3′; EGaseB forward 5′ cggcgtctgttatggaggaaa 3′, reverse 5′ acaaccttcacatttggtgcc 3′) amplified fragments 681 bp (227 codons) and 669 bp (223 codons) in length, respectively. PCR products were gel separated, excised, cleaned in a High Pure PCR product purification spin column (Roche Diagnostics), treated with shrimp alkaline phosphatase and exonuclease I, and sequenced. In most cases this yielded unambiguous sequence of a single product. However, multiple PCR products for EGaseB obtained from G. tabacina, G. falcata, G. canescens, and several G. soja accessions required cloning into pGEMtEZ vectors (Invitrogen, Carlsbad, CA) and several clones were sequenced from each. To guard against misinterpreting base misincorporation by Taq polymerase as polymorphism, each cloned allelic variant was verified by cloning from at least one additional PCR reaction, but no Taq-derived sequence errors were detected.
Sequences were assembled using Seqman 5.03, aligned using Clustal W in Megalign 5.03 (DNASTAR, Madison, WI), and then adjusted by hand. Phylogenies were estimated by maximum likelihood using DNAML (Felsenstein 2001) and by Bayesian inference using MrBayes 3.0 (Huelsenbeck and Ronquist 2001). For Bayesian estimates the Markov chain Monte Carlo search was run with 4 chains for 600,000 generations, with trees sampled every 100 generations (the first 1000 trees were discarded as “burnin”). The model employed six substitution types (“nst = 6”), with base frequencies set to the empirically observed values (“basefreq = empirical”).
Tests for adaptive molecular evolution were performed using phylogeny-based maximum likelihood models of codon evolution implemented in CODEML, part of PAML (Yang et al. 2000). These models allow nonsynonymous/synonymous rate ratios (dN/dS, hereafter referred to as ω) to vary among codons. A likelihood ratio test (LRT) is performed to compare the fit of a model that does not allow for positive selection with one that does. CODEML implements models with several different assumptions regarding the distribution of ω among sites. Model M1 is a neutral model that assumes all sites either are subject to purifying selection or are neutral (i.e., ω0 = 0 or ω1 = 1). Model M2 adds a third category, ω2 > 0, estimated from the data. If ω2 > 1, then the LRT is also a test of positive selection. However, the M2-M1 comparison lacks power in some cases where a large fraction of sites have 0 < ω < 1, in which case ω2 is forced to account for these sites rather than for positively selected sites (Yang et al. 2000). Comparing model M3 (three rate categories) to M0 (one rate category) may detect positive selection in such cases because M3 and M0 estimate ω-parameters from the data rather than fixing them at 0 or 1 (Yang et al. 2000). As in the M2-M1 comparison, a significant LRT indicates heterogeneity in selection among codons, but only if one ω > 0 does this become a test for positive selection. Although simulations indicate that the M3-M0 comparison is generally a conservative test for positive selection, under certain ω-distributions it may be more prone to falsely detecting positive selection (Anisimova et al. 2001). We used several different model comparisons to guard against this type of error.
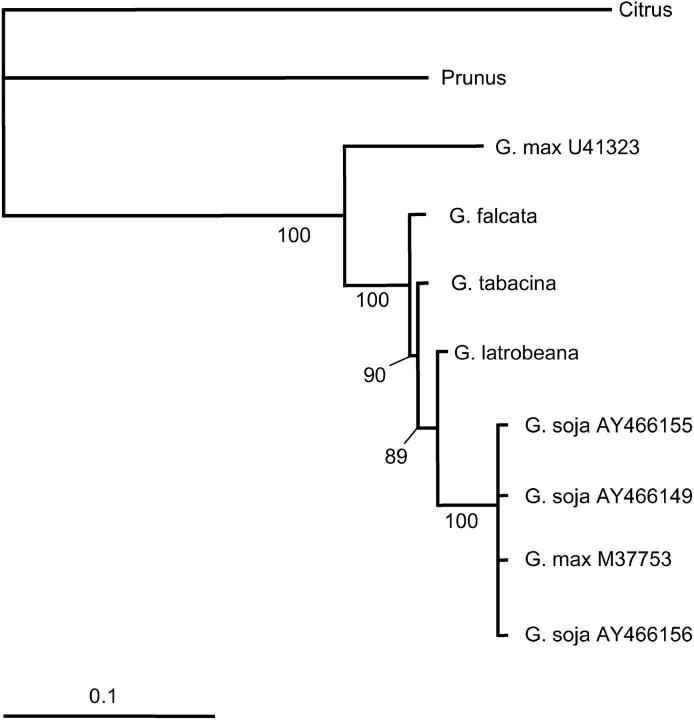
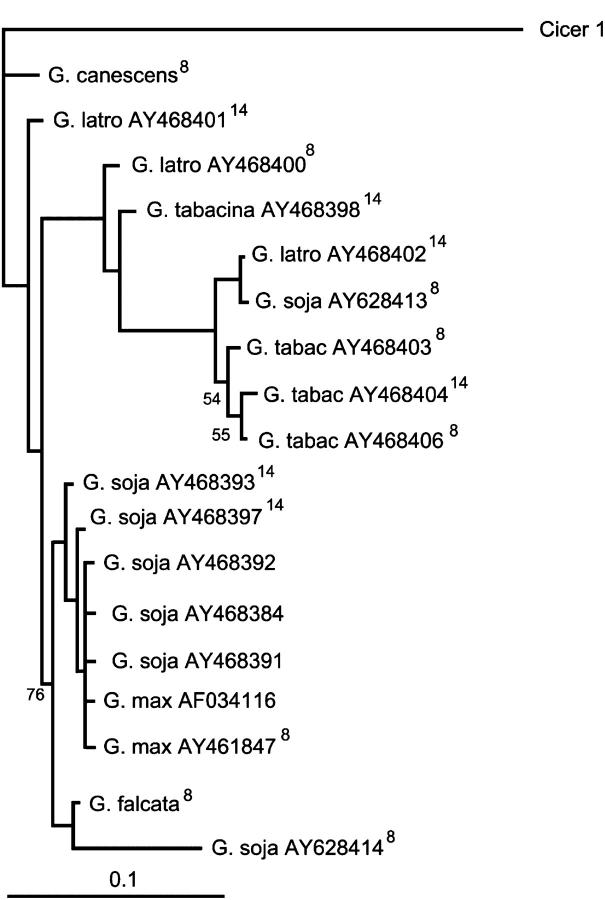
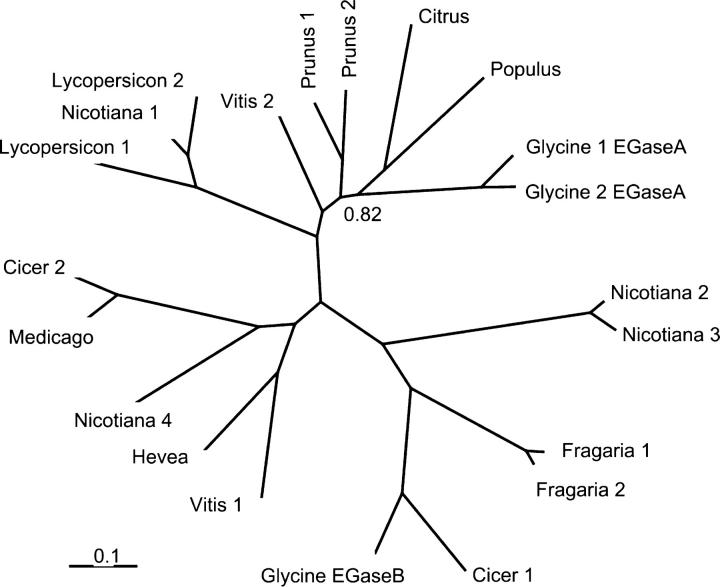
The codon-based analysis used Bayesian consensus trees for all unique alleles of Glycine EGaseA (8 unique sequences and 2 outgroup sequences; Figure 1 and see supplementary Figure 1 at http://www.genetics.org/supplemental/), EGaseB (18 unique sequences; Figure 2), and dicots (21 sequences; Figure 3; Table 1). For EGaseB, the full data set contains a number of G. soja and G. max sequences that differ from each other by a single substitution, resulting in a large number of equally plausible trees. Analyses were repeated on data sets of 14 and 8 sequences (Figure 2 and see supplementary Figure 2 at http://www.genetics.org/supplemental/), obtained after removing 1-bp variants (14-sequence data set) and possible allelic variants (defined here as conspecific sequences having >95% identity) to guard against elevated rates attributable to recombination or poor phylogenetic resolution. Phylogenetic trees were generally well supported (Figures 1–3), but to guard against results based on inaccurate phylogenetic inferences, models for the dicot and EGaseB data sets were rerun using additional phylogenies. For the dicot data and the 14-sequence EGaseB data set, CODEML models were run for the set of trees composing the 99% Bayesian credibility group and, for the smaller EGaseB data set, models were run for the 11 trees composing the 99% credibility group. Tree files are available in supplementary material online at http://www.genetics.org/supplemental/. Models included correction for codon usage bias and transition/transversion rate bias and were run with two initial parameter values (using initial values ω2init = 0.4 and 1.4). Different model assumptions or trees occasionally caused different peptide positions to be classified as positively selected and models employing lower probability trees tended to infer a greater number of positively selected positions. For each data set only positively selected sites identified across all trees are reported.
Figure 1.—
Bayesian phylogeny of Glycine EGaseA sequences. Numbers at nodes are posterior probabilities (×100). Nodes with probabilities <0.5 are collapsed. Total tree length is 2.81 (0.44 without Citrus and Prunus).
Figure 2.—
Bayesian phylogeny of EGaseB. Numbers at nodes are posterior probabilities (×100). Nodes with probabilities <0.5 are collapsed, and probabilities >0.97 are not shown. Cicer was removed prior to CODEML analysis. Sequences marked “8” are included in all EGaseB CODEML data sets and those marked “14” are included in 14- and 18-sequence data sets. Total tree length is 0.74.
Figure 3.—
Unrooted Bayesian phylogeny of dicot β-1,3-endoglucanases. Numbers at nodes are posterior probabilities <0.97. Species names and sequence accession are shown in Table 1. Total tree length is 15.3.
TABLE 1.
| Label | Species | Accession |
|---|---|---|
| Cicer 1 | C. arietinum | CAR012751 |
| Cicer 2 | C. arietinum | AJ131047 |
| Citrus | C. sinensis | AJ000081 |
| Fragaria 1 | F. chiloensis × virginiana | AY170375 |
| Fragaria 2 | F. chiloensis × virginiana | AB106651 |
| Glycine 1 (EGaseA) | G. max | U41323 |
| Glycine 2 (EGaseA) | G. max | M37753 |
| Glycine (EGaseB) | G. max | AY461847 |
| Hevea | H. brasiliensis | AJ133470 |
| Lycopersicon 1 | L. esculentum | X74906 |
| Lycopersicon 2 | L. esculentum | X74905 |
| Medicago | M. sativa | U21179 |
| Nicotiana 1 | N. tabacum | X54456 |
| Nicotiana 2 | N. tabacum | M60463 |
| Nicotiana 3 | N. tabacum | AF141653 |
| Nicotiana 4 | N. plumbaginifolia | X07280 |
| Populus | P. alba × tremula | AF230109 |
| Prunus 1 | P. persica | AF435089 |
| Prunus 2 | P. persica | AF435088 |
| Vitis 1 | V. vinifera | AF239617 |
| Vitis 2 | V. vinifera | AJ277900 |
Three-dimensional models of Glycine EGaseA and EGaseB were built on the basis of the X-ray structures of barley 1,3-1,4-β-glucanase (PDB codes 1AQ0 and 1GHS, respectively) as the 3-D structural templates using the MODELLER program (Sali and Blundell 1993; Varghese et al. 1994; Sali et al. 1995; Müller et al. 1998). Only a few deletions and insertions were needed and residue side-chains were accommodated well, with only minor distortions of the backbone. The active site residues of EGase were identified as Tyr34, Glu238, and Glu295 (Varghese et al. 1994). Models for GIP1 were built using a BLAST sequence alignment to chymotrypsin and using PDB accession 1EQ9 as the 3D-template. GIPs are homologous to trypsin-like serine proteases, but the catalytic residues His, Asp, and Ser common to serine protease enzymes have been substituted by Thr (Thr43), Asn (Asn91), and Thr (Thr177) in GIP1. Trypsin-like proteases bind their substrate by means of an Arg/Lys binding pocket containing a buried Asp residue. This binding pocket is preserved in GIP1, with Asp171 being the equivalent to Asp189 in trypsin.
A model of EGaseA docking with GIP1 was generated manually and was done blindly with respect to knowledge of positively selected sites. The model assumes that inhibition of EGaseA by GIP1 involves at least partial occlusion of the catalytic region and that the inhibitor uses a trypsin-like mechanism of recognition; i.e., GIP1 identifies an Arg or Lys residue on the surface of the EGaseA molecule. Because GIP1 inhibits only EGaseA and not EGaseB, we hypothesized that the Arg or Lys residue recognized by GIP1 should be present only on EGaseA but not on EGaseB. Only binding sites that produce a large surface of interaction without major distortions of the enzyme or inhibitor structures were considered. Residues Arg61 and Lys97 met these criteria. Our model assumes recognition based on Lys97 because it produced greater obstruction of the active site. EGase residues were assumed to be in contact with the bound GIP1 if the distance between any heavy atom belonging to the residue and any atom on the inhibitor was within 4.5 Å. We treat this as an a priori hypothesis of the region likely to experience positive selection.
RESULTS
Only three polymorphic sites were detected in 20 G. soja EGaseA sequences, yielding four haplotypes and a nucleotide diversity of π = 0.00052 and θ = 0.0012 per site (see supplementary Table 2 at http://www.genetics.org/supplemental/). All were replacement polymorphisms, with two being unique and the other shared by geographically distant accessions from Ehime and Aichi prefectures, Japan. The predominant G. soja haplotype was identical to G. max accession M37753. A single EGaseA sequence was obtained from each of the four other Glycine spp., but the G. canescens EGaseA contained a premature stop codon and was not included in further analyses. Our data appear consistent with the report that EGaseA is a single-copy gene (Cheong et al. 2000).
G. soja EGaseB exhibited seven variable sites, including four nonsynonymous mutations, yielding six haplotypes (see supplementary Table 2 at http://www.genetics.org/supplemental/). The predominant G. soja EGaseB haplotype was identical to G. max accession AF034110. Additional, poorly resolved PCR products were obtained from within G. soja accessions from Hokkaido, Japan and Zhejiang, China that appeared identical to sequences from G. latrobeana and G. tabacina, suggesting that these products likely represent a paralogous (duplicated) locus, as would be expected on the basis of EGaseB's membership in a gene family (Jin et al. 1999). Additional EGaseB paralogs were amplified from G. soja accession 447003 (Nei Mongol, China) as well as from G. latrobeana and G. tabacina (Figure 2 and see supplementary Table 1 at http://www.genetics.org/supplemental/). Because of uncertainty over paralogy and orthology, we do not report diversity statistics for EGaseB. Pseudogenes amplified from G. soja accession 578340A (Khabarovsk, Russia) and from G. falcata were omitted from the analyses.
Tests of selection:
Tests of selection based on intraspecific variation in G. soja were not conducted because of uncertainty over allelic vs. interlocus (paralogous) variation in EGaseB and because polymorphism in EGaseA was inadequate for such tests. Several pairwise sequence comparisons, all involving EGaseA from G. latrobeana, featured ω > 1 (ω = dN/dS). Although not statistically significant, the result suggests the possibility of strong selection acting on EGaseA. Codon evolution models applied to phylogenies and alignments of Glycine EGaseA, Glycine EGaseB, and a collection of dicot EGaseA and EGaseB sequences (Figures 1–3), provided evidence of positive selection (ω > 1) for all data sets (Table 2 and see supplementary Table 3 at http://www.genetics.org/supplemental/). Significant tests occurred for all Glycine EGaseA data sets and model comparisons, indicating that evidence for positive selection on EGaseA is particularly robust. Model comparisons were less consistently significant for Glycine EGaseB and across dicot EGases. For dicots only the M2 vs. M1 comparison was significant, but this test is fairly conservative. Although only one test was significant in the smaller EGaseB data (see supplementary Table 3 at http://www.genetics.org/supplemental/), the tests are known to lack power in a data set this size (Anisimova et al. 2001, 2002).
TABLE 2.
Results from CODEML analysis
| Data set (no. of sequences, tree lengtha) |
Model | Parameter estimates | Lb | LRTc | Positively selected sitesd |
|---|---|---|---|---|---|
| Glycine EGaseAe (8, 0.43) |
M0 (one ratio) | ω = 0.43 | −1356.8 | A183 | |
| M1 (neutral) | P1 = 0.58 P2 = 0.42 | −1350.5 | M2-M1: P = 0.017 | ||
| ω1 = 0.00 ω2 = 1.00 | |||||
| M2 (selection) |
P1 = 0.55 P2 = 0.44 P3 = 0.01 |
−1346.4 | M3-M0: P < 0.0001 | ||
| ω1 = 0.00 ω2 = 1.00 ω3 = 17.7 | |||||
| M3 (discrete) |
P1 = 0.52 P2 = 0.46 P3 = 0.02 |
−1346.4 | M3-M1: P = 0.08 | ||
| ω1 = 0.00 ω2 = 0.91 ω3 = 17.0 | |||||
| Glycine EGaseBe (18, 0.73) |
M0 (one ratio) | ω = 0.36 | −1681.5 | V40, D54, S150 | |
| M1 (neutral) | P1 = 0.63 P2 = 0.37 | −1666.1 | M2-M1: 0.25 | ||
| ω1 = 0.00 ω2 = 1.00 | |||||
| M2 (selection) |
P1 = 0.62 P2 = 0.35 P3 = 0.03 |
−1664.8 | M3- M0: P < 0.0001 | ||
| ω1 = 0.00 ω2 = 1.00 ω3 = 3.64 | |||||
| M3 (discrete) |
P1 = 0.34 P2 = 0.57 P3 = 0.09 |
−1663.3 | M3-M1: P = 0.06 | ||
| ω1 = 0.00 ω2 = 0.33 ω3 = 2.48 | |||||
| Dicot EGaseA & EGaseBe (21, 16.3) |
M0 (one ratio) | ω = 0.15 | −12212.3 | L9, K72, S150, A155, L207, Q289, Q291 |
|
| M1 (neutral) | P1 = 0.21 P2 = 0.79 | −12689.7 | M3-M1 (P < 0.0001) | ||
| ω1 = 0.00 ω2 = 1.00 | |||||
| M2 (selection) |
P1 = 0.21 P2 = 0.74 P3 = 0.05 |
−12676.1 | M2-M1 (P < 0.0001) | ||
| ω1 = 0.00 ω2 = 1.00 ω3 = 2.61 | |||||
| M3 (discrete) |
P1 = 0.40 P2 = 0.42 P3 = 0.18 |
−11841.4 | M3-M0 (P < 0.0001) | ||
| ω1 = 0.02 ω2 = 0.18 ω3 = 0.55 |
CODEML results for additional model comparisons and data subsets can be found in supplementary Table 3 at http://www.genetics.org/supplemental/.
Tree length is measured in nucleotide substitutions per codon.
Likelihood of the model given the data is denoted by L.
LRT specifies the model comparison and P-value, assuming a χ2 distribution with 2 d.f. (M2-M1, M3-M1) or 4 d.f. (M3-M0).
Sites with Bayesian posterior probability >0.94 that ω > 1. Site residues and numbers correspond to those in G. max M37753 (EGaseA); hence D54 is actually G54 in GlycineB.
Data set information: EgaseA, see Figure 1 and supplementary Figure 1 at http://www.genetics.org/supplemental/; EGaseB, see Figure 2 and supplementary Figure 2 at http://www.genetics.org/supplemental/; dicots, Figures 3 and 4; Table 1.
In each data set, Bayesian analysis of the models predicted positive, diversifying selection acting on 1 to several peptide sites, with a total of 10 positively selected sites across the data sets (Table 2; see Figures 4 and 5a and supplementary Figures 1 and 2 at http://www.genetics.org/supplemental/ for location of these sites). One site, Ser150 (taking the mature peptide of G. max M37753, Glycine2, as a reference), was positively selected in both the EGaseB and the dicot analyses, regardless of whether EGaseB was included in the dicot data set (see position 151 in Figure 4). Unfortunately, our Glycine data set sequences run only from Pro14 to Val235 (EGaseA) and from Gly7 to Val236 (EGaseB) and are therefore missing the 80-residue carboxy-terminal region containing 2 of the catalytic residues. The missing region comprises much of the active site and includes the region where most positively selected sites were found in the dicot data set. Therefore, the results for Glycine likely underestimate the number of selected residues.
Figure 4.—
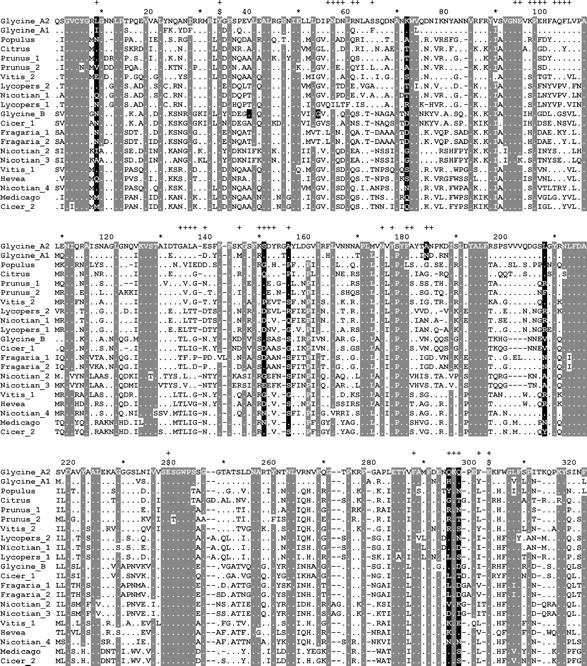
Alignment of dicot proteins used in CODEML analysis. Gray background denotes conserved sites and black background denotes positively selected sites. (+) Sites within 4.5 Å of bound GIP; ($) catalytic sites Y34, E238, and E295. Positively selected sites for Glycine EGaseA and EGaseB are shaded only in the corresponding Glycine rows. For corresponding GenBank accessions see Table 1. Alignments for Glycine EGaseA and EGaseB are available as supplementary Figures 1 and 2 at http://www.genetics.org/supplemental/.
Figure 5.—
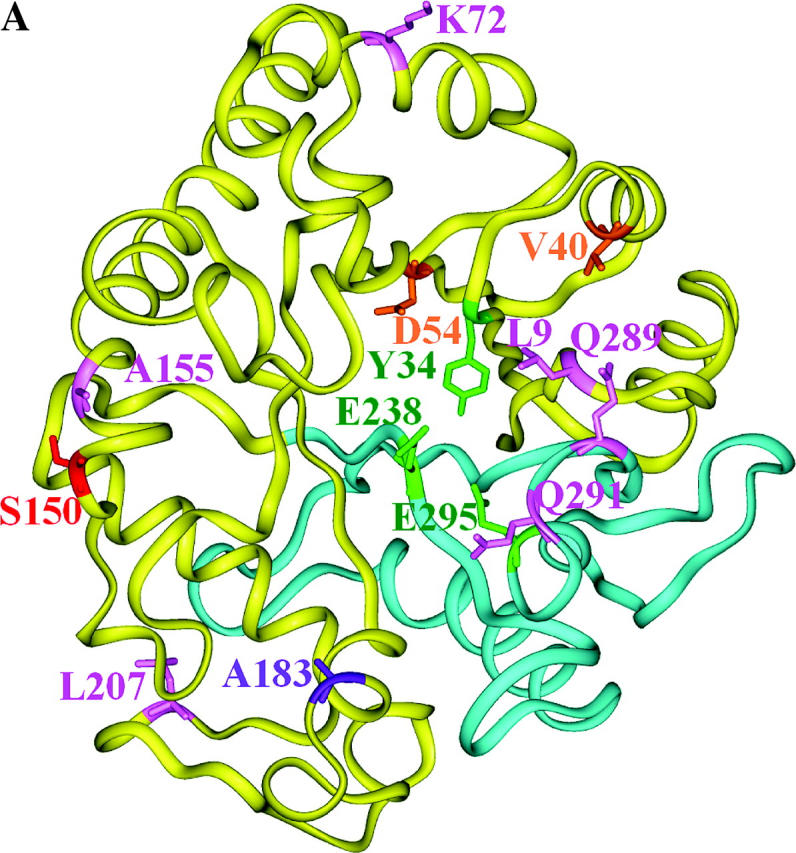
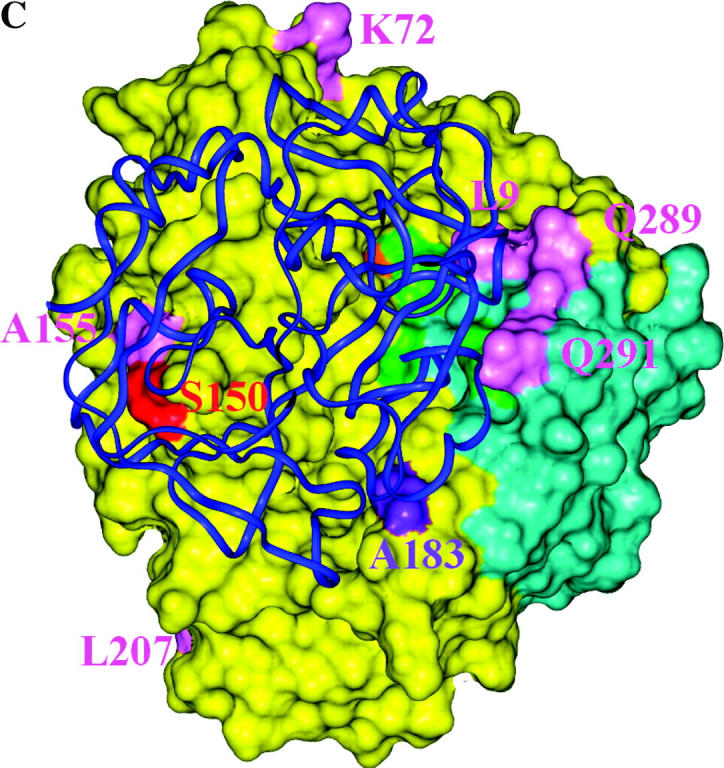
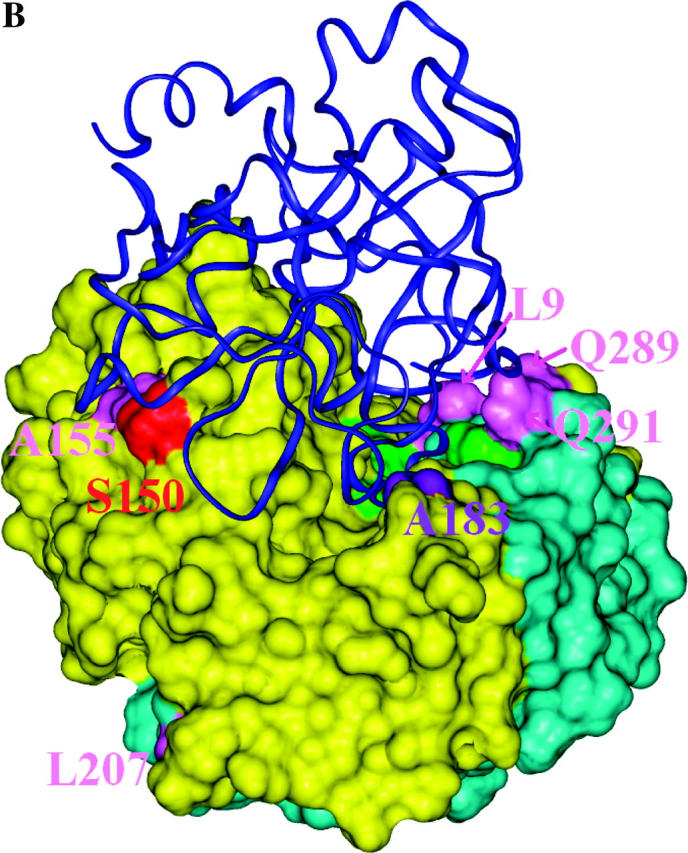
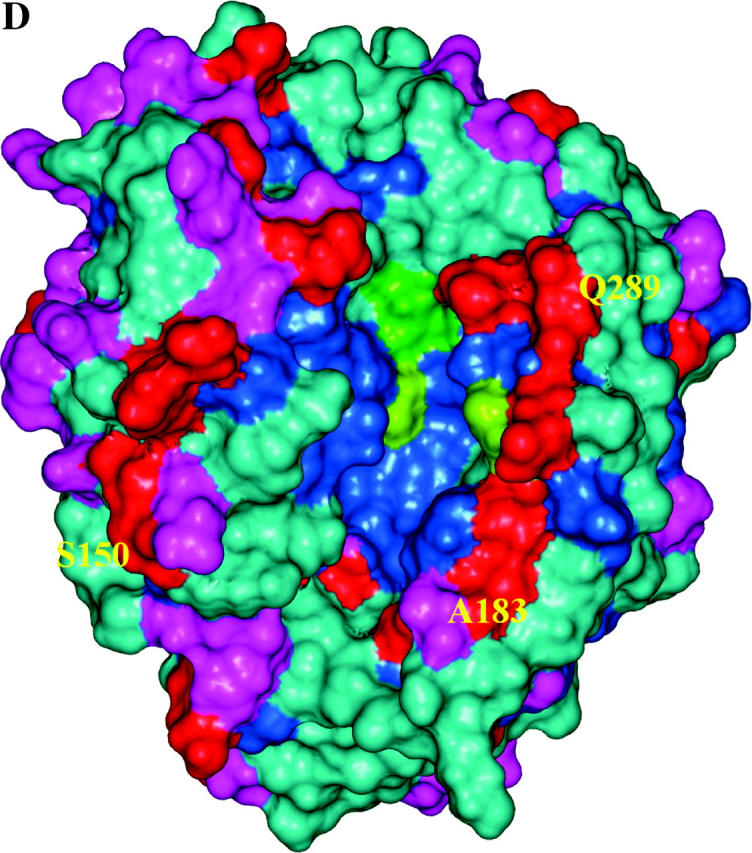
Structural models of EGaseA and GIP1. (a) Ribbon diagram of an EGase molecule with “stick representation” of positively selected (colored by data set) and catalytic residues. Green, catalytic residues; pink, dicot data set; purple, EGaseA data set; orange, EGaseB data sets; red, EGaseB and dicot data sets. Cyan portions were not studied in Glycine EGaseA and EGaseB. (b and c) Soybean EGaseA (solvent accessible surface) bound to P. sojae GIP1 (ribbon diagram). Colors represent positively selected positions from various data sets as in 5a. (b) Side view looking into substrate binding cleft. (c) Top view looking down toward substrate binding cleft. (d) Solvent accessible surface model of EGaseA colored according to the frequency of replacement substitutions at each site in the dicot phylogeny (Figure 3). Dark blue, 0–1 substitutions; cyan, <7 substitutions; magenta, <12 substitutions; red, >12 substitutions. Green denotes catalytic residues. Note the “ring of fire” of rapidly evolving sites around the margin of the substrate binding cleft.
Output of CODEML includes reconstructed ancestral sequences, based on maximum likelihood assignment of character states to the interior nodes of the phylogeny (Yang et al. 1995). We used these reconstructions for the five positively selected sites in the dicot data set that are situated in close proximity to GIP1 to estimate the number of amino acid substitutions at these sites that involved recurrent or convergent evolution to the same residue. Of an estimated 73 substitutions occurring since the common ancestor of these sequences, 35 (48%) involve convergence to allelic states found at other nodes (see supplementary Figure 5 at http://www.genetics.org/supplemental/).
Structural models:
Our model of GIP1 bound to EGaseA allowed assessment of whether changes in EGase are likely driven by arms race-type interactions with the inhibitor. Although our binding model is based on GIP bound to EGaseA, superimposition of EGaseA and EGaseB models indicates a close correspondence of atomic position in the two models (C-α root mean square deviation = 1.75 Å). Positively selected sites occurred within 4.5 Å of bound GIP nearly four times more often than expected: 15% (46 of 312; Figure 4) of all residues are within 4.5 Å of GIP vs. 60% of positively selected residues (6 of 10; χ2 = 13.5, 1 d.f., P = 0.0002). Furthermore, the number of replacement substitutions per site for the dicot data set is significantly greater at sites within 4.5 Å of GIP (328 of 1476 replacements are within 4.5 Å, corresponding to 4.3 replacements per codon near GIP vs. 7.1 replacements per codon away from GIP, t = −3.07, 52 d.f., P = 0.003), whereas silent substitutions are equitably distributed (239 of 1571 silent substitutions are within 4.5 Å of GIP, corresponding to 5.3 substitutions per codon within 4.5 Å vs. 5.5 substitutions per codon outside 4.5 Å, P = 0.64). Despite missing sequence data for 25% of the protein including much of the active site region, 3 of the 4 positively selected residues identified for Glycine data sets are in close proximity to the active site and 2 are within 4.5 Å of GIP (Figures 4 and 5).
DISCUSSION
We examined intra- and interspecific patterns of genetic variation for evidence of selection on EGases in five data sets comprising three taxonomic scales—within G. soja, among orthologs and paralogs within Glycine, and among dicots. Our results provide strong evidence for adaptive evolution of EGases at two of the three taxonomic levels examined. Codon evolution models that included terms for positively selected codons fit the data significantly better than those without this term for Glycine EGaseA, Glycine EGaseB, and a dicot data set that included both types of EGase, although tests were weaker for EGaseB and dicots. These results indicate that EGaseA and to a lesser extent EGaseB, sustain repeated advantageous mutations and that such mutations have occurred throughout the history of dicotyledonous plants.
Although the results provide clear evidence for diversifying selection, the Glycine and dicot data sets often include sequences from only one individual per species and thus cannot distinguish between repeated fixation of advantageous mutations (selective sweep model) and balancing selection combined with rare allele advantage. However, the near absence of intraspecific sequence variation for EGaseA and low levels of variation for EGaseB are inconsistent with a balancing selection model, which predicts elevated polymorphism relative to neutral expectations. Given the broad geographic range of the samples, the near absence of variation in G. soja is surprising, but it would be predicted in the event of a recent sweep to fixation of a favored allele. Given the possibility of widespread pathogen inocula associated with cultivated soybean, a recent species-wide sweep is plausible. Alternatively, neutral demographic patterns, such as a recent range expansion or high unidirectional gene flow between cultivated soybean and G. soja, are also plausible explanations. However, introgression between cultivated and wild soybeans has been measured and is insufficient to produce such swamping (Abe et al. 1999). Intraspecific sequence data for other nuclear protein-coding loci could assist in distinguishing between remaining neutral demographic and selective sweep hypotheses (see, for example, Tiffin 2004 and Tiffin and Gaut 2001). No such data are available for the genus Glycine, but several studies document high levels of variation at isozyme and other molecular marker loci in G. soja (Tozuka et al. 1998; Dong et al. 2001; Xu et al. 2001), suggesting that the low levels of variation observed for EGases and particularly for EGaseA may be unusual and indicative of a recent selective sweep.
The actual strength of selection acting on EGases is difficult to judge because relatively few proteins have been examined using codon evolution models. Selection is clearly weaker on EGases than on some class I chitinases and PGIPs, where ω > 1 even when averaged over all sites in the protein. The set of genes that has been analyzed using codon evolution models is dominated by those studied because of a priori expectations of strong selection, such as genes involved in defense, in avoiding immune response, or in mating systems. To put our results in context, we surveyed 33 genes for which codon evolution models found evidence of positive selection (at least one parameter ωi > 1). On average for these genes ω2 = 5.6, and ∼8% of codons were placed in the positively selected category (Bishop et al. 2000; Stotz et al. 2000; Yang et al. 2000; Ford 2001; Swanson et al. 2001; Götesson et al. 2002; Tiffin 2004). Glycine EGaseA had the third highest ω of all genes surveyed, but only a small proportion of sites (1.2%) were placed in this category. Dicot and EGaseB data sets have ω in the lower third of the distribution for positively selected genes, but the proportion of sites categorized as positively selected (5–9%) is near the mean.
Patterns of selection on defense genes likely vary depending on their role in defense and mechanism of action. For example, proteins that act earliest in a sequence of defense responses, such as R-proteins that detect pathogen-associated molecular patterns, may experience more intense or more frequently recurring selection than the array of downstream pathogenesis-related proteins that they induce. In the case of selection on EGase isozymes, EGaseA may experience more intense selection from pathogen countermeasures than EGaseB because of its apparent role in producing elicitors of further defense responses. The values of ω obtained here support this hypothesis.
Location of positively selected and highly variable residues:
Bayesian analysis of the codon evolution models identified 10 amino acid sites that had a high probability (P > 0.94) of sustaining repeated advantageous substitutions (Figures 4 and 5a). Several of these sites exhibit remarkable variability. For example, sites 9 and 289, which physically contact each other in the three-dimensional structure, present 15 amino acid combinations among the 21 sequences analyzed in the dicot data set (Figure 5, b and c). These residues form a ledge on the lip of the active site cleft across from catalytic residue Tyr33 and are predicted to interact with GIP1 in our docking model of P. sojae GIP1 and soybean EGaseA. Only two sites away, position 291 is similarly situated with respect to GIP1 but also physically contacts catalytic residue Glu295. Position 291 is occupied by 9 different amino acids among the 21 sequences. Overall, 5 of 10 positively selected sites (positions 9, 54, 183, 289, and 291) are located on the margin of or within the active site cleft (Figure 5, a and b). This pattern is counter to the usual expectation, wherein residues within the active site cleft are highly conserved.
Inspection of Figure 5, c and d, indicates that the most rapidly evolving sites appear as a “ring of fire” around the margin of the active site cleft, and statistically they are far more likely to interact with GIP1 than expected under an equitable distribution of highly variable sites throughout the enzyme. This contrasts with the distribution of silent changes, which shows no pattern with respect to bound GIP1. Similarly, positively selected sites were also more likely to contact bound GIP1 than expected by chance. Although most of the positively selected sites from the dicot data set were “missing data” in the Glycine data sets, one site, Ser150, was categorized as positively selected in both the EGaseB and the dicot data sets. Although this residue is external to the binding cleft, one loop of GIP1 is positioned directly over this site. The close proximity of rapidly evolving and positively selected sites to bound GIP strongly suggests an ongoing arms race between plant EGases and their pathogen-produced inhibitors. It will be of interest to examine variation in GIP for reciprocal evolutionary patterns and to test experimentally whether positively selected EGaseA residues modulate the interaction with GIP1 and its effects on glycanhydrolytic activity.
Summary:
Although the molecular genetic mechanisms of plant-pathogen interactions are rapidly becoming understood, elucidation of the coevolutionary processes that give rise to these mechanisms has come more slowly. Retrospective estimates of the strength and form of natural selection acting on a broad sample of the genes involved will characterize the distribution or hierarchy of response types and selection strengths, providing a richly informative context for coevolutionary models. Several competing, but not mutually exclusive, coevolutionary models have already been supported by such retrospective analyses. For example, the discovery that balancing selection maintains resistant and susceptible alleles at RPM1 and other resistance (R) genes in Arabidopsis prompted Stahl et al. to propose a “trench-warfare” model of interaction, in which the frequency of susceptible and resistant alleles cycles according to the population status of the pathogen and the cost of deploying resistant alleles (Stahl et al. 1999; Bergelson et al. 2001; Tian et al. 2002; Mauricio et al. 2003). The trench warfare model has been contrasted with an arms race model, wherein repeated selective sweeps are taken as evidence for ongoing counter adaptation. Other R-genes and a variety of loci involved in defense deployment exhibit this characteristic of an arms race (Bishop et al. 2000; Stotz et al. 2000; Bergelson et al. 2001; Tiffin and Gaut 2001; Mondragón-Palamino et al. 2002; De Meaux and Mitchell-Olds 2003; Tiffin 2004). Antagonistic coevolution of enzyme-inhibitor systems modulating plant-pathogen interactions may be particularly prone to arms race dynamics, although such races need not exclude reversion to previously advantageous allelic states. Indeed, likelihood reconstruction of ancestral sequences for the dicot phylogeny indicates that of 73 substitutions estimated to occur at the five positively selected sites contacting GIP, a remarkable 48% involve convergent evolution to the same residues (see supplementary Figure 5 at http://www.genetics.org/supplemental/). This is consistent with the idea that the number of possible adaptive substitutions is rather limited in enzyme-inhibitor systems, owing to the need to preserve enzymatic function and specificity. It may also indicate that distantly related dicot EGases are frequently evolving in response to highly similar antagonists.
Acknowledgments
This work was supported in part by funding from Washington State University and with the resources of the Cornell Theory Center. We thank M. Aguadé and two anonymous reviewers for comments on the manuscript.
Sequence data from this article have been deposited with EMBL/GenBank Data Libraries under accession nos. AY461847, AY466133, AY466134, AY466135, AY466136, AY466137, AY466138, AY466139, AY466140, AY466141, AY466142, AY466143, AY466144, AY466145, AY466146, AY466147, AY466148, AY466149, AY466150, AY466151, AY466152, AY466153, AY466154, AY466155, AY466156, AY468381, AY468382, AY468383, AY468384, AY468385, AY468386, AY468387, AY468388, AY468389, AY468390, AY468391, AY468392, AY468393, AY468394, AY468395, AY468396, AY468397, AY468398, AY468399, AY468400, AY468401, AY468402, AY468403, AY468404, AY468405, AY468406, AY468407, and AY628413, AY628414, AY628415.
References
- Abe, J., A. Hasegawa, H. Fukushi, T. M Ikami, M. Ohara et al., 1999. Introgression between wild and cultivated soybeans of Japan revealed by RFLP analysis for chloroplast DNAs. Econ. Bot. 53: 285–291. [Google Scholar]
- Albersheim, P., and B. S. Valent, 1974. Host-pathogen interactions. VII. Plant pathogens secrete proteins which inhibit enzymes of the host capable of attacking the pathogen. Plant Physiol. 53: 684–687. [DOI] [PMC free article] [PubMed] [Google Scholar]
- Anisimova, M., J. P. Bielawski and Z. Yang, 2001. Accuracy and power of the likelihood ratio test in detecting adaptive molecular evolution. Mol. Biol. Evol. 18: 1585–1592. [DOI] [PubMed] [Google Scholar]
- Anisimova, M., J. P. Bielawski and Z. Yang, 2002. Accuracy and power of Bayes prediction of amino acid sites under positive selection. Mol. Biol. Evol. 19: 950–958. [DOI] [PubMed] [Google Scholar]
- Bergelson, J., M. Kreitman, E. A. Stahl and D. Tian, 2001. Evolutionary dynamics of plant R-genes. Science 292: 2281–2284. [DOI] [PubMed] [Google Scholar]
- Bishop, J. G., A. M. Dean and T. Mitchell-Olds, 2000. Rapid evolution in plant chitinases: molecular targets of selection in plant-pathogen coevolution. Proc. Natl. Acad. Sci. USA 97: 5322–5327. [DOI] [PMC free article] [PubMed] [Google Scholar]
- Broglie, K., I. Chet, M. Holliday, R. Cressman, P. Biddle et al., 1991. Transgenic plants with enhanced resistance to the fungal pathogen Rhizoctonia solani. Science 254: 1194–1197. [DOI] [PubMed] [Google Scholar]
- Carpita, N. C., and D. M. Gibeaut, 1993. Structural models of primary cell walls in flowering plants: consistency of molecular structure with the physical properties of the walls during growth. Plant J. 3: 1–30. [DOI] [PubMed] [Google Scholar]
- Cheong, Y. H., C. Y. Kim, H. J. Chun, B. C. Moon, H. C. Park et al., 2000. Molecular cloning of a soybean class III β-1,3-glucanase gene that is regulated both developmentally and in response to pathogen infection. Plant Sci. 154: 71–81. [DOI] [PubMed] [Google Scholar]
- Côté, F., K.-S. Ham, M. G. Hahn and C. W. Bergmann, 1998. Oligosaccharide elicitors in host-pathogen interactions: generation, perception, and signal transduction. Subcell. Biochem. Plant-Microbe Interact. 29: 385–432. [DOI] [PubMed] [Google Scholar]
- Dangl, J. L., and J. D. G. Jones, 2001. Plant pathogens and integrated defence responses to infection. Nature 411: 826–833. [DOI] [PubMed] [Google Scholar]
- De Meaux, J., and T. Mitchell-Olds, 2003. Evolution of plant resistance at the molecular level: ecological context of species interactions. Heredity 91: 345–352. [DOI] [PubMed] [Google Scholar]
- de Vries, R. P., and J. Visser, 2001. Aspergillus enzymes involved in degradation of plant cell wall polysaccharides. Microbiol. Mol. Biol. Rev. 65: 497–522. [DOI] [PMC free article] [PubMed] [Google Scholar]
- Dellaporta, S. L., J. Wood and J. B. Hicks, 1985 Maize DNA miniprep, pp. 36–37 in Molecular Biology of Plants: A Laboratory Course Manual, edited by R. Malmberg, J. Messing and I. Sussex. Cold Spring Harbor Laboratory Press, Cold Spring Harbor, NY.
- Dong, Y. S., B. C. Zhuang, L. M. Zhao, H. Sun and M. Y. He, 2001. The genetic diversity of annual wild soybeans grown in China. Theor. Appl. Genet. 103: 98–103. [Google Scholar]
- Esquerre-Tugaye, M. T., G. Boudart and B. Dumas, 2000. Cell wall degrading enzymes, inhibitory proteins, and oligosaccharides participate in the molecular dialogue between plants and pathogens. Plant Physiol. Biochem. 38: 157–163. [Google Scholar]
- Felsenstein, J., 2001 PHYLIP (Phylogeny Inference Package). University of Washington, Seattle.
- Ford, M. J., 2001. Molecular evolution of transferrin: evidence for positive selection in salmonids. Mol. Biol. Evol. 18: 639–647. [DOI] [PubMed] [Google Scholar]
- Götesson, A., J. S. Marshall, D. A. Jones and A. R. Hardham, 2002. Characterization and evolutionary analysis of a large polygalacturonase gene family in the oomycete pathogen Phytophthora cinnamomi. Mol. Plant-Microbe Interact. 15: 907–921. [DOI] [PubMed] [Google Scholar]
- Grison, R., B. Grezes-Besset, M. Schneider, N. Lucante, L. Olsen et al., 1996. Field tolerance to fungal pathogens of Brassica napus constitutively expressing a chimeric chitinase gene. Nat. Biotechnol. 14: 643–656. [DOI] [PubMed] [Google Scholar]
- Ham, K., S. Wu, A. G. Darvill and P. Albersheim, 1997. Fungal pathogens secrete an inhibitor protein that distinguishes isoforms of plant pathogenesis-related endo-beta-1,3-glucanases. Plant J. 11: 169–179. [Google Scholar]
- Huelsenbeck, J. P., and F. Ronquist, 2001. MRBAYES: Bayesian inference of phylogeny. Bioinformatics 17: 754–755. [DOI] [PubMed] [Google Scholar]
- Jin, W., H. T. Horner, R. G. Palmer and R. C. Shoemaker, 1999. Analysis and mapping of gene families encoding beta-1,3-glucanases of soybean. Genetics 153: 445–452. [DOI] [PMC free article] [PubMed] [Google Scholar]
- Leubner-Metzger, G., and F. Meins, Jr., 1999 Functions and regulation of plant β-1,3-glucanases (PR-2), pp. 49–76 in Pathogenesis Related Proteins in Plants, edited by S. K. Datta and S. Muthukrishnan. CRC Press LLC, Boca Raton, FL.
- Lev, S., and B. A. Horwitz, 2003. A mitogen-activated protein kinase pathway modulates the expression of two cellulase genes in Cochliobolus heterostrophus during plant infection. Plant Cell 15: 835–844. [DOI] [PMC free article] [PubMed] [Google Scholar]
- Londershausen, M., A. Turberg, B. Bieseler, M. Lennartz and M. G. Peter, 1996. Characterization and inhibitor studies of chitinases from a parasitic blowfly (Lucilia cuprina), a tick (Boophilus microplus), an intestinal nematode (Haemonchus contortus) and a bean (Phaseolus vulgaris). Pestic. Sci. 48: 305–314. [Google Scholar]
- Mauricio, R., E. A. Stahl, T. Korves, D. Tian, M. Kreitman et al., 2003. Natural selection for polymorphism in the disease resistance gene Rps2 of Arabidopsis thaliana. Genetics 163: 735–746. [DOI] [PMC free article] [PubMed] [Google Scholar]
- Mondragón-Palamino, M., B. Meyers, R. W. Michelmore and B. S. Gaut, 2002. Patterns of positive selection in the complete NBS-LRR gene family in Arabidopsis thaliana. Genet. Res. 12: 1305–1315. [DOI] [PMC free article] [PubMed] [Google Scholar]
- Müller, J. J., K. K. Thomsen and U. Heinemann, 1998. Crystal structure of barley 1,3–1,4-β-glucanase at 2.0 Å resolution and comparison with Bacillus1,3–1,4-β-glucanases. J. Biol. Chem. 273: 3438–3446. [DOI] [PubMed] [Google Scholar]
- O'Neill, M. A., and W. S. York, 2003 The composition and structure of plant primary walls, pp. 1–54 in The Plant Cell Wall, edited by J. Rose. Blackwell Publishing, Oxford.
- Qin, Q., C. W. Bergmann, J. K. C. Rose, M. Saladie, V. S. Kumar Kolli et al., 2003. Characterization of a tomato protein that inhibits a xyloglucan-specific endoglucanase. Plant J. 34: 327–338. [DOI] [PubMed] [Google Scholar]
- Reiter, W.-D., 2002. Biosynthesis and properties of the plant cell wall. Curr. Opin. Plant Biol. 5: 536–542. [DOI] [PubMed] [Google Scholar]
- Ridley, B. L., M. A. O'Neill and D. Mohnen, 2001. Pectins: structure, biosynthesis, and oligogalacturonide-related signaling. Phytochemistry 57: 919–967. [DOI] [PubMed] [Google Scholar]
- Rose, J. K. C., K.-S. Ham, A. G. Darvill and P. Albersheim, 2002. Molecular cloning and characterization of glucanase inhibitor proteins: coevolution of a counterdefense mechanism by plant pathogens. Plant Cell 14: 1329–1345. [DOI] [PMC free article] [PubMed] [Google Scholar]
- Sali, A., and T. L. Blundell, 1993. Comparative protein modelling by satisfaction of spatial constraints. J. Mol. Biochem. 234: 779–815. [DOI] [PubMed] [Google Scholar]
- Sali, A., L. Potterton, F. Yuan, H. van Vlijmen and M. Karplus, 1995. Evaluation of comparative protein modeling by MODELLER. Proteins 23: 318–326. [DOI] [PubMed] [Google Scholar]
- Somssich, I. E., and K. Hahlbrock, 1998. Pathogen defense in plants—a paradigm of biological complexity. Trends Plant Sci. 3: 86–90. [Google Scholar]
- Stahl, E. A., and J. G. Bishop, 2000. Plant-pathogen arms races at the molecular level. Curr. Opin. Plant Biol. 3: 299–304. [DOI] [PubMed] [Google Scholar]
- Stahl, E. A., G. Dwyer, R. Mauricio, M. Kreitman and J. Bergelson, 1999. Dynamics of disease resistance polymorphism at the RPM1 locus of Arabidopsis. Nature 400: 667–671. [DOI] [PubMed] [Google Scholar]
- Stotz, H. U., J. G. Bishop, C. W. Bergmann, M. Koch, P. Albersheim et al., 2000. Identification of target amino acids that affect interactions of fungal polygalacturonases and their plant inhibitors. Mol. Physiol. Plant Pathol. 56: 117–130. [Google Scholar]
- Swanson, W. J., Z. Yang, M. F. Wolfner and C. F. Aquadro, 2001. Positive Darwinian selection drives the evolution of several female reproductive proteins in mammals. Proc. Natl. Acad. Sci. USA 98: 2509–2514. [DOI] [PMC free article] [PubMed] [Google Scholar]
- Takeuchi, Y., M. Yoshikawa, G. Takeba, K. Tanaka, D. Shibata et al., 1990. Molecular cloning and ethylene induction of mRNA encoding a phytoalexin elicitor-releasing factor, β-1,3-endoglucanase. Plant Physiol. 93: 673–682. [DOI] [PMC free article] [PubMed] [Google Scholar]
- Tian, D., H. Araki, E. A. Stahl, J. Bergelson and M. Kreitman, 2002. Signature of balancing selection in Arabidopsis. Proc. Natl. Acad. Sci. USA 99: 11525–11530. [DOI] [PMC free article] [PubMed] [Google Scholar]
- Tiffin, P., 2004. Comparative evolutionary histories of chitinase genes in the genus Zea and family Poaceae. Genetics 167: 1331–1340. [DOI] [PMC free article] [PubMed] [Google Scholar]
- Tiffin, P., and B. S. Gaut, 2001. Molecular evolution of the wound-induced serine protease inhibitor wip1 in Zea and related genera. Mol. Biol. Evol. 18: 2092–2101. [DOI] [PubMed] [Google Scholar]
- Tozuka, A., H. Fukushi, T. Hirata, M. Ohara, A. Kanazawa et al., 1998. Composite and clinal distribution of Glycine soja in Japan revealed by RFLP analysis of mitochondrial DNA. Theor. Appl. Genet. 96: 170–176. [Google Scholar]
- Varghese, J. N., T. P. J. Garrett, P. M. Colman, L. Chen, P. B. Hoj et al., 1994. Three-dimensional structures of two plant beta-glucan endohydrolases with distinct substrate specificities. Proc. Natl. Acad. Sci. USA 91: 2785–2789. [DOI] [PMC free article] [PubMed] [Google Scholar]
- Walton, J. D., 1994. Deconstructing the cell wall. Plant Physiol. 104: 1113–1118. [DOI] [PMC free article] [PubMed] [Google Scholar]
- Xu, D. H., J. Abe, A. Kanazawa, J. Y. Gai and Y. Shimamoto, 2001. Identification of sequence variations by PCR-RFLP and its application to the evaluation of cpDNA diversity in wild and cultivated soybeans. Theor. Appl. Genet. 102: 683–688. [Google Scholar]
- Yang, Z., S. Kumar and M. Nei, 1995. A new method of inferene of ancestral nucleotide and amino acid sequences. Genetics 141: 1641–1650. [DOI] [PMC free article] [PubMed] [Google Scholar]
- Yang, Z., R. Nielsen, N. Goldman and A.-M. Krabbe Pedersen, 2000. Codon-substitution models for heterogenous selection pressure at amino acid sites. Genetics 155: 431–449. [DOI] [PMC free article] [PubMed] [Google Scholar]
- York, W. S., Q. Qin and J. K. C. Rose, 2004. Proteinaceous inhibitors of endo-β-glucanases. Biochim. Biophys. Acta 1696: 223–233. [DOI] [PubMed] [Google Scholar]
- Yoshikawa, M., Y. Takeuchi and O. Horino, 1990. A mechanism for ethylene-induced disease resistance in soybean: enhanced synthesis of an elicitor-releasing factor, β-1,3-endoglucanase. Physiol. Mol. Plant Pathol. 37: 367–376. [Google Scholar]


