Abstract
Objectives. We describe a method to facilitate routine monitoring of socioeconomic health disparities in the United States.
Methods. We analyzed geocoded public health surveillance data including events from birth to death (c. 1990) linked to 1990 census tract (CT) poverty data for Massachusetts and Rhode Island.
Results. For virtually all outcomes, risk increased with CT poverty, and when we adjusted for CT poverty racial/ethnic disparities were substantially reduced. For half the outcomes, more than 50% of cases would not have occurred if population rates equaled those of persons in the least impoverished CTs. In the early 1990s, persons in the least impoverished CT were the only group meeting Healthy People 2000 objectives a decade ahead.
Conclusions. Geocoding and use of the CT poverty measure permit routine monitoring of US socioeconomic inequalities in health, using a common and accessible metric.
The extent of US socioeconomic inequalities in health and their contribution to racial/ethnic health disparities is poorly documented and cannot readily be monitored, given the lack of socioeconomic data in most US public health surveillance systems, apart from educational level in the birth and death certificates.1,2 This failure to include socioeconomic data severely impedes efforts to understand, routinely monitor, and address social disparities in health in the United States. Because of an absence of baseline data, 70% of the 467 US public health objectives for the year 2010 lack socioeconomic targets.3
The critical importance of documenting the social patterning of disease and death has been recognized since the rise of the public health movement in the mid-19th century,4 and such documentation is of national and global significance.1,5 As Sydenstricker noted when establishing the first US population-based morbidity studies in the 1920s, data on the social patterns of health are crucial to “give glimpses of what the sanitarian has long wanted to see—a picture of the public-health situation as a whole, drawn in proper perspective and painted in true colors.”6(p280) These health statistics, generated through cycles of ongoing data collection, analysis, interpretation, and dissemination,1 not only provide vital information about the population burden of disease, relevant for allocation of resources, but also provide critical stimuli for—and tests of—etiologic hypotheses about disease causation.7
Yet in contrast to Europe, where health statistics have routinely included socioeconomic data,4,5 in the United States, most public health surveillance systems have not collected data on socioeconomic factors as they have on race/ethnicity.1,2 The net effect has been to remove from view—and from policy discourse—the pervasive patterning of US health disparities by socioeconomic position within and across racial/ethnic groups, as well as to retard understanding of the contribution of economic and noneconomic aspects of racial discrimination to US racial/ ethnic health disparities.8–10
To address this gap, we employed a methodology rigorously validated in the United States for the first time by our Public Health Disparities Geocoding Project.11–14 Our approach builds on a technique eclectically employed in US health research for more than 75 years15–17 and increasingly used in European research during the past 25 years18,19: that of categorizing individuals—both cases and the population from which they arise—in relation to the socioeconomic characteristics of the immediate area in which they reside. Our objective was to demonstrate the feasibility and salience of augmenting US public health surveillance systems with socioeconomic data, both to quantify socioeconomic inequalities in health and to investigate their contribution to racial/ethnic disparities in health and to hampering attainment of Healthy People objectives.3,20
METHODS
Population and Health Outcomes
As described previously,11–14 the study base comprised populations and areas in Massachusetts and Rhode Island enumerated in the 1990 census, corresponding health outcomes proximate to the 1990 census, and 1990 census–derived socioeconomic data. We obtained public health surveillance data from the Massachusetts Department of Public Health21 and the Rhode Island Department of Health22 for births (1989–1991), childhood lead poisoning (Rhode Island only; children 1–5 years old, 1994–1996), sexually transmitted infections (STIs; 1994–1998), tuberculosis (TB; 1993–1999), nonfatal weapons-related injuries (Massachusetts only, 1995–1997), cancer incidence (1998–1992), and all-cause and cause-specific mortality (1989–1991), thereby encompassing most of the Healthy People 2000 consensus health status indicators.20 Because of the similarity of results, we report only data for Massachusetts, except for the childhood lead poisoning data from Rhode Island. (Other Rhode Island data are available on request.) Reporting of all these health outcomes is mandatory.21,22 Use of these data was approved by all relevant institutional review boards at the Harvard School of Public Health, the Massachusetts Department of Public Health, and the Rhode Island Department of Health.
During the study period, case ascertainment was 100% for births and deaths, exceeded 90% for cancer incidence, and was based on mandatory universal childhood lead screening in Rhode Island.11,12,21,22 Case ascertainment for nonfatal weapons-related injuries was based on mandatory reporting from all Massachusetts acute care hospital emergency departments and was estimated to be at least 80% complete.13,21 Case ascertainment of persons with TB was based on mandatory reporting via designated TB clinics and additional health care providers.13,21,22 Similarly, case ascertainment for STIs was based on mandatory reporting of persons who were symptomatic patients, sought testing because they were concerned about their exposure (i.e., after unsafe sex), received a complete battery of STI tests as part of seeking confidential HIV testing, were sexual partners of current cases, or were tested in the course of routine gynecological examinations. Data from Massachusetts indicated that case ascertainment during the study period was approximately 90% for syphilis but lower for chlamydia.13,21
Data for low birthweight (< 2500 g), childhood lead poisoning (blood lead levels ≥ 10 μg/dL), cancer incidence, and death were analyzed for persons.11,12 Data for TB, STIs, and nonfatal gun injuries (accounting for 97% of all the weapons-related injuries) were analyzed for new occurrences on a case basis, with data protocols excluding multiple reports of any given case.13 Data for lead poisoning were restricted to venous specimens and were analyzed for a child’s first record in the study interval.12 Analyses of low birth-weight were restricted to singleton births among mothers aged 15 to 55 years.12 Cancer type was categorized by standard Surveillance, Epidemiology, and End Results (SEER) site/histology definitions, and cause of death was categorized by International Classification of Diseases, Ninth Revision (ICD-9) codes.11
Slightly more than 760000 records were included in our final analytic data sets, restricted to records for in-state residents with known age and gender and with the identified health outcome occurring during the specified study interval; for details, see our previous publications.11–14 Fully 98% of these records were geocoded to the census tract (CT) level by a commercial geocoding firm with verified high accuracy (96%).23 CTs on average contain 4000 persons and are designed by the US Census Bureau “to be relatively homogenous with respect to population characteristics.”24(ppG-10,G-11)
Data on race/ethnicity, gender, and age were obtained by self-report for the 1990 census25 and birth certificate data and by parent’s report for the childhood lead poisoning data.12,21,22 They were obtained by a mixture of self-report and observer report for the STI, TB, and injury cases13,21,22; abstracted by registry staff from medical records for the cancer data11,21,22; and reported by next of kin or recorded by the funeral director for the death data.11,21,22 Because databases variously used 1 or 2 fields for race and Hispanic origin,14,21,22 we conducted separate analyses for the White and Black populations and for the Hispanic population (including persons of all census-designated “races”). Analyses for the American Indian and the Asian and Pacific Islander American populations (comprising slightly more than 2% of the Massachusetts and Rhode Island population) were restricted to low birthweight and premature mortality, owing to the small sample size. In this study, we conceptualized “race/ethnicity” as a social variable critical to shaping social disparities in health8–10,14,26; we recognized, however, that reliance on different data sources precluded use of identically measured racial/ethnic data across all outcomes, a limitation common to US public health surveillance data.1
Percentage of Persons in Census Tract Living Below Poverty Level
The area-based socioeconomic measure selected for analysis was the CT poverty level. For 1990 census data, the poverty line (which varies by household size and age composition) equaled $12 647 for a family of 2 adults and 2 children.25 We chose this measure on the basis of our previous research,11–14 which demonstrated that this measure consistently detected expected socioeconomic gradients in health across a wide range of health outcomes, both in the total population and among diverse racial/ ethnic–gender groups; yielded maximal geocoding and linkage to area-based socioeconomic data (compared with block group and zip code data); and was readily interpretable and could feasibly be used by state health department staffs. On the basis of previous analyses,11–14 a priori cut-points for percentage of persons living below poverty level equaled 0% to 4.9%, 5.0% to 9.9%, 10.0% to 19.9%, and 20% or more (the federal definition of a “poverty area”).27
Data Analysis
Our analysis involved 5 steps. All analyses were conducted in SAS.28 In step 1, we determined the number of cases and population size in each CT poverty stratum, overall and stratified by age, gender, and race/ethnicity. In step 2, we calculated the relevant age-standardized average annual incidence rate or proportion (for low birthweight and childhood lead poisoning), stratified by the CT-level poverty measure.29 For age standardization, we employed the Year 2000 standard million,29 using 5 age groups (0–14, 15–24, 25–44, 45–64, and ≥ 65 years). Following standard practice for rates centered around a census,30 we set the total number of person-years in the denominator equal to the population in that socioeconomic stratum enumerated in the 1990 census multiplied by the relevant number of years of observation. In step 3, we compared these rates with Healthy People 2000 goals,20 where applicable.
In step 4, we quantified and graphed each outcome’s socioeconomic gradient, overall and stratified by race/ethnicity and gender, computing the incidence rate ratio or odds ratio, as warranted, comparing persons living in the most impoverished CTs with persons living in the least impoverished CTs. We also calculated the population attributable fraction (PAF), which refers to the proportion of cases that would not have occurred if the risk of all persons equaled that of persons in the referent group.31 The referent group was defined in our study as persons residing in CTs with fewer than 5% of persons living below poverty. For each outcome, the overall PAF equaled the weighted average of the relevant age-specific PAF, with weights defined by the proportion of cases in each stratum.31 Finally, in step 5, we explored the contribution of socioeconomic inequalities in health to age-adjusted racial/ethnic health disparities by additionally adjusting for CT poverty, using Poisson regression models.
RESULTS
Table 1 ▶ presents data on the Massachusetts study base as enumerated in the 1990 census. Approximately 6 million persons were enumerated, as were 1331 census tracts (average population size = 4572 persons). Nearly half the White population (90% of Massachusetts residents) lived in CTs with fewer than 5% of persons living below poverty level; more than half the Black and Hispanic populations lived in CTs with 20% or more of persons living below poverty level.
TABLE 1—
Distribution of Population, by Race/Ethnicityaand Census Tract (CT) Poverty Level: Massachusetts, 1990
| % Distribution by CT Poverty Levelb | ||||||
| n | % of Total Population | Poverty 0.0%–4.9% | Poverty 5.0%–9.9% | Poverty 10.0%–19.9% | Poverty ≥ 20.0% | |
| Total | 6 016 425 | 100.0 | 42.3 | 30.5 | 15.4 | 11.8 |
| White | 5 411 774 | 89.9 | 45.5 | 32.0 | 14.8 | 7.7 |
| Black | 297 006 | 4.9 | 9.2 | 16.7 | 23.7 | 50.4 |
| Hispanic | 275 859 | 4.6 | 10.1 | 16.2 | 20.7 | 53.0 |
| Asian/Pacific Islander | 140 745 | 2.3 | 28.3 | 24.2 | 18.4 | 29.1 |
| American Indian | 12 585 | 0.2 | 23.4 | 31.5 | 18.7 | 26.5 |
a The census-designated racial categories (White, Black, Asian and Pacific Islander, and American Indian) include persons of Hispanic and non-Hispanic origin, and the Hispanic category includes persons of all census-designated races. In the 1990 census, 98% of the White population and 92% of the Black population in Massachusetts self-identified as non-Hispanic.
b The percentage of each population group for which data on CT poverty levels was missing was very low (total, 0.07%; White, 0.07%; Black, 0.06%; Hispanic, 0.05%; Asian/Pacific Islander, 0.03%; American Indian, 0.16%). Additionally, the percentage distribution by poverty was virtually identical among women and men within each racial/ethnic group; thus percentages are not reported separately by gender.
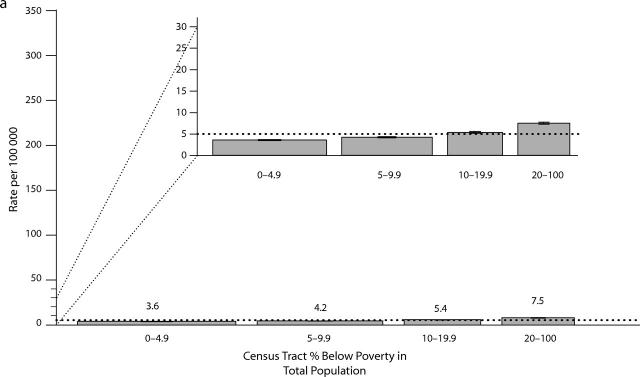
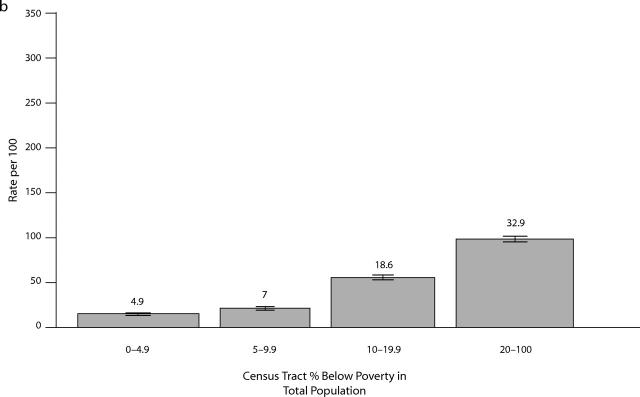
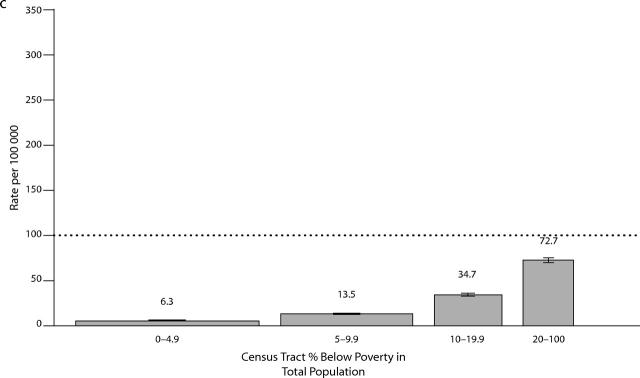
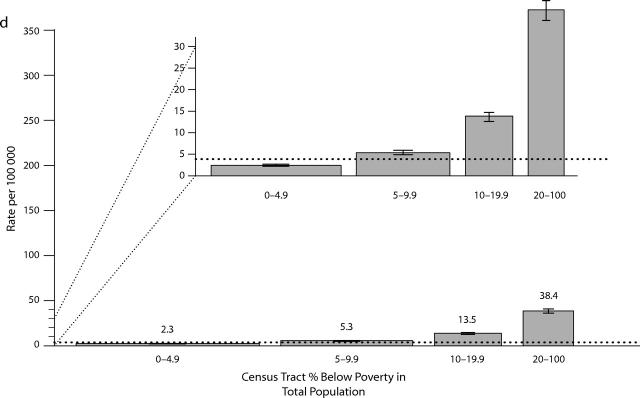
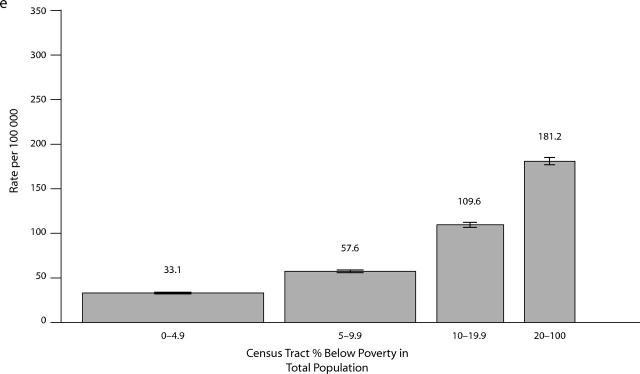
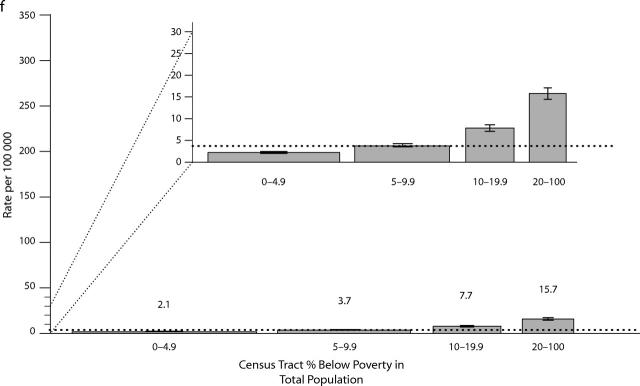
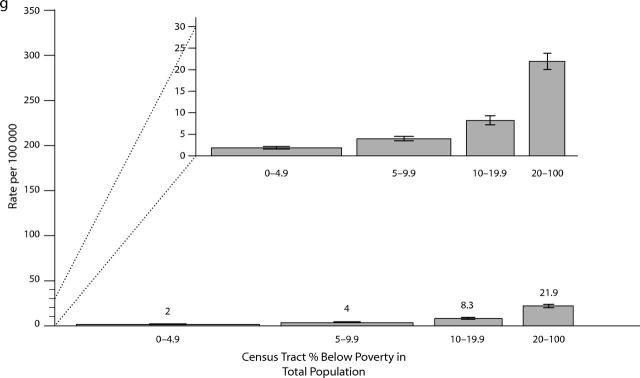
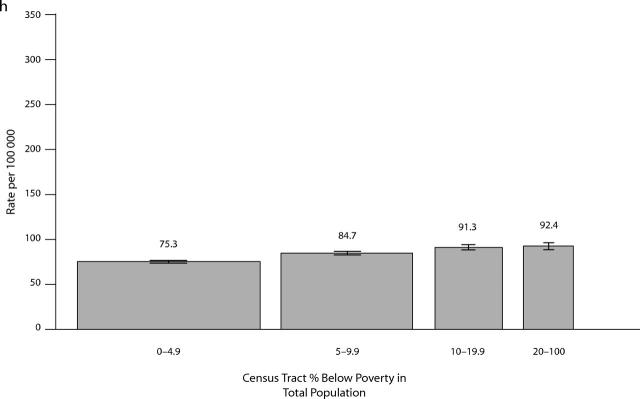
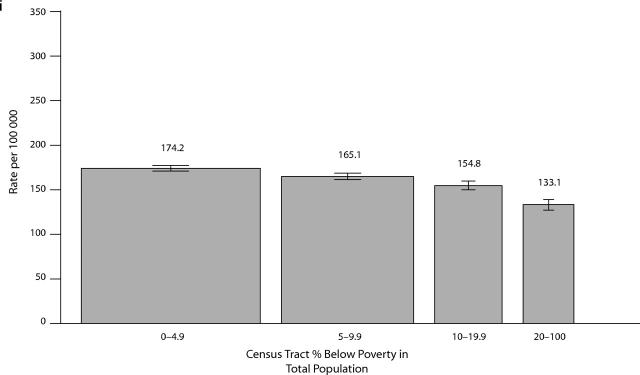
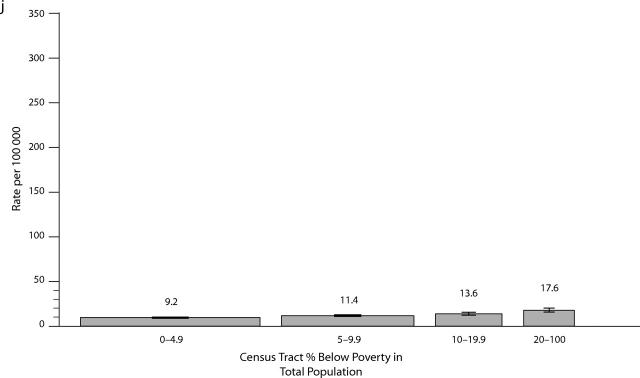
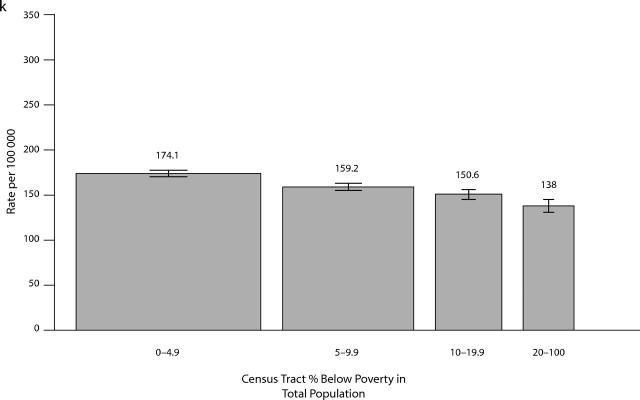
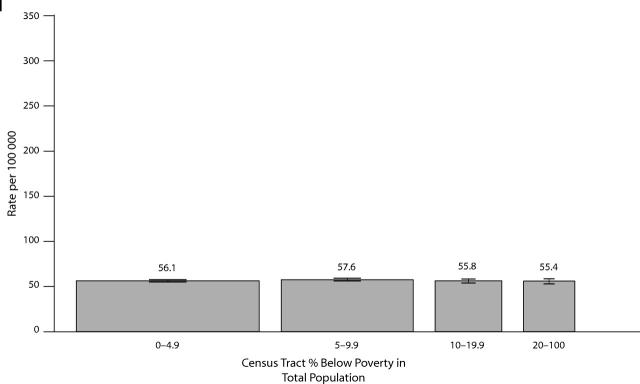
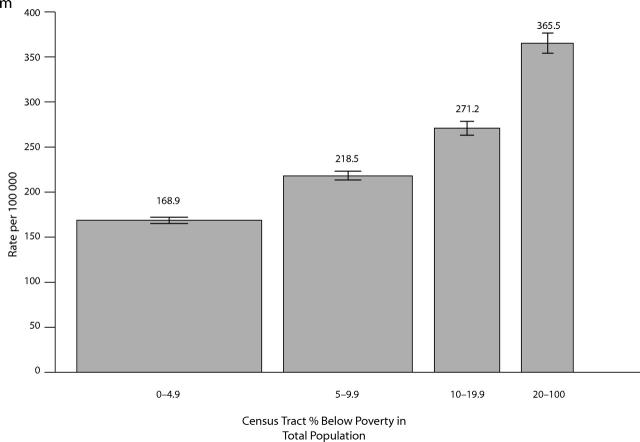
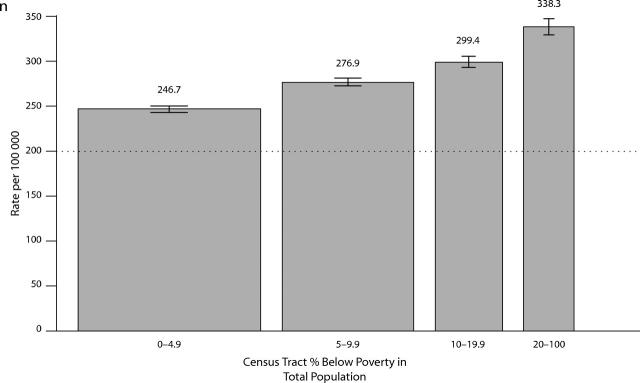
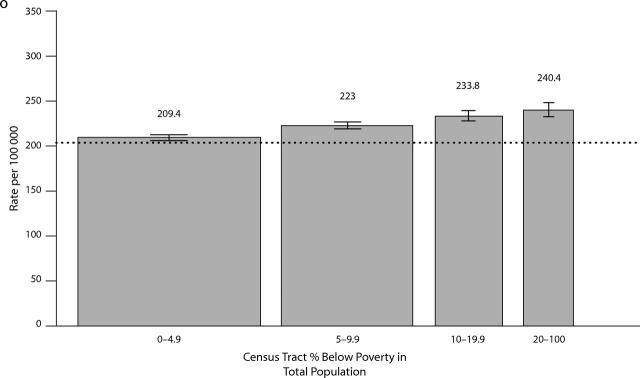
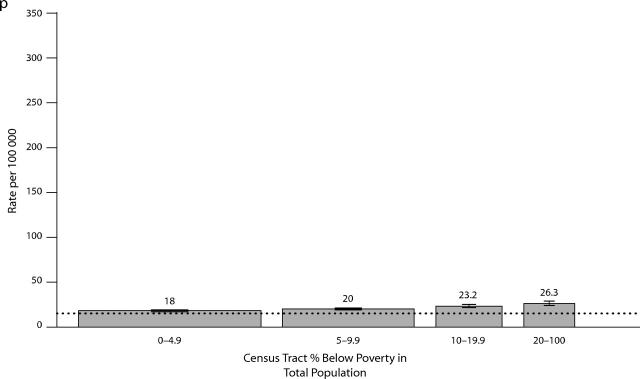
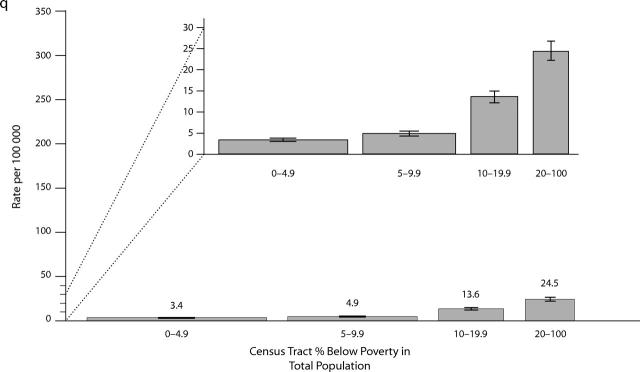
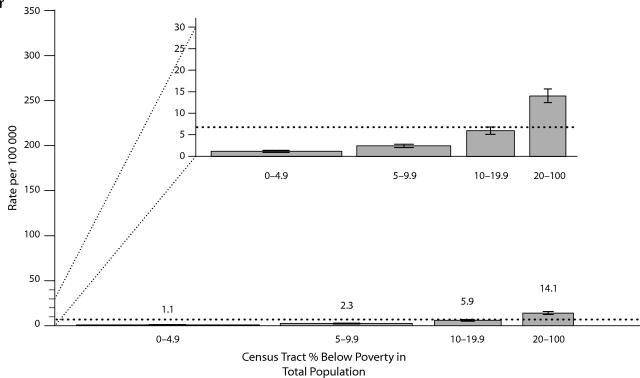
Figure 1 ▶ presents rates for each outcome, stratified by CT poverty, plus data on the Healthy People 2000 objectives as relevant, for the total population. (An additional figure showing data stratified by gender and race/ethnicity is available as a supplement to the online version of this article at http://www.ajph.org.) Using a graphical format,32 which we have newly applied to routinely collected US state health department data,11–13 we set the width of each bar to be proportional to the size of the population in the specified socioeconomic stratum. Table 2 ▶ provides corresponding data on the population base for these rates, the rate ratio comparing persons in the most impoverished CT with those in the least impoverished CT, the test for trend across all poverty strata, and the PAF.
FIGURE 1—
Socioeconomic gradients for (a–b) childhood outcomes (% low birthweight, childhood lead poisoning), (c–g) infectious disease and injury (gonorrhea, syphilus, chlamydia, tuberculosis, gunshot wounds), (h–l) cancer incidence (lung, breast, cervical, prostate, colon), and (m–r) mortality for the total population (premature, heart disease, cancer, diabetes, HIV, homicide), with age-standardized rates stratified by census tract poverty and compared with relevant Healthy People 2000 objectives: Massachusetts (all outcomes except childhood lead poisoning) and Rhode Island (childhood lead poisoning only), circa 1990.
Note. All rates were age-standardized using the Year 2000 standard million, except for the childhood health outcomes (low birthweight and lead poisoning). In each graph, the height of the bar equals the rate, while the width is proportional to the size of the population in the socioeconomic stratum. Rates based on fewer than 5 cases were suppressed, owing to unreliability of the estimates. The original Healthy People 2000 mortality baseline rates and targets were age-standardized to the 1940 standard million; to make them compatible with rates age-standardized to the Year 2000 standard million, we restandardized the Healthy People 2000 baseline mortality rates to the Year 2000 standard million and applied the percentage reduction used to set the original target rate to generate an equivalent target age-standardized to the Year 2000 standard million. Data on childhood lead poisoning are from Rhode Island, 1994–1996. All other data are from Massachusetts: births, 1989–1991; sexually transmitted infections and tuberculosis, 1993–1998; nonfatal gun-related injuries, 1995–1997; cancer incidence, 1988–1992; mortality, 1989–1991.
TABLE 2—
Rate Ratiosaand Population Attributable Fractions (PAFs) for Census Tract Poverty for Selected Health Outcomes (Total Population), by Race/Ethnicityband Gender: Massachusetts, Circa 1990
| No. Cases | No. in Population | RR (95% CI) | Test for Trend, P | PAF, % | |
| Childhood outcomes, per 100 population | |||||
| Low birthweight (1989–1991) | |||||
| Total | 11 369 | 228 177 | 2.2 (2.1, 2.3) | < .0001 | 24.2 |
| Girls | |||||
| White | 3 944 | 92 343 | 1.7 (1.5, 1.8) | < .0001 | 12.5 |
| Black | 1 071 | 9 562 | 1.1 (0.8, 1.4) | .0005 | < 0 |
| Hispanic | 784 | 12 568 | 1.9 (1.4, 2.6) | < .0001 | 37.8 |
| API | 997 | 15 529 | 1.6 (1.3, 2.0) | .1889 | 18.5 |
| American Indian | 22 | 232 | 1.4 (0.4, 5.7) | .8472 | 18.9 |
| Boys | |||||
| White | 3 653 | 97 752 | 1.8 (1.6, 2.0) | < .0001 | 13.9 |
| Black | 875 | 9 810 | 1.5 (1.1, 2.0) | .0024 | 23.5 |
| Hispanic | 737 | 13 214 | 1.7 (1.3, 2.3) | < .0001 | 32.7 |
| API | 910 | 16 370 | 1.6 (1.2, 2.0) | .7836 | 26.9 |
| American Indian | 12 | 228 | 0.6 (0.1, 2.3) | .7681 | < 0 |
| Childhood lead poisoning c | |||||
| Total | 4 727 | 29 092 | 9.5 (8.5, 10.6) | < .0001 | 69.8 |
| Girls | |||||
| White | 544 | 6 731 | 11.5 (8.6, 15.3) | < .0001 | 59.6 |
| Black | 367 | 1 010 | 2.8 (1.5, 5.0) | < .0001 | 40.2 |
| Hispanic | 652 | 2 516 | 1.7 (0.9, 3.5) | < .0001 | 24.3 |
| Boys | |||||
| White | 708 | 7 148 | 8.1 (6.3, 10.4) | < .0001 | 46.6 |
| Black | 388 | 1 038 | 5.5 (2.4, 12.3) | < .0001 | 66.0 |
| Hispanic | 689 | 2 533 | 8.1 (1.9, 33.6) | < .0001 | 81.6 |
| Infectious disease and injury, new cases per 100 000 population | |||||
| Gonorrhea (1994–1998) | |||||
| Total | 7 160 | 30 062 385 | 11.5 (10.6, 12.4) | < .0001 | 71.0 |
| Women | |||||
| White | 701 | 14 091 505 | 5.3 (4.3, 6.6) | < .0001 | 47.0 |
| Black | 991 | 769 840 | 2.1 (1.5, 2.9) | < .0001 | 47.3 |
| Hispanic | 479 | 705 440 | 2.1 (1.4, 3.3) | .0002 | 48.3 |
| Men | |||||
| White | 966 | 12 949 145 | 5.8 (4.8, 6.9) | < .0001 | 44.7 |
| Black | 1 208 | 714 345 | 2.7 (2.0, 3.6) | < .0001 | 57.1 |
| Hispanic | 558 | 673 185 | 3.3 (2.1, 5.1) | < .0001 | 63.6 |
| Syphilis (1994–1998) | |||||
| Total | 2 615 | 30 062 385 | 16.9 (14.9, 19.3) | < .0001 | 72.7 |
| Women | |||||
| White | 128 | 14 091 505 | 4.1 (2.4, 6.8) | < .0001 | 33.8 |
| Black | 394 | 769 840 | 1.1 (0.7, 1.7) | .0385 | 19.7 |
| Hispanic | 313 | 705 440 | 4.3 (2.3, 8.1) | < .0001 | 66.9 |
| Men | |||||
| White | 198 | 12 949 145 | 3.3 (2.1, 5.2) | < .0001 | 39.3 |
| Black | 534 | 714 345 | 1.5 (1.0, 2.2) | .3885 | 33.6 |
| Hispanic | 533 | 673 185 | 1.4 (1.0, 2.0) | .0002 | 9.7 |
| Chlamydia (1994–1998) | |||||
| Total | 24 510 | 30 062 385 | 5.5 (5.3, 5.7) | < .0001 | 55.5 |
| Women | |||||
| White | 5 814 | 14 091 505 | 2.3 (2.1, 2.5) | < .0001 | 29.9 |
| Black | 3 104 | 769 840 | 1.3 (1.1, 1.5) | .0376 | 20.8 |
| Hispanic | 3 892 | 705 440 | 2.2 (1.9, 2.6) | < .0001 | 51.0 |
| Men | |||||
| White | 734 | 12 949 145 | 2.3 (1.8, 2.9) | < .0001 | 33.1 |
| Black | 1 061 | 714 345 | 1.8 (1.4, 2.3) | .0003 | 38.7 |
| Hispanic | 689 | 673 185 | 2.4 (1.7, 3.5) | .0103 | 53.7 |
| Tuberculosis (1993–1998) | |||||
| Total | 1 776 | 36 074 862 | 7.6 (6.6, 8.7) | < .0001 | 56.5 |
| Women | |||||
| White | 283 | 16 909 806 | 5.8 (4.1, 8.4) | < .0001 | 40.9 |
| Black | 207 | 923 808 | 0.9 (0.5, 1.4) | .0956 | < 0 |
| Hispanic | 92 | 846 528 | 3.4 (1.2, 9.6) | .9689 | 54.4 |
| Men | |||||
| White | 485 | 15 538 974 | 8.1 (6.3, 10.5) | < .0001 | 48.1 |
| Black | 273 | 857 214 | 2.7 (1.2, 5.8) | .4877 | 69.8 |
| Hispanic | 153 | 807 822 | 2.1 (1.0, 4.6) | .0810 | 41.4 |
| Nonfatal weapons-related injuries (1995–1997) | |||||
| Total | 1 247 | 18 037 431 | 11.2 (9.4, 13.4) | < .0001 | 70.4 |
| Women | |||||
| White | 39 | 8 454 903 | 4.3 (1.7, 11.0) | .0051 | 44.8 |
| Black | 40 | 461 904 | 1.2 (0.3, 3.9) | .8912 | 5.1 |
| Hispanic | 18 | 423 264 | . . . | .0503 | 100 |
| Men | |||||
| White | 308 | 7 769 487 | 1.9 (1.3, 2.8) | .0002 | 23.0 |
| Black | 430 | 428 607 | 4.7 (2.6, 8.6) | < .0001 | 73.4 |
| Hispanic | 252 | 403 911 | 6.0 (2.6, 13.6) | < .0001 | 78.9 |
| Cancer incidence (1988–1992), cases per 100 000 population | |||||
| Lung cancer | |||||
| Total | 24 160 | 30 062 385 | 1.2 (1.2, 1.3) | < .0001 | 5.9 |
| Women | |||||
| White | 9 345 | 14 091 505 | 1.3 (1.2, 1.4) | < .0001 | 5.3 |
| Black | 207 | 769 840 | 0.7 (0.5, 1.1) | .1342 | < 0 |
| Men | |||||
| White | 13 584 | 12 949 145 | 1.5 (1.4, 1.6) | < .0001 | 11.8 |
| Black | 430 | 714 345 | 0.9 (0.7, 1.3) | .0718 | < 0 |
| Breast cancer (women) | |||||
| Total | 9 468 | 15 642 450 | 0.7 (0.7, 0.8) | < .0001 | < 0 |
| White | 8 905 | 14 091 505 | 0.9 (0.8, 0.9) | < 0.0001 | < 0 |
| Black | 214 | 769 840 | 0.7 (0.5, 0.9) | .0001 | < 0 |
| Cervical cancer (women) | |||||
| Total | 1 835 | 15 642 450 | 1.7 (1.6, 2.2) | < .0001 | 21.6 |
| White | 1 533 | 14 091 505 | 1.8 (1.5, 2.2) | < .0001 | 13.8 |
| Black | 100 | 769 840 | 1.5 (0.7, 3.3) | .0124 | 16.3 |
| Prostate cancer (men) | |||||
| Total | 19 935 | 14 419 935 | 0.7 (0.7, 0.8) | < .0001 | < 0 |
| White | 18 499 | 12 949 145 | 0.8 (0.7, 0.8) | < .0001 | < 0 |
| Black | 604 | 714 345 | 0.8 (0.6, 1.0) | < .0001 | < 0 |
| Colon cancer | |||||
| Total | 17 264 | 30 062 385 | 1.0 (0.9, 1.0) | .9498 | 0.2 |
| Women | |||||
| White | 8 609 | 14 091 505 | 1.0 (0.9, 1.1) | .8109 | < 0 |
| Black | 200 | 769 840 | 0.7 (0.5, 1.1) | .5714 | < 0 |
| Men | |||||
| White | 7 744 | 12 949 145 | 1.2 (1.1, 1.3) | .0002 | 3.3 |
| Black | 176 | 714 345 | 0.5 (0.3, 0.8) | < .0001 | < 0 |
| Mortality (1989–1991), cases per 100 000 population | |||||
| Premature mortality | |||||
| Total | 35 394 | 15 578 889 | 2.2 (2.1, 2.2) | < .0001 | 22.5 |
| Women | |||||
| White | 11 245 | 6 987 483 | 1.8 (1.6, 1.9) | < .0001 | 13.2 |
| Black | 1 047 | 426 666 | 1.9 (1.4, 2.6) | < .0001 | 20.2 |
| Hispanic | 397 | 408 834 | 2.8 (1.6, 5.1) | < .0001 | 83.4 |
| API | 146 | 201 807 | 1.7 (1.0, 2.9) | .0071 | 27.2 |
| American Indian | 11 | 18 087 | . . . | .0053 | 100.0 |
| Men | |||||
| White | 19 598 | 6 869 619 | 2.3 (2.2, 2.4) | < .0001 | 22.7 |
| Black | 1 809 | 406 698 | 2.2 (1.7, 2.8) | < .0001 | 69.3 |
| Hispanic | 873 | 394 419 | 2.5 (1.7, 3.5) | < .0001 | 56.3 |
| API | 225 | 202 875 | 2.5 (1.6, 3.9) | < .0001 | 34.9 |
| American Indian | 31 | 16 830 | 4.3 (1.2, 15.9) | < .0001 | 60.4 |
| Heart disease | |||||
| Total | 51 186 | 18 037 431 | 1.4 (1.3, 1.4) | < .0001 | 9.0 |
| Women | |||||
| White | 26 422 | 8 454 903 | 1.4 (1.4, 1.5) | < .0001 | 8.0 |
| Black | 629 | 461 904 | 0.8 (0.6, 1.1) | .3644 | < 0 |
| Hispanic | 139 | 423 264 | 3.0 (1.5, 6.3) | < .0001 | 62.2 |
| Men | |||||
| White | 22 939 | 7 769 487 | 1.6 (1.5, 1.6) | < .0001 | 11.5 |
| Black | 671 | 428 607 | 1.1 (0.8, 1.5) | .0280 | 9.4 |
| Hispanic | 184 | 403 911 | 1.6 (1.0, 2.8) | < .0001 | 31.8 |
| Cancer | |||||
| Total | 40 060 | 18 037 431 | 1.1 (1.1, 1.2) | < .0001 | 4.2 |
| Women | |||||
| White | 19 222 | 8 454 903 | 1.1 (1.1, 1.2) | < .0001 | 2.1 |
| Black | 550 | 461 904 | 1.1 (0.8, 1.6) | .1244 | 16.1 |
| Hispanic | 118 | 423 264 | 1.4 (0.7, 2.9) | < .0001 | 47.4 |
| Men | |||||
| White | 19 119 | 7 769 487 | 1.3 (1.3, 1.4) | < .0001 | 7.6 |
| Black | 645 | 428 607 | 1.2 (0.9, 1.5) | .2494 | 11.3 |
| Hispanic | 154 | 403 911 | 1.3 (0.7, 2.2) | < .0001 | 12.5 |
| Diabetes | |||||
| Total | 3 757 | 18 037 431 | 1.5 (1.3, 1.6) | < .0001 | 10.7 |
| Women | |||||
| White | 1 957 | 8 454 903 | 1.5 (1.3, 1.8) | < .0001 | 9.4 |
| Black | 104 | 461 904 | 3.5 (1.1, 11.2) | .0102 | 66.7 |
| Hispanic | 25 | 423 264 | 1.9 (0.5, 6.7) | < .0001 | 24.1 |
| Men | |||||
| White | 1 553 | 7 769 487 | 1.3 (1.0, 1.5) | .0003 | 8.6 |
| Black | 67 | 428 607 | 0.9 (0.3, 2.2) | .0396 | 11.0 |
| Hispanic | 22 | 403 911 | 1.7 (0.4, 7.6) | < .0001 | 53.0 |
| HIV/AIDS | |||||
| Total | 1 457 | 18 037 431 | 7.1 (6.2, 8.3) | < .0001 | 54.4 |
| Women | |||||
| White | 81 | 8 454 903 | 5.0 (2.6, 9.4) | < .0001 | 38.3 |
| Black | 77 | 461 904 | 2.1 (0.8, 5.8) | .0161 | 36.2 |
| Hispanic | 35 | 423 264 | 5.7 (0.8, 42.2) | < .0001 | 72.1 |
| Men | |||||
| White | 927 | 7 769 487 | 5.4 (4.5, 6.6) | < .0001 | 42.7 |
| Black | 211 | 428 607 | 4.8 (2.0, 11.5) | < .0001 | 76.9 |
| Hispanic | 124 | 403 911 | 3.2 (1.3, 7.9) | < .0001 | 61.5 |
| Homicide and legal intervention | |||||
| Total | 730 | 18 037 431 | 13.2 (10.3, 16.8) | < .0001 | 72.9 |
| Women | |||||
| White | 95 | 8 454 903 | 4.5 (2.4, 8.3) | < .0001 | 46.8 |
| Black | 47 | 461 904 | 1.7 (0.4, 7.5) | .3624 | 57.9 |
| Hispanic | 18 | 423 264 | . . . | < .0001 | 100.0 |
| Men | |||||
| White | 206 | 7 769 487 | 5.3 (3.4, 8.2) | < .0001 | 50.9 |
| Black | 229 | 428 607 | 5.7 (2.5, 13.1) | < .0001 | 73.9 |
| Hispanic | 97 | 403 911 | 9.8 (2.4, 40.5) | < .0001 | 82.8 |
Note. RR = rate ratio; CI = confidence interval; API = Asian/Pacific Islander.
a RRs compare persons living in the most impoverished census tracts (more than 20% of persons living in poverty) with those living in the least impoverished census tracts (< 5% of persons living in poverty). No RR was computed when the rate in the referent category was 0.
b The census-designated racial categories include persons of Hispanic and non-Hispanic origin, and the Hispanic category includes persons of all census-designated races.
c Defined as elevated blood lead levels (≥ 10 μg/dL). Data are from Rhode Island, 1994–1996.
As shown in Figure 1 ▶ (across the full population) and Table 2 ▶ (comparing persons in the most impoverished CT with those in the least impoverished CT), significant trends of increased risk associated with living in increasingly poor CTs were evident for virtually all outcomes except breast and colon cancer incidence, as expected. Within the total population, the rate ratio for persons in the most impoverished CTs compared with persons in the least impoverished CTs exceeded 2.0 for 10 of the 18 outcomes analyzed. For virtually all outcomes, the socioeconomic gradient was steepest among the White population, largely because rates among Whites in the least impoverished CT were the lowest. With few exceptions (notably premature mortality and homicide), socioeconomic gradients were similar for women and men.
For the 8 outcomes with a rate ratio exceeding 5.0 (childhood lead poisoning, the 3 STIs, TB, nonfatal gun-related injuries, and mortality due to HIV/AIDS and to homicide and legal intervention), more than 50% of cases would not have occurred if population rates had equaled those of persons living in the least impoverished CT. Population groups already meeting Healthy People 2000 objectives in the early 1990s lived chiefly in the least impoverished CTs, while those far from meeting these objectives lived mainly in more impoverished CTs.
Table 3 ▶ presents analyses regarding the contribution of socioeconomic disparity to racial/ethnic inequalities in health. For virtually all outcomes, adjusting for this study’s one partial measure of socioeconomic position—CT-level poverty—substantially reduced the excess risk observed among Blacks and Hispanics compared with Whites. These excess risks were approximately halved for childhood lead poisoning, gonorrhea, TB, HIV/ AIDS mortality, and homicide; lesser but still significant reductions occurred for low birth-weight, syphilis, chlamydia, nonfatal firearms-related injuries, premature mortality, lung and cervical cancer incidence, and diabetes mortality. By contrast, adjusting for CT poverty either had no impact on or else reduced the lower risk observed among Blacks and Hispanics compared with Whites for colon cancer incidence and heart disease mortality and slightly increased the Black excess risk for prostate cancer incidence.
TABLE 3—
Racial/EthnicaDisparities in Selected Health Outcomes: Age-Adjusted Relative Risks,bBefore and After Adjustment for Census Tract (CT) Poverty Level: Massachusetts, Circa 1990
| Black:White | Hispanic:White | |||
| Women RR or OR (95% CI) | Men RR or OR (95% CI) | Women RR or OR (95% CI) | Men RR or OR (95% CI) | |
| Childhood outcomes | ||||
| Low birthweight (1989–1991) | ||||
| Age-adjusted OR | 2.8 (2.6, 3.0) | 2.5 (2.3, , 2.7) | 1.5 (1.4, 1.6) | 1.5 (1.4, 1.7) |
| + Adjusted for CT poverty | 2.3 (2.1, 2.5) | 2.0 (1.8, 2.2) | 1.2 (1.1, 1.3) | 1.2 (1.1, 1.3) |
| Childhood lead poisoningc | ||||
| Age-adjusted OR | 6.5 (5.6, 7.6) | 5.4 (4.7, 6.3) | 4.0 (3.5, 4.5) | 3.4 (3.0, 3.8) |
| + Adjusted for CT poverty | 2.4 (2.0, 2.9) | 2.1 (1.8, 2.6) | 1.3 (1.1, 1.6) | 1.2 (1.1, 1.4) |
| Infectious disease and injury | ||||
| Gonorrhea (1994–1998) | ||||
| Age-adjusted | 22.0 (19.9, 24.2) | 21.3 (19.6, 23.2) | 10.7 (9.5, 12.0) | 10.5 (9.4, 11.6) |
| + Adjusted for CT poverty | 14.0 (12.6, 15.7) | 13.0 (11.8, 14.3) | 6.2 (5.4, 7.1) | 5.9 (5.2, 6.6) |
| Syphilis (1994–1998) | ||||
| Age-adjusted | 56.6 (45.8, 69.9) | 57.0 (48.0, 67.8) | 54.1 (43.5, 67.2) | 69.0 (58.0, 82.1) |
| + Adjusted for CT poverty | 45.9 (36.0, 58.7) | 42.3 (34.8, 51.4) | 33.5 (26.0, 43.1) | 54.7 (45.0, 66.5) |
| Chlamydia (1994–1998) | ||||
| Age-adjusted | 8.1 (7.8, 8.5) | 23.4 (21.3, 25.8) | 10.0 (9.6, 10.4) | 15.3 (13.7, 16.9) |
| + Adjusted for CT poverty | 6.4 (6.1, 6.7) | 18.3 (16.4, 20.4) | 7.5 (7.1, 7.8) | 11.8 (10.5, 13.3) |
| Tuberculosis (1993–1998) | ||||
| Age-adjusted | 20.4 (16.5, 25.3) | 13.9 (11.8, 16.4) | 19.8 (14.6, 26.9) | 15.1 (12.1, 18.7) |
| + Adjusted for CT poverty | 13.8 (10.7, 17.8) | 6.9 (5.7, 8.3) | 15.1 (10.5, 21.7) | 8.0 (6.3, 10.3) |
| Nonfatal weapons-related injuries (1995–1997) | ||||
| Age-adjusted | 16.9 (10.8, 26.4) | 24.4 (21.0, 28.3) | 8.0 (4.5, 14.1) | 14.9 (12.6, 17.7) |
| + Adjusted for CT poverty | 12.6 (7.5, 21.3) | 17.4 (14.6, 20.6) | 4.2 (2.1, 8.0) | 10.7 (8.8, 13.0) |
| Cancer incidence (1988–1992) | ||||
| Lung cancer | ||||
| Age-adjusted | 0.7 (0.6, 0.8) | 1.0 (1.0, 1.1) | . . . . . . | . . . . . . |
| + Adjusted for CT poverty | 0.6 (0.5, 0.7) | 0.9 (0.8, 1.0) | . . . . . . | . . . . . . |
| Breast cancer | ||||
| Age-adjusted | 0.7 (0.6, 0.7) | . . . . . . | . . . . . . | . . . . . . |
| + Adjusted for CT poverty | 0.7 (0.6, 0.8) | . . . . . . | . . . . . . | . . . . . . |
| Cervical cancer | ||||
| Age-adjusted | 1.5 (1.2, 1.8) | . . . . . . | . . . . . . | . . . . . . |
| + Adjusted for CT poverty | 1.2 (1.0, 1.5) | . . . . . . | . . . . . . | . . . . . . |
| Prostate cancer | ||||
| Age-adjusted | . . . . . . | 1.2 (1.0, 1.3) | . . . . . . | . . . . . . |
| + Adjusted for CT poverty | . . . . . . | 1.3 (1.2, 1.4) | . . . . . . | . . . . . . |
| Colon cancer | ||||
| Age-adjusted | 0.8 (0.7, 0.9) | 0.8 (0.7, 0.9) | . . . . . . | . . . . . . |
| + Adjusted for CT poverty | 0.8 (0.7, 1.0) | 0.7 (0.6, 0.9) | . . . . . . | . . . . . . |
| Mortality (1989–1991) | ||||
| Premature mortality | ||||
| Age-adjusted | 1.9 (1.8, 2.0) | 2.0 (1.9, 2.1) | 0.9 (0.9, 1.0) | 1.2 (1.1, 1.3) |
| + Adjusted for CT poverty | 1.5 (1.4, 1.6) | 1.4 (1.3, 1.5) | 0.7 (0.7, 0.8) | 0.9 (0.8, 0.9) |
| Heart disease | ||||
| Age-adjusted | 0.9 (0.9, 1.0) | 1.0 (1.0, 1.1) | 0.5 (0.4, 0.6) | 0.5 (0.5, 0.6) |
| + Adjusted for CT poverty | 0.8 (0.7, 0.9) | 0.9 (0.8, 0.9) | 0.4 (0.3, 0.5) | 0.5 (0.4, 0.5) |
| Cancer | ||||
| Age-adjusted | 0.9 (0.9, 1.0) | 1.1 (1.1, 1.2) | 0.4 (0.3, 0.5) | 0.5 (0.4, 0.6) |
| + Adjusted for CT poverty | 0.9 (0.8, 1.0) | 1.0 (1.0, 1.1) | 0.4 (0.3, 0.5) | 0.4 (0.4, 0.5) |
| Diabetes | ||||
| Age-adjusted | 2.0 (1.6, 2.4) | 1.5 (1.2, 1.9) | 1.0 (0.7, 1.5) | 0.9 (0.6, 1.4) |
| + Adjusted for CT poverty | 1.7 (1.3, 2.0) | 1.4 (1.1, 1.8) | 0.9 (0.6, 1.3) | 0.8 (0.5, 1.3) |
| HIV/AIDS | ||||
| Age-adjusted | 17.3 (12.6, 23.6) | 4.3 (3.7, 5.0) | 8.9 (5.9, 13.2) | 2.9 (2.4, 3.5) |
| + Adjusted for CT poverty | 9.3 (6.4, 13.5) | 2.2 (1.9, 2.6) | 4.4 (2.7, 7.0) | 1.5 (1.2, 1.8) |
| Homicide and legal intervention | ||||
| Age-adjusted | 9.3 (6.5, 13.2) | 19.6 (16.2, 23.7) | 3.9 (2.3, 6.5) | 9.4 (7.4, 12.0) |
| + Adjusted for CT poverty | 5.6 (3.7, 8.4) | 1.8 (8.7, 13.4) | 2.3 (1.3, 4.0) | 5.1 (3.9, 6.7) |
Note. CI = confidence interval.
a The census-designated racial categories include persons of Hispanic and non-Hispanic origin, and the Hispanic category includes persons of all census-designated races. In the 1990 census, 98% of Whites and 92% of Blacks in Massachusetts self-identified as non-Hispanic. Cancer incidence data are not shown for Hispanics because Massachusetts cancer incidence data for Hispanics were restricted to White Hispanics.
bRelative risk is indicated by incidence rate ratio (RR) for all outcomes except childhood lead poisoning and low birthweight, for which relative risk is indicated by odds ratio (OR).
cDefined as elevated blood lead levels (≥ 10 μg/dL). Data are from Rhode Island, 1994–1996.
DISCUSSION
The results of this study demonstrate the salience and feasibility of routinely monitoring US socioeconomic inequalities in health using the strategy of characterizing cases and the overall population in relation to a common and accessible metric: the poverty level of the CT in which individuals reside. The picture painted is one of powerful socioeconomic gradients in health across myriad outcomes, for women and men in all racial/ ethnic groups, whereby socioeconomic deprivation contributes not only to racial/ethnic disparities in health but also to the occurrence of more than half the cases for more than half the outcomes studied.
Our results are unlikely to be due to bias stemming from cases’ having an erroneous or ungeocodable address or living in an area missing CT poverty data. Fully 98% of records were geocoded to the CT level by a geocoding firm whose accuracy we verified,23 only 0.7% of CTs lacked data on poverty, and previous analysis of the birth and death data showed no variation by individual-level education in the proportion of records geocoded.11,12 Nor are our results dependent on our choice of the CT poverty measure. As previously reported,11–14 we obtained similar results using census block group data (albeit with only 92% of records geocoded) and also with other measures, such as median household income, and more complex and less readily interpretable composite measures, such as the UK Townsend index.18,19
Likewise supporting use of CTs are 2 additional considerations. First, when initially delimited, their boundaries are drawn to encompass “relatively homogenous” populations in relation to “economic status, and living conditions.”24,(ppG-10,G-11) Second, once created, CTs constitute administrative units used by federal, state, and local agencies to characterize jurisdictions for determination of eligibility and resource allocation for diverse programs, including “urban empowerment zones,” “medically underserved areas,” and “qualified census tracts” for the purpose of the low-income housing tax credit; thus CTs have real-life implications for the quality of life of their residents.33–37 An appreciation for policy relevance and recognition of the strong association of CT poverty with other CT economic measures likewise led the National Cancer Institute to employ the CT poverty measure, where feasible, in its recently issued report on area socioeconomic variations in cancer.38
The method we used does not treat CT-level measures as a proxy for individual-level measures. Nor is it compromised by ecological fallacy, since analyses are based on individuals, categorized in relation to the socioeconomic circumstances of their residential area.11–14 Instead, assuming choice of a meaningful area, it posits that area-based socioeconomic measures capture a mix of any individual-level and area-based socioeconomic effects. Likely at issue is a complex combination of 3 factors: (1) composition (people in poor areas have poor health because poor individuals have poor health), (2) context (people in poor areas also have poor health because a concentration of poverty creates or exacerbates harmful social interactions), and (3) location of public goods (e.g., supermarkets, health clinics) and environmental pollution.39,40 If the relevant data were available, these complex interactions could be analyzed by multilevel methods.41,42
A related advantage of area-based socioeconomic measures is that they can be applied to all persons in an area, regardless of age or gender, thereby avoiding well-known problems with individual-level measures of education and occupation, for example, how to classify children and others who have not completed their education or who are not in the paid labor force, including homemakers, the retired, and the unemployed.17–19 This asset perhaps accounts for the similar socioeconomic gradients we observed in both women and men, in contrast to the inconsistent findings based on individual-level socioeconomic data that have been reported.17–19
Our estimates of the magnitude of socioeconomic inequalities in health, within and across diverse racial/ethnic groups, are subject to concerns about racial/ethnic misclassification and the census undercount.8–10 By itself, the method of geocoding and employing area-based socioeconomic measures cannot directly address these 2 problems, which affect all population-based analyses reliant on public health surveillance and census data and which warrant critical research.38,43,44 However, analyses of low birthweight and childhood lead poisoning would not be affected by the census undercount because the denominators were, respectively, the births themselves and the children screened; moreover, racial/ethnic misclassification was minimized by use of self-reported racial/ ethnic data.
Also relevant are concerns about the use of the US poverty line as an indicator of socioeconomic deprivation.8,9,17,37,38,45 Recent research suggests that despite the limitations of the official US poverty line (since initial assumptions about the proportion of a household’s budget required for food and housing no longer hold and alternative approaches for taking into account public assistance have been proposed),45,46 the CT poverty measure, especially for CTs with a poverty level in excess of 20% (the federal definition of a “poverty area”27), does provide a reasonable indicator of neighborhood economic deprivation, as assessed in relation to housing deterioration, refuse, crime, and other social indicators (e.g., unemployment, low earnings, low education).27,37,47
As an indicator of the robustness of the poverty threshold employed, we found similar results11–14 when we used percentage of persons living below 50% and above 200% of the US poverty line and percentage of persons earning less than 50% of the US median household income (an alternative measure of poverty employed in many European countries17,46). The magnitude of the socioeconomic gradients we detected when we used these alternative measures was on a par with available estimates reported in the US literature8–14,48 and analogous European literature.18,19
The net implication is that our results are unlikely to overestimate either the extent of socioeconomic gradients or their contribution to racial/ethnic disparities in health. Instead, they underscore the widespread and often profound extent to which socioeconomic deprivation adversely shapes population health, from infancy to death. For example, in what to our knowledge is the first statewide finding on the PAF in relation to poverty, we found that for half the outcomes studied, more than 50% of cases would not have occurred if population rates equaled those of persons living in the least impoverished CT, the only group that consistently achieved Healthy People 2000 goals a decade ahead of time.
From policy, clinical, and etiologic perspectives, it would be useful to disentangle different pathways underlying the associations we observed between CT poverty and health status. Toward this end, a fast-growing body of research is investigating the myriad causes of social inequalities in health and effects of policies to change them.49–53 At issue is how class, racial/ethnic, and gender inequality harm health by shaping exposure, across the lifecourse, to adverse living and working conditions and inadequate health care.
Augmenting this research and policy agenda, the evidence obtained by systematically and routinely monitoring social disparities in population health focuses attention on such questions as what explains the observed variations in the magnitude of socioeconomic inequalities across health outcomes, among both the total population and diverse racial/ ethnic-gender groups, and what explains the persistence of—or changes in—these patterns over time.7–14 Answering these questions will require considering both differential socioeconomic circumstances of diverse birth cohorts over time and critical period factors affecting other aspects of social inequality, for example, passage of the Civil Rights Act in 1964.49,50
In conclusion, the results of this study highlight the importance and the feasibility of routinely monitoring US socioeconomic inequalities in health, both overall and stratified by race/ethnicity and gender, thereby painting a truer picture of the “public-health situation as a whole” as long urged by Sydenstricker and other public health leaders.4,6,54 The evidence generated by our approach, which fills gaps in policy-relevant knowledge,1,5,6,55–57 could be used to set health objectives, guide resource allocation, and track progress—and setbacks—in reducing social disparities in both health and health care at the national, state, and local levels.
Although inclusion of more individual-level socioeconomic data in US public health surveillance systems, along with census-derived area-based socioeconomic data, would be ideal,1,58,59 efforts over the past century to include the former have met with only a modicum of success.2,54 Our proposed methodology, which relies on widely available data, not only is cost-efficient but also permits comparisons within and across health outcomes throughout the United States and over time, that are based on a common metric for socioeconomic position derived from US census data. Moreover, the timeliness of CT data will be improved starting in 2008, when the American Community Survey starts releasing annual CT estimates based on 5-year rolling averages.37,60 If data on national, state, and local socioeconomic inequalities in health were readily available and were reported yearly, both for the total population and for diverse racial/ethnic–gender groups, efforts to track—and improve accountability for the purpose of addressing—social disparities in health would be greatly enhanced. We suggest this can be accomplished by geocoding US public health surveillance data and using the CT-level measure “percentage of persons living below poverty level.”
Acknowledgments
This work was funded by the National Institutes of Health (1 R01 HD36865–01) via the National Institute of Child Health and Human Development and the Office of Behavioral and Social Science Research (principal investigator, Nancy Krieger).
We thank Daniel Friedman (assistant commissioner, Bureau of Health Statistics, Research and Evaluation, Massachusetts Department of Health) and Jay Buechner (chief, Office of Health Statistics, Rhode Island Department of Health) for facilitating the conduct of this study using data from their health departments and for their helpful comments. We also thank Richard Klein of the Centers for Disease Control and Prevention for assistance in obtaining the data needed to convert the original Healthy People 2000 goals, age-standardized to the 1940 standard million, to the corresponding targets age-standardized to the Year 2000 standard million.
Note. The National Institutes of Health, the National Institute of Child Health and Human Development, and the Office of Behavioral and Social Science Research had no role in the design or conduct of the study, the collection, analysis, and interpretation of the data, or the preparation, review, or approval of the submitted manuscript.
Human Participant Protection Use of the data employed in this study was approved by all relevant institutional review boards/human subjects committees at the Harvard School of Public Health, the Massachusetts Department of Public Health, and the Rhode Island Department of Health.
Peer Reviewed
Contributors N. Krieger originated and designed the study, directed the data analysis, and led the writing. J. T. Chen contributed to the study design, led the data analysis, and assisted with manuscript preparation. P.D. Waterman contributed to the study design, secured the data, and assisted with data analysis, interpretation, and manuscript preparation. D. H. Rehkopf assisted with the study and analyses. S. V. Subramanian assisted with study design and data interpretation. All authors helped to conceptualize ideas, interpret findings, and review drafts of the article.
References
- 1.Friedman DJ, Hunter EL, Parrish RG. Shaping a Vision of Health Statistics for the 21st Century. Washington, DC: Department of Health and Human Services Data Council, Centers for Disease Control and Prevention, National Center for Health Statistics, and National Committee on Vital and Health Statistics; 2002. Available at: http://www.ncvhs.hhs.gov/hsvision/. Accessed August 13, 2003.
- 2.Krieger N, Chen JT, Ebel G. Can we monitor socioeconomic inequalities in health? A survey of U.S. health departments’ data collection and reporting practices. Public Health Rep. 1997;112:481–491. [PMC free article] [PubMed] [Google Scholar]
- 3.Healthy People 2010. Conference edition. Washington, DC: US Dept of Health and Human Services; 2000. Available at: http://www.health.gov/healthypeople. Accessed August 13, 2003.
- 4.Porter D, ed. The History of Public Health and the Modern State. Amsterdam, Netherlands: Rodopi; 1994. [PubMed]
- 5.Braveman P, Starfield B, Geiger HJ. World Health Report 2000: how it removes equity from the agenda for public health monitoring and policy. BMJ. 2001; 323:678–681. [DOI] [PMC free article] [PubMed] [Google Scholar]
- 6.Sydenstricker E. The incidence of illness in a general population group: general results of a morbidity study from December 1, 1921 through March 31, 1924, Hagerstown, Md. Public Health Rep. 1925;40: 279–291. [Google Scholar]
- 7.Krieger N. Theories for social epidemiology in the 21st century: an ecosocial perspective. Int J Epidemiol. 2001;30:668–677. [DOI] [PubMed] [Google Scholar]
- 8.Krieger N, Rowley DL, Herman AA, Avery B, Phillips MT. Racism, sexism, and social class: implications for studies of health, disease, and well-being. Am J Prev Med. 1993;9(suppl):82–122. [PubMed] [Google Scholar]
- 9.Williams DR, Collins C. US socioeconomic and racial differences in health: patterns and explanations. Annu Rev Sociol. 1995;21:349–386. [Google Scholar]
- 10.Kington RS, Nickens HW. Racial and ethnic differences in health: recent trends, current patterns, future directions. In: Smelser NJ, Wilson WJ, Mitchell F, eds. America Becoming: Racial Trends and Their Consequences. Vol 2. Washington, DC: National Academy Press, 2001; 253–310.
- 11.Krieger N, Chen JT, Waterman PD, Soobader MJ, Subramanian SV, Carson R. Geocoding and monitoring US socioeconomic inequalities in mortality and cancer incidence: does choice of area-based measure and geographic level matter? the Public Health Disparities Geocoding Project. Am J Epidemiol. 2002;156:471–82. [DOI] [PubMed] [Google Scholar]
- 12.Krieger N, Chen JT, Waterman PD, Soobader MJ, Subramanian SV, Carson R. Choosing area-based socioeconomic measures to monitor social inequalities in low birthweight and childhood lead poisoning: the Public Health Disparities Geocoding Project (US). J Epidemiol Community Health. 2003;57:186–99. [DOI] [PMC free article] [PubMed] [Google Scholar]
- 13.Krieger N, Chen JT, Waterman PD, Soobader MJ, Subramanian SV. Monitoring socioeconomic inequalities in sexually transmitted infections, tuberculosis, and violence: geocoding and choice of area-based socioeconomic measures—the Public Health Disparities Geocoding Project (US). Public Health Rep. 2003;118: 240–260. [DOI] [PMC free article] [PubMed] [Google Scholar]
- 14.Krieger N, Chen JT, Waterman PD, Rehkopf DH, Subramanian SV. Race/ethnicity, gender, and monitoring socioeconomic gradients in health: a comparison of area-based socioeconomic measures—the Public Health Disparities Geocoding Project. Am J Public Health. 2003;93:1655–1671. [DOI] [PMC free article] [PubMed] [Google Scholar]
- 15.Green HW. The use of census tracts in analyzing the population of a metropolitan community. J Am Stat Assoc. 1933;28:147–153. [Google Scholar]
- 16.Coulter EJ, Guralnick L. Analysis of vital statistics by census tract. J Am Stat Assoc. 1959;54:730–740. [Google Scholar]
- 17.Krieger N, Williams D, Moss N. Measuring social class in US public health research: concepts, methodologies, and guidelines. Annu Rev Public Health. 1997;18: 341–378. [DOI] [PubMed] [Google Scholar]
- 18.Gordon D. Area-based deprivation measures—a U.K. perspective. In: Kawachi I, Berkman LF, eds. Neighborhoods and Health. New York, NY: Oxford University Press; 2003:179–207.
- 19.Carstairs V. Socio-economic factors at area level and their relationship with health. In: Elliott P, Wake-field J, Best N, Briggs D, eds. Spatial Epidemiology: Methods and Applications. Oxford, United Kingdom: Oxford University Press; 2000:51–67.
- 20.Healthy People 2000: National Health Promotion and Disease Prevention Objectives. Washington, DC: US Dept of Health and Human Services; 1991. DHHS publication PHS 91-50212.
- 21.Massachusetts Department.of Public Health, Center for Health Information, Statistics, Research and Evaluation. Available at: http://www.state.ma.us/dph/bhsre/bhsre.htm. Accessed August 13, 2003.
- 22.Rhode Island Department of Health, Health Data and Statistics. Available at: http://www.health.ri.gov/data/index.php. Accessed December 30, 2004.
- 23.Krieger N, Waterman P, Lemieux K, Zierler S, Hogan JW. On the wrong side of the tracts? Evaluating accuracy of geocoding for public health research. Am J Public Health. 2001;91:1114–1116. [DOI] [PMC free article] [PubMed] [Google Scholar]
- 24.US Census.Bureau. Geographical Areas Reference Manual. 1994. Available at: http://www.census.gov/geo/www/garm.html. Accessed August 13, 2003.
- 25.Census of Population and Housing, 1990: Summary Tape File 3 Technical Documentation. Washington, DC: US Census Bureau; 1991.
- 26.Kaplan JB, Bennett T. Use of race and ethnicity in biomedical publication [published correction appears in JAMA. 2004;292:1022]. JAMA. 2003;289: 2709–2716. [DOI] [PubMed] [Google Scholar]
- 27.US Census.Bureau. Poverty areas. Available at: http://www.census.gov/population/socdemo/statbriefs/povarea.html. Accessed August 13, 2003.
- 28.SAS/STAT User’s Guide, Version 6. 4th ed, vol 1. Cary, NC: SAS Institute Inc; 1989.
- 29.Anderson RN, Rosenberg HM. Age standardization of death rates: implementation of the year 2000 standard. Natl Vital Stat Rep. 1998;47(3):1–16,20. [PubMed] [Google Scholar]
- 30.Boyle P, Parkin DM. Statistical methods for registries. In: Jensen OM, Parkin DM, MacLennan R, et al., eds. Cancer Registration: Principles and Methods. Lyon, France: International Agency for Research on Cancer; 1991:126–158. IARC Scientific Publication No. 95. [PubMed]
- 31.Hanley JA. A heuristic approach to the formulas for population attributable fraction. J Epidemiol Community Health. 2001;55:508–514. [DOI] [PMC free article] [PubMed] [Google Scholar]
- 32.Wagstaff A, Paci P, van Doorslaer E. On the measurement of inequalities in health. Soc Sci Med. 1991; 33:545–557. [DOI] [PubMed] [Google Scholar]
- 33.Department of Housing and Urban Development. Qualified Census Tracts and Difficult Development Areas. Available at: http://www.huduser.org/datasets/qct/qct99home.html. Accessed August 13, 2003.
- 34.Health Resources.and Services Administration. Health Professional Shortage Areas. Available at: http://bhpr.hrsa.gov/shortage/. Accessed August 13, 2003.
- 35.Race and the Elimination of Health Disparities in the City of Boston: Promoting the Health of the Underserved. Boston, Mass: Boston Public Health Commission; 2002.
- 36.Monmonier M. Cartographies of Danger: Mapping Hazards in America. Chicago, Ill: University of Chicago Press; 1997.
- 37.Citro CF, Kalton G, eds. Small-Area Income and Poverty Estimates: Priorities for 2000 and Beyond. Washington, DC: National Academy Press; 2000.
- 38.Singh GK, Miller BA, Hankey BF, Edwards BK. Area Socioeconomic Variations in U.S. Cancer Incidence, Mortality, Stage, Treatment, and Survival, 1975–1999. NCI Cancer Surveillance Monograph Series, No. 4. Bethesda, Md: National Cancer Institute; 2003. NIH publication 03–5417.
- 39.Macintyre S, Ellaway A, Cummins S. Place effects on health: how can we conceptualise, operationalise and measure them? Soc Sci Med. 2002;55:125–139. [DOI] [PubMed] [Google Scholar]
- 40.O’Campo P. Invited commentary: advancing theory and methods for multilevel models of residential neighborhoods and health. Am J Epidemiol. 2003;157:9–13. [DOI] [PubMed] [Google Scholar]
- 41.Subramanian SV, Jones K, Duncan C. Multilevel methods for public health research. In: Kawachi I, Berkman L, eds. Neighborhoods and Health. Oxford, United Kingdom: Oxford University Press; 2003:65–111.
- 42.Diez-Roux AV. Multilevel analysis in public health research. Annu Rev Public Health. 2000;21:171–192. [DOI] [PubMed] [Google Scholar]
- 43.Rosenberg HM, Maurer JD, Sorlie PD, et al. Quality of death rates by race and Hispanic origin: a summary of current research, 1999. Vital Health Stat 2. 1999;No.128:1–13. [PubMed]
- 44.Keppel KG, Pearcy JN, Wagener DK. Trends in racial and ethnic-specific rates for health status indicators: United States, 1990–98. Hyattsville, Md: National Center for Health Statistics; January 2002. Healthy People 2000 Statistical Notes, No. 23. Available at: http://www.cdc.gov/nchs/data/statnt/statnt23.pdf (PDF file). Accessed November 30, 2004. [PubMed]
- 45.Citro CF, Michael RT, eds. Measuring Poverty: A New Approach. Washington, DC: National Academy Press; 1995.
- 46.Gordon D, Spicker P, eds. The International Glossary on Poverty. London, United Kingdom: Zed Books; 1999.
- 47.Jargowsky PA. Poverty And Place: Ghettos, Barrios, and the American City. New York, NY: Russell Sage; 1997.
- 48.Pamuk E, Makuc D, Heck K, Reuben C, Lochner K. Socioeconomic Status and Health Chartbook. Health, United States, 1998. Hyattsville, Md: National Center for Health Statistics; 1998.
- 49.Krieger N, ed. Embodying Inequality: Epidemiologic Perspectives. Amityville, NY: Baywood Publishing Co; 2004.
- 50.Davey Smith G, ed. Health Inequalities: Lifecourse Approaches. Bristol, United Kingdom: Policy Press; 2003.
- 51.Leon D, Walt G, eds. Poverty, Inequality and Health: An International Perspective. Oxford, United Kingdom: Oxford University Press; 2001.
- 52.Berkman L, Kawachi I, eds. Social Epidemiology. Oxford, United Kingdom: Oxford University Press; 2000.
- 53.Marmot M, Wilkinson RG, eds. Social Determinants of Health. Oxford, United Kingdom: Oxford University Press; 1999.
- 54.Krieger N, Fee E. Measuring social inequalities in health in the United States: a historical review, 1900–1950. Int J Health Serv. 1996;26:391–418. [DOI] [PubMed] [Google Scholar]
- 55.Friedman D, Anderka M, Krieger J, Land G, Solet D. Accessing population health information through interactive systems: lessons learned and future directions. Public Health Rep. 2001;116:132–141. [DOI] [PMC free article] [PubMed] [Google Scholar]
- 56.Fiscella K, Franks P, Gold M, Clancy C. Inequalities in quality: addressing socioeconomic, racial, and ethnic disparities in health care. JAMA. 2000;283: 2579–2584. [DOI] [PubMed] [Google Scholar]
- 57.Navarro V. Race or class versus race and class. Lancet. 1990;336:1238–1240. [DOI] [PubMed] [Google Scholar]
- 58.Geronimus AT, Bound J, Neidert LJ. On the validity of using census geocode data to proxy individual socioeconomic characteristics. J Am Stat Assoc. 1996;91: 529–537. [Google Scholar]
- 59.Diez Roux AV, Merkin SS, Hannan P, Jacobs DR, Kiefe CI. Area characteristics, individual-level socioeconomic indicators, and smoking in young adults: the Coronary Artery Disease Risk Development in Young Adults Study. Am J Epidemiol. 2003;157:315–326. [DOI] [PubMed] [Google Scholar]
- 60.US Census.Bureau. American Community Survey: What is the American Community Survey? Available at: http://www.census.gov/acs/www/SBasics/What/What1.htm. Accessed December 30, 2004.


