Abstract
Objectives. We measured and compared the concentration of primary and secondary syphilis, gonorrhea, chlamydial infection, and genital herpes in a large county with urban, suburban, and rural settings.
Methods. We geocoded sexually transmitted infections reported to King County, Washington health department in 2000–2001 to census tract of residence. We used a model-based approach to measure concentration with Lorenz curves and Gini coefficients.
Results. Syphilis exhibited the highest level of concentration (estimated Gini coefficient = 0.68, 95% confidence interval [CI] = 0.64, 0.78), followed by gonorrhea (estimated Gini coefficient=0.57; 95% CI=0.54, 0.60), chlamydial infection (estimated Gini coefficient = 0.45; 95% CI = 0.40, 0.43), and herpes (estimated Gini coefficient=0.26; 95% CI=0.22, 0.29).
Conclusions. Geographically targeted interventions may be most appropriate for syphilis and gonorrhea. For less-concentrated infections, control strategies must reach a wider portion of the population.
In a model introduced by Wasserheit and Aral,1 an epidemic of a sexually transmitted infection (STI) progresses through identifiable phases influenced by dynamic interactions among several factors, including characteristics of the pathogen, sexual behaviors in a population, and control and prevention activities. Prevention and control strategies may need to be phase specific to most effectively control the spread of STIs.1,2 A limitation to applying phase-specific interventions is that methodologies for identifying the stages of an epidemic are not well developed.
Wasserheit and Aral hypothesized that both “spread networks” (e.g., groups with higher rates of sexual partner change, concurrent sexual relationships, or reduced access to or use of health care and prevention services) and “maintenance networks” (e.g., groups with lower rates of sexual partner change and concurrency, representing a greater share of the population) are involved during the initial growth and hyperendemic phases of an epidemic, but spread networks dominate in subsequent decline and endemic phases.1 As incidence decreases in these later phases, infection becomes more concentrated within spread networks.1 Wasserheit3 and Elliot et al.4 suggested that measuring the concentration of an STI may be useful in determining an epidemic’s phase; they introduced the application of Lorenz curves and Gini coefficients, measures of inequality most often used in economics and sociology, into the STI literature. Both measures are based on the distribution of some commodity—income, wealth, or an STI—across a population. To date, statistical tests have not been applied to compare Gini coefficients or Lorenz curves to one another, for example, to compare the patterns of concentration of different STIs or to assess trends in concentration of any given STI over time. We set out to measure and compare the concentration of 4 STIs in a large county with urban, suburban, and rural settings.
We hypothesized that the concentration of the STIs would be influenced by the intrinsic characteristics of the pathogen and the disease (i.e., efficiency of transmission and duration of infectivity with no intervention), by patterns of sexual behavior in the population, and by intervention activities. Thus, STIs that often produce symptoms that prompt health care seeking and curative therapy and that have long been the target of effective, wide-coverage sexually transmitted disease (STD) control programs (i.e., syphilis and gonorrhea), will become more heavily concentrated in smaller segments of the population than would be the case for an STI that is more often asymptomatic and that has been addressed with control efforts of shorter duration (e.g., chlamydial infection) or incurable STIs such as genital herpes, characterized by prolonged infectivity and not specifically addressed by an effective control program. We tested these hypotheses by examining the levels of concentration of syphilis, gonorrhea, chlamydial infection, and herpes in the population of King County, Washington, for the years 2000 and 2001.
METHODS
Setting
The study was carried out in King County, Washington, population 1.74 million.5 The county encompasses the city of Seattle (population 563 375) and numerous incorporated and unincorporated suburban and rural communities.
Data Sources
The state of Washington requires health care providers to report all cases of syphilis, gonorrhea, chlamydial infection, and genital herpes (initial infection only). Providers submit case reports to local health jurisdictions, which in turn submit the reports to the Washington Department of Health. Syphilis, gonorrhea, and chlamydial infections, but not herpes, also are ascertained through active surveillance of all King County laboratories. In this study, we used data for reported cases of primary and secondary syphilis (n = 91), gonorrhea (n = 2780), chlamydial infection (n = 8709), and initial episodes of genital herpes (n = 1364) for the years 2000 and 2001. During the study period, 485 cases were reported with both gonorrhea and chlamydial infection, and 26 were reported with both chlamydial infection and initial genital herpes.
The Washington Department of Health geocoded case report data to the 2000 census tract of residence. Because widespread routine screening of women probably maximizes ascertainment of chlamydial infections in women more than in men, we examined chlamydia concentration by gender as well as for the entire population. The results were similar, and thus we present results using chlamydial infection data for the entire population. The proportion of residential addresses of cases successfully geocoded ranged from 86% for gonorrhea and chlamydial infection to 94% for initial genital herpes. We used 2000 census tracts as our unit of aggregation and US Census 2000 data for census tract populations.
Data Analyses
We used Lorenz curves and Gini coefficients to examine differences in the concentration of the 4 STIs. The Lorenz curve is a graphic representation of the distribution of some commodity, such as income, against the uniform distribution that represents equality, such as population. Therefore, it displays how equally the commodity is distributed across the population. STIs present a special problem in applying Lorenz curves, which are usually applied to variables that can be broken down into fractions of a whole. Although commodities such as income can be distributed in very small quantities, large portions of most populations may have no cases of a specific STI. For example, in 2000–2001, 69 of the 373 King County census tracts had no reported gonorrhea cases. Additionally, small numbers of cases cannot possibly be spread equally over the population, thereby leading to a Lorenz curve that shows an artificially high level of concentration. To address this problem, we modeled the rates of each STI within each tract to produce an estimated number of cases (producing very small, nonzero numbers of cases in some tracts) for use in the calculation of the Lorenz curves and Gini coefficients. We modeled this rate via a negative binomial generalized additive regression model6 with linear terms for the following 2000 census tract population attributes: median household income, percentage of White residents, percentage of African American residents, percentage of residents reporting being of 2 or more races, percentage of residents aged 15–24 years, percentage of single men, percentage of residents living in poverty, percentage without a high school education, percentage of households headed by unmarried male partners, and a spline term for tract population. The models were fit using the generalized additive regression model function in R, a language and environment for statistical computing (R Foundation for Statistical Computing, Vienna, Austria, 20037). The expected number of cases within a tract was taken to be the estimated disease rate within the tract multiplied by the population total of the tract.
For the initial Lorenz curves, we arranged census tracts in descending order by estimated disease rate and calculated the cumulative percentage of both total expected cases and population by census tract for each STI. The Lorenz curve was formed by plotting the cumulative percentage of population on the horizontal axis and cumulative percentage of total expected cases on the vertical axis. If the disease rate was the same for each census tract, the Lorenz curve would be a diagonal line whereby each census tract contributed a proportion of the total cases exactly proportional to its share of the county population.
The Gini coefficient is a summary measure for the Lorenz curve; it allows for comparison of concentration levels without graphic displays. If the Lorenz curves of multiple diseases do not cross, then an ordering of the concentration of the diseases will be the same as an ordering of their Gini coefficients. In addition, Gini coefficients can be used to assess concentration levels across studies. The Gini coefficient measures twice the percentage of the total area above the diagonal, which is encompassed by the Lorenz curve, and ranges from 0 to 1.8,9 A Gini coefficient of 1 indicates concentration of all disease in a single census tract, whereas a value of 0 indicates identical rates in all tracts. We calculated 2 types of Gini coefficients. First, we used only the observed number of cases and their distribution across census tracts to calculate crude Gini indexes in the traditional manner. Second, we used Lorenz curves derived from the regression model for disease rate to calculate estimated Gini coefficients. We included the crude Gini measure to demonstrate the need for modeling the expected number of cases in each tract to obtain an estimate of the Gini coefficient that is not affected by discreteness, as we have done here.
Detailed methodological information on the use of Lorenz curves and the Gini index, including motivation, interpretation, and computation, is reported by Lee.8 The interpretation and comparison of the Lorenz curves and Gini coefficients across different STIs requires measurement of the statistical uncertainty of the estimates. We calculated non-parametric confidence bands for the Lorenz curves and confidence intervals for the Gini coefficients, both based on bootstrap methodology.10 Specifically, we simulated the number of cases within each tract as a random draw from the previously described regression model and calculated the Lorenz curve for the simulated values. We repeated this procedure 99 times and constructed the confidence bands by multiplicatively expanding the 2.5% and 97.5% points of quantile functions of the simulated data so that the bands have 95% simultaneous coverage over the range of the horizontal axis. Although there has been previous work on the estimation of the standard errors of the Gini coefficients,11 here we use studentized bootstrap confidence intervals10 based on the Gini coefficients of the simulated Lorenz curves. All data analyses were carried out using R.
RESULTS
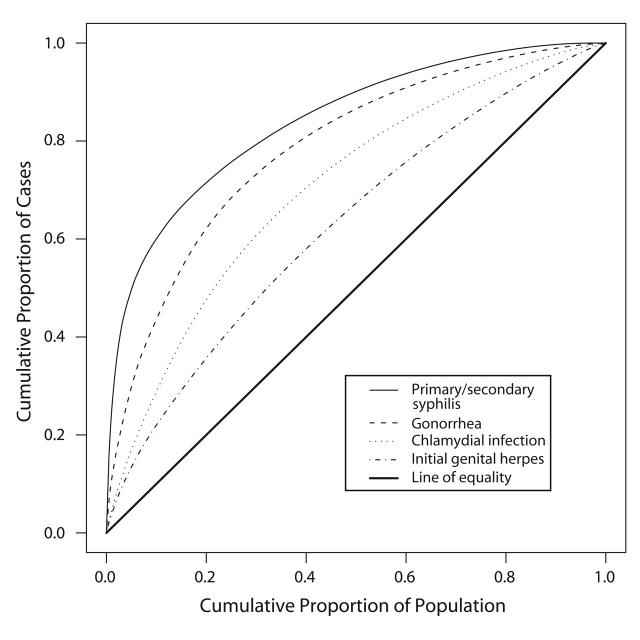
Figure 1 ▶ displays the Lorenz curves for each infection. The curve for syphilis bows the furthest away from the diagonal line that would represent a distribution of cases proportionate to the population, indicating that syphilis was the most concentrated of the STIs studied. Similarly, the estimated Gini coefficient for syphilis reflects a high level of concentration (Table 1 ▶). The Lorenz curve and estimated Gini coefficient for gonorrhea exhibited an intermediate level of concentration, whereas the curves and estimated Gini coefficients for chlamydial infection and herpes exhibited progressively lower levels of concentration.
FIGURE 1—
Lorenz curves for reported cases of 4 sexually transmitted infections in King County, Washington, 2000–2001.
TABLE 1—
Crude and Estimated Gini Coefficients and 95% Confidence Intervals for Primary and Secondary Syphilis, Gonorrhea, Chlamydial Infection, and Initial Episodes of Genital Herpes, King County, Washington, 2000–2001
| Crude | Estimated | ||
| Disease | Observed Casesa | Gini Coefficient (95% CI) | Gini Coefficient (95% CI) |
| Syphilis | 84 | 0.915 (0.887–0.929) | 0.682 (0.637–0.776) |
| Gonorrhea | 2396 | 0.633 (0.601–0.651) | 0.57 (0.543–0.601) |
| Chlamydia | 7493 | 0.443 (0.425–0.460) | 0.411 (0.395–0.433) |
| Herpes | 1276 | 0.409 (0.369–0.416) | 0.255 (0.224–0.290) |
Note. CI = confidence interval. For purposes of this table, Gini coefficient = percentage of the area above the 45° line that is encompassed by the curve.
aObserved cases include only geocoded cases used in analyses.
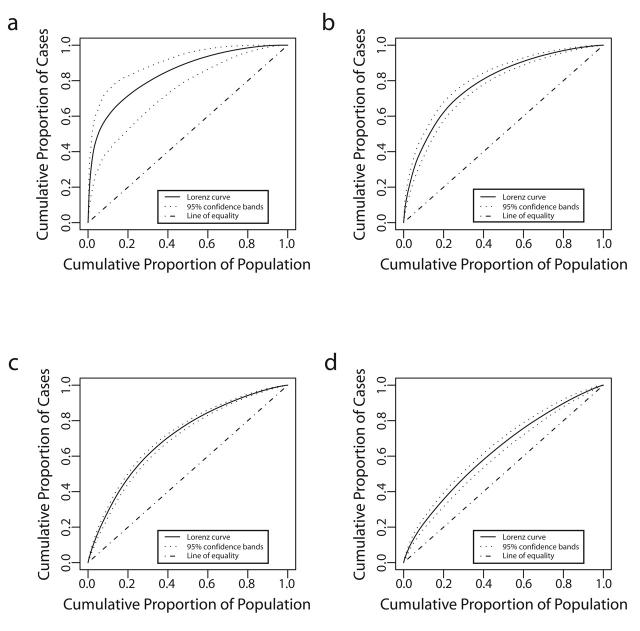
Ninety-five percent confidence bands drawn around the Lorenz curves indicate that the curves are distinct from one another (Figure 2 ▶). These differences also are reflected in the 95% confidence intervals for the estimated Gini coefficients (Table 1 ▶). Fifty percent of the total predicted primary and secondary syphilis cases occurred in census tracts that account for 5% of the county’s population. Conversely, 50% of the predicted gonococcal and chlamydial infections and initial episodes of genital herpes were found in tracts that encompass 13%, 22%, and 32% of the population, respectively (Figure 1 ▶). Figure 3 ▶ shows the census tracts that accounted for 50% of the estimated cases for each of these 4 infections in King County in 2000–2001.
FIGURE 2—
Lorenz curves and confidence bands for (a) primary and secondary syphilis, (b) gonorrhea, (c) chlamydial infection, and (d) initial episodes of genital herpes, King County, Washington, 2000–2001.
FIGURE 3—
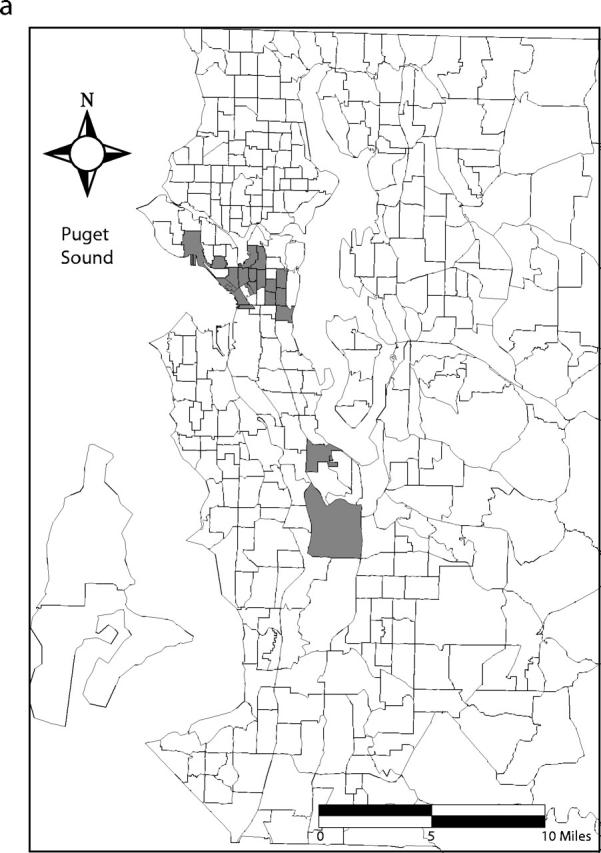
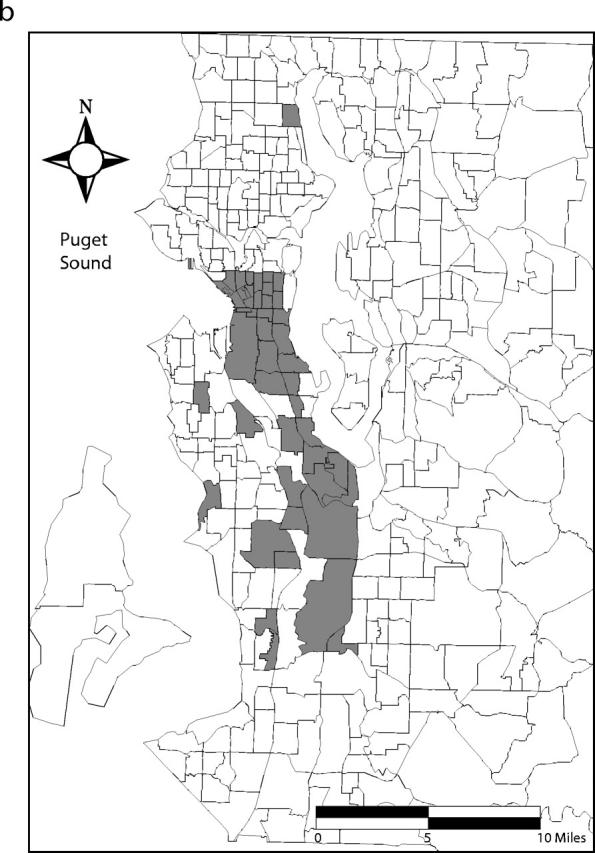
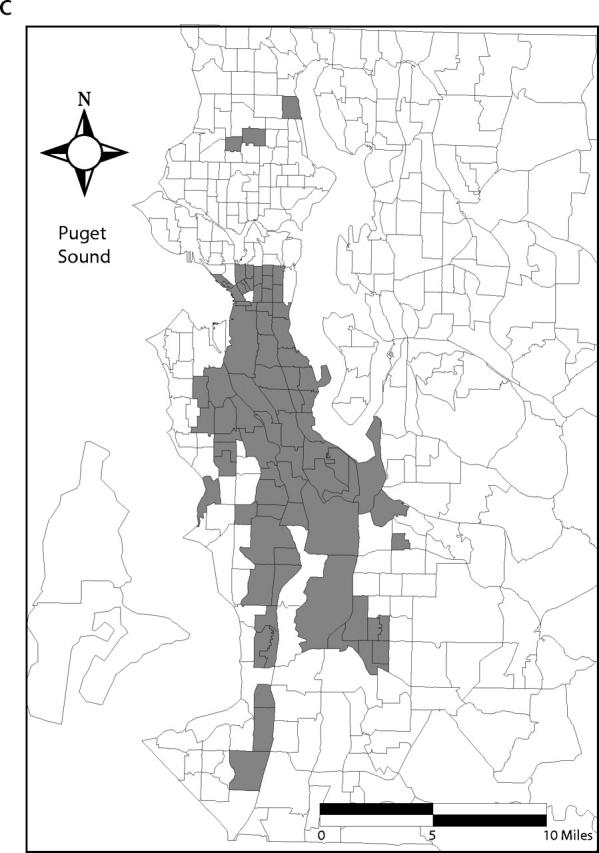

Census tracts that account for 50% of estimated cases of (a) primary and secondary syphilis, (b) gonorrhea, (c) chlamydial infection, and (d) initial episodes of genital herpes, after tracts were arranged in descending order by estimated rate, King County, Washington, 2000–2001. Note. Twenty-one census tracts (of 373 total) in eastern King County are not shown. None of these census tracts accounted for the first 50% of estimated sexually transmitted infection cases when tracts were arranged in descending order by estimated rate.
In addition to the estimated Gini coefficients, Table 1 ▶ displays the crude Gini coefficients and 95% confidence intervals for each infection. Chlamydial infection, with the most observed cases, has an estimated Gini coefficient similar to the crude measure. In contrast, the crude and estimated Gini coefficients for syphilis are quite different, owing to the much smaller number of observed syphilis cases.
DISCUSSION
We examined 4 STIs reported in King County, Washington, and found that primary and secondary syphilis was the most concentrated STI, followed by gonorrhea, chlamydial infection, and initial episodes of genital herpes. We developed statistical methodology to compare concentration among STIs; this methodology, combined with incidence and other information, may prove useful in other settings and in confirming significant changes in concentration of a particular STI over time as epidemics evolve in response to control measures and changing behaviors.
Consistent with our findings, previous studies in upstate New York,12 Seattle,13 Colorado Springs,14 Manitoba,5,15 and Baltimore16 showed that gonorrhea cases were geographically concentrated in areas that accounted for a relatively small proportion of the overall population. In addition, other investigators have shown that gonorrhea cases were more geographically concentrated than chlamydia cases in Winnipeg,15 greater Manitoba,5 and Colorado Springs.17 Investigators in Manitoba reported Gini coefficients of 0.66 and 0.39 for gonorrhea and chlamydial infection in 1998, respectively.5 These Gini coefficients were calculated in a manner equivalent to our crude Gini coefficients, and we found remarkably similar crude Gini coefficients of 0.63 and 0.44 for these 2 infections, respectively. By contrast, in the late 1980s, syphilis and gonorrhea cases were similarly concentrated in Miami.18 However, national trends in primary and secondary syphilis since 1990 provide evidence for increasing concentration of syphilis on a national level. In 2002, 50% of primary and secondary syphilis cases in the country were reported in only 16 (0.7%) of 3139 counties and 1 independent city.19 To our knowledge, no previous study has examined the geographic distribution or concentration of genital herpes in a population.
The differing census tract concentrations of these 4 STIs can be attributed to (1) the differences in the duration of time after infection is acquired that they can be transmitted and the efficacy with which the STIs can be transmitted over the course of an average infection; (2) the differences in the population coverage, effectiveness, and duration of control measures for each STI; and (3) the associations of patterns of residential clustering of populations by census tracts with their patterns of sexual mixing and with their coverage by, access to, and use of effective control measures.
Brunham and Plummer have published useful estimates of the duration of infectivity and the efficiencies of transmission for several STIs, with and without control measures.20 For those transmitted efficiently and for long periods, transmission could theoretically persist even in populations with low levels of sexual mixing, whereas STIs transmitted less efficiently and only for short periods should persist only in populations with relatively high levels of sexual mixing. These estimates do predict that chlamydial infection, gonorrhea, and syphilis would be increasingly more concentrated in populations with increasing levels of sexual mixing. However, these estimates are imprecise, and sexual practices, strain-to-strain variations in infectivity, and control measures may influence level or duration of infectivity for a given pathogen. For example, for syphilis and gonorrhea in heterosexual men, the frequent occurrence of symptoms that commonly prompt health care seeking, the availability of curative therapy, and programmatic emphasis on partner notification all combine to drive down the duration of infectivity of these 2 STIs, allowing them to persist only in subpopulations with high levels of sexual mixing, especially in those populations with low coverage by, poor access to, or reduced use of appropriate health services. Some evidence for the lower frequency of symptoms of anorectal versus penile primary syphilis and the futility of partner notification for anonymous sexual partners may contribute to the spread of syphilis in some groups of men who have sex with men, despite otherwise effective control measures.
For chlamydial infection, less frequent and less severe symptoms prompt health care seeking less often, making screening for asymptomatic infection more important for chlamydia control. The proportion of infections detected and treated depends on the population coverage, frequency of testing, and sensitivity of tests used, all of which vary across populations and have only recently been improving. Finally, for genital herpes, the absence of curative therapy, the low coverage by suppressive therapy, and the likely importance of asymptomatic viral shedding in transmission all allow this STI to propagate in populations with relatively low levels of sexual mixing.
Why is the measurement of concentration within a population important for STI control? Wasserheit and Aral suggested the importance of phase-specific control strategies for STIs.1 Clearly, highly concentrated STIs, such as syphilis in King County, require different control strategies from more diffusely distributed STIs, such as chlamydial infection. Syphilis control efforts in King County currently are based primarily on education of men who have sex with men concerning symptom recognition, clinical services for symptomatic persons, condom use, and sexual safety in general, as well as attempted partner notification. Potentially effective interventions for these more concentrated infections could include geographically targeted screening within the community, integration of STI screening and care into community-based clinics serving high-risk census tracts, and targeted education around STI prevention in areas with a high density of cases. Chlamydial infection control efforts include population-based screening of young women and increasing screening of sexually active young men (with assessment of its prevention efficacy). No systematic control strategies are currently in place for genital herpes, but a pilot project is under way to assess the productivity of widespread serologic screening to identify herpes simplex virus type 2 sero-positive persons.
If measurement of STI concentration proves useful in assessing an epidemic’s growth or decline or its concentration within defined subpopulations, such measures will allow us to anticipate the types of strategies that will be most effective in controlling epidemics in the future. Combining concentration with other measures such as incidence will likely prove useful; further study regarding appropriate tools to examine epidemic transitions is needed.
Limitations of this study include possible differential sampling bias for the 4 STIs related to different patterns of (1) health care seeking, testing, or diagnosis or (2) reporting. African Americans may be more likely than non-Hispanic Whites to be tested for STIs. As in many urban areas, in Seattle, African Americans are residentially segregated; impoverished people of all races are also segregated to some extent. If there is differential health care seeking for diseases that are usually symptomatic, such as gonorrhea in men or primary syphilis in heterosexual men or secondary syphilis in men or women, it appears unlikely that health care seeking (or access) would be more frequent or better in low-income census tracts; therefore, the higher incidence of these diseases in such census tracts that we observed appears unlikely to be attributable to that bias. Indigent people of all races are more likely to obtain care from public clinics. Public clinics likely do more STI screening for gonorrhea, syphilis, and chlamydial infection than other types of clinics and conceivably more diagnostic testing in symptomatic patients for these 4 STIs and are more likely to report STIs. This could result in bias toward higher concentration in census tracts containing indigent populations, especially in women, who are less often symptomatic and more often screened for gonorrhea, chlamydial infection, or primary syphilis. However, separate analyses for men and women showed no gender differences in concentration for gonorrhea and chlamydial infection, suggesting differential screening (which is most often done in women) does not account for the differing levels of concentration of these infections.
Although no single strategy can adequately solve the problem of underreporting, Public Health–Seattle & King County has achieved comprehensive, laboratory-based surveillance through interventions designed to increase reporting of syphilis, gonorrhea, and chlamydial infection by providers and laboratories and, therefore, represents a useful area for this type of study.13,21
Reporting of genital herpes is much less complete; we believe that most initial genital herpes cases in King County are not ascertained by the current reporting system. However, the proportion of herpes case reports submitted by Public Health–Seattle & King County STD clinic providers (23%) during 2000–2001 was intermediate to the proportion of gonorrhea (28%) and chlamydial infection (11%) case reports submitted by the same providers. Thus, although initial genital herpes may be underreported, it appears unlikely that our finding that herpes was much more diffusely distributed than any of the other infections studied is because of differences in reporting patterns across the infections. Nevertheless, the estimated low proportion of herpes cases reported means that herpes results should be interpreted with caution.
Finally, examining only 2 years of data does not allow for the analysis of epidemic trends in these 4 infections. The geographic distribution and concentration of cases in these 2 years may not adequately identify factors responsible for the levels of concentration observed. For example, syphilis was transiently eliminated in King County in 1996. In the years leading up to its elimination in 1996, it was found most often in heterosexuals, especially in African Americans and other racial/ethnic minorities. However, the incidence of syphilis rose rapidly from 1997 through 1999 and is now seen almost exclusively among men who have sex with men. Nonetheless, the incidence of reported syphilis in King County was stable from 1999 through 2002. We separately analyzed changes in concentration of these 4 STIs over time and found that although concentration of syphilis increased over time as syphilis incidence decreased, concentrations of gonorrhea, chlamydial infection, and genital herpes remained stable from 1993 to 2002 (Kerani R, unpublished data, 2001).
Strengths of our study included the examination of comparisons of concentrations of 4 STIs; the comprehensive laboratory surveillance of syphilis, gonorrhea, and chlamydial infections in King County over the study period; gender-specific analyses to assess differential screening or testing bias for chlamydia; and development of statistical methods for formally comparing the levels of concentration of all 4 STIs.
In conclusion, although we were unable to differentiate the effects of differences in transmission efficiency, mean duration of infection, partner network structure, and other influences from the effects of epidemic stage or the maturity of prevention efforts, the latter are likely to be important contributors to the differing concentrations observed among the 4 STIs studied. The code we used for these analyses is available on our Web site (http://www.csde.washington.edu/~handcock/stdlorenz); we hope that other investigators will find these methods useful to measure and compare concentration of STIs in other regions. The epidemic evolution framework must ultimately prove its worth by its ability to guide real-world approaches to the problem in question, as in controlling STIs.
Acknowledgments
This research was supported by the National Institute of Allergy and Infectious Diseases (grant NIAID 5T32 AI 07140–24, R. P. Kerani, principal investigator), the Association of Teachers of Preventive Medicine and the Centers for Disease Control and Prevention (grant ATPM/CDC T-16/16-STP02–008, R. P. Kerani, principal investigator), the National Institute of Child Health and Human Development (grants NICHD HD38210–01 and NICHD HD41877–01, M. S. Handcock, principal investigator), and the National Institute on Drug Abuse (grant NIDA DA12831–01 M. S. Handcock, principal investigator).
The authors wish to thank Mark Stenger and colleagues in the Infectious Disease and Reproductive Health Assessment Unit of the Washington State Department of Health for generously providing the geo-coded King County surveillance data used in these analyses. We also wish to thank Nita Heimann and colleagues in the Epidemiology, Planning, and Evaluation Unit of Public Health–Seattle and King County for providing information regarding the STD reporting and data collection processes for the data used in these analyses.
Human Participant Protection No protocol approval was needed for this study.
Peer Reviewed
Contributors K. K. Holmes and R. P. Kerani originated the study. R. P. Kerani and M. S. Handcock planned and completed the analyses. M. S. Handcock developed the novel statistical methods used in the study. R. P. Kerani wrote the article with substantial contributions from K. K. Holmes and M. S. Handcock. H. H. Handsfield provided historical information about STD control programs in King County and participated in the interpretation of the data. All authors reviewed drafts of the article.
References
- 1.Wasserheit J, Aral S. The dynamic topology of sexually transmitted disease epidemics: implications for prevention strategies. J Infect Dis. 1996;174(suppl 2): S201–S213. [DOI] [PubMed] [Google Scholar]
- 2.Blanchard J. Populations, pathogens, and epidemic phases: closing the gap between theory and practice in the prevention of sexually transmitted diseases. Sex Transm Infect. 2002;78(suppl 1):i183–i188. [DOI] [PMC free article] [PubMed] [Google Scholar]
- 3.Wasserheit J. STD control strategies: a synthetic overview. Paper presented at: Phase-Specific Strategies for Prevention, Control and Elimination of Sexually Transmitted Diseases: Implications for Research, Policies and Programs; October 3–6, 2000; Rome, Italy. Cosponsored by the Centers for Disease Control and Prevention, the European Commission, the Wellcome Trust, and Health Canada.
- 4.Elliot L, Blanchard J, Beaudoin C, et al. Geographical variations in the epidemiology of bacterial sexually transmitted infections in Manitoba, Canada. Sex Transm Infect. 2002;78(suppl 1):i139–i144. [DOI] [PMC free article] [PubMed] [Google Scholar]
- 5.US Census Bureau. Available at: http://www.census.gov/main/www/cen2000.html. Accessed November 7, 2004.
- 6.Hastie TJ, Tibshirani RJ. Generalized Additive Models. London, UK: Chapman and Hall, 1990.
- 7.Ihaka R, Gentleman R. R: A language for data analysis and graphics. Journal of Computational and Graphical Statistics. 1996;5(3):299–314. [Google Scholar]
- 8.Lee WC. Characterizing exposure-disease association in human populations using the Lorenz curve and Gini index. Stat Med. 1997;16:729–739. [DOI] [PubMed] [Google Scholar]
- 9.Brown M. Using Gini-style indices to evaluate the spatial patterns of health practitioners: theoretical considerations and an application based on Alberta data. Soc Sci Med. 1994;38:1243–1256. [DOI] [PubMed] [Google Scholar]
- 10.Davison AC, Hinkley DV. Bootstrap Methods and Their Application. New York, NY: Cambridge 1997.
- 11.Kakwani NC. Large sample distributions of several inequality measures: with application to Côte d’Ivoire. In: Carter RAL, Dutta J, Ullah A, eds. Contributions to Econometric Theory and Applications. New York, NY: Springer, 1990:50–81.
- 12.Rothenberg R. The geography of gonorrhea. Am J Epidemiol. 1983;117:688–694. [DOI] [PubMed] [Google Scholar]
- 13.Rice R, Roberts P, Handsfield H, Holmes K. Socio-demographic distribution of gonorrhea incidence: implications for prevention and behavioral research. Am J Public Health. 1991;81:1252–1258. [DOI] [PMC free article] [PubMed] [Google Scholar]
- 14.Potterat J, Rothenberg R, Woodhouse D, Muth J, Pratts C, Fogle J. Gonorrhea as a social disease. Sex Transm Dis. 1985;12:25–32. [DOI] [PubMed] [Google Scholar]
- 15.Blanchard J, Moses S, Greenaway C, Orr P, Hammond G, Brunham R. The evolving epidemiology of chlamydia and gonococcal infections in response to control programs in Winnipeg, Canada. Am J Public Health. 1998;88:1496–1502. [DOI] [PMC free article] [PubMed] [Google Scholar]
- 16.Becker K, Glass G, Brathwaite W, Zenilman J. Geographic epidemiology of gonorrhea in Baltimore, Maryland, using a geographic information system. Am J Epidemiol. 1998;147:709–716. [DOI] [PubMed] [Google Scholar]
- 17.Zimmerman H, Potterat J, Dukes R, et al. Epidemiologic differences between chlamydia and gonorrhea. Am J Public Health. 1990;80:1338–1342. [DOI] [PMC free article] [PubMed] [Google Scholar]
- 18.Hamers F, Peterman T, Zaidi A, Ransom R, Wroten J, Witte J. Syphilis and gonorrhea in Miami: similar clustering, different trends. Am J Public Health. 1995;85:1104–1108. [DOI] [PMC free article] [PubMed] [Google Scholar]
- 19.Centers for Disease Control and Prevention. Sexually Transmitted Disease Surveillance, 2002. Atlanta, Ga: US Department of Health and Human Services, Centers for Disease Control and Prevention, 2003.
- 20.Brunham R, Plummer F. A general model of sexually transmitted disease epidemiology and its implications for control. Med Clin North Am. 1990;74:1339–1352. [DOI] [PubMed] [Google Scholar]
- 21.Golden M, Whittington WL, Handsfield HH, et al. Partner management for gonococcal and chlamydial infection: expansion of public health services to the private sector and expedited sex partner treatment through a partnership with commercial pharmacies. Sex Transm Dis. 2001;28:658–665. [DOI] [PubMed] [Google Scholar]


