

Abstract
Objectives. We assessed the effectiveness of a community health worker intervention focused on reducing exposure to indoor asthma triggers.
Methods. We conducted a randomized controlled trial with 1-year follow-up among 274 low-income households containing a child aged 4–12 years who had asthma. Community health workers provided in-home environmental assessments, education, support for behavior change, and resources. Participants were assigned to either a high-intensity group receiving 7 visits and a full set of resources or a low-intensity group receiving a single visit and limited resources.
Results. The high-intensity group improved significantly more than the low-intensity group in its pediatric asthma caregiver quality-of-life score (P=.005) and asthma-related urgent health services use (P=.026). Asthma symptom days declined more in the high-intensity group, although the across-group difference did not reach statistical significance (P= .138). Participant actions to reduce triggers generally increased in the high-intensity group. The projected 4-year net savings per participant among the high-intensity group relative to the low-intensity group were $189–$721.
Conclusions. Community health workers reduced asthma symptom days and urgent health services use while improving caregiver quality-of-life score. Improvement was greater with a higher-intensity intervention.
Asthma prevalence and morbidity among children in the United States have increased dramatically in the past 2 decades and remain high.1 Exposure and sensitization to allergens and irritants found in the indoor environment are major factors in the development and exacerbation of asthma.2–4 Wheezing, asthma, and exposure to asthma triggers are associated with specific home environmental conditions, such as dampness and carpeting.2,5
In recent years, the “Healthy Homes” model has emerged as a promising approach for reducing exposure to indoor asthma triggers.6–8 The Healthy Homes model involves conducting home environmental audits to assess multiple exposures, motivating participants to take low-cost actions, and offering advice, tools to reduce exposures, and advocacy for improved housing. The National Institute of Environmental Health Sciences,9 the Department of Housing and Urban Development,10 and the Environmental Protection Agency11 have recognized the potential of the Healthy Homes approach and have funded research and demonstration projects.
Initial Healthy Homes programs had certain limitations. Evidence from rigorously conducted evaluations regarding their effectiveness was lacking. They did not focus on the urban, low-income, ethnically diverse households that are disproportionately affected by asthma.12
Community health workers (CHWs) seem well suited to implementing the Healthy Homes approach among these households.13–16 However, evidence of CHW effectiveness in improving health outcomes is limited.14 In particular, the effectiveness of a CHW-based Healthy Homes program for controlling asthma has not been assessed.
Therefore, we developed the Seattle–King County Healthy Homes Project. We tested the hypothesis that a high-intensity intervention would be more effective than a low-intensity intervention for changing asthma-related behaviors, reducing trigger exposure, and decreasing asthma morbidity among low-income, ethnically diverse urban households. The high-intensity intervention consisted of 7 home visits by CHWs over a year and a full set of trigger control resources, whereas the low-intensity intervention included a single home visit and limited resources.
METHODS
Participants
A household was eligible for enrollment if it was home to a child aged 4–12 years with diagnosed persistent asthma; its income was below 200% of the 1996 federal poverty threshold or the child was enrolled in Medicaid; the caregiver was verbally proficient in English, Spanish, or Vietnamese; the child spent at least 50% of nights in the house; and the house was in King County. We defined persistent asthma as a caregiver report of persistent asthma symptoms in the child (using asthma rescue medication at least 4 times during the previous 2 weeks, having asthma symptoms at least 4 days during the previous 2 weeks, or waking at night because of asthma at least twice during the previous month17) and a clinical asthma diagnosis (diagnosis of asthma or reactive airways disease recorded in the outpatient medical record in the past year or at least 1 hospital or emergency department discharge with asthma as the primary diagnosis in the past 6 months). Exclusion criteria were a child with another chronic illness requiring daily medications, household participation in other asthma case management or care coordination programs in the past 2 years, or plans to leave King County during the next 6 months. Enrollment occurred between January 1999 and May 2000.
We recruited participants from community and public health clinics (65%), local hospitals and emergency departments (27%), and referrals from community residents and agencies (8%). Caregivers gave informed consent and received $110 for participation. Children provided assent. We followed community-based participatory research principles.18
Intervention
We randomly assigned participants to either a comprehensive intervention arm (“high intensity”) or a minimal intervention arm (“low intensity”). The 1-year-long high-intensity intervention was provided by CHWs, as described in a prior publication.19 A CHW conducted a structured home environmental assessment at the first visit. Each assessment finding generated specific actions for the participant and CHW. The CHW and participant prioritized the actions to prepare an action plan. Recent reviews summarize the scientific basis for selecting the actions.2,20–23 The CHW made 4–8 additional visits to encourage completion of the action plan, provide education and social support, deliver resources to reduce exposures (allergy control pillow and mattress encasements, low-emission vacuums, commercial-quality door mats, cleaning kits, referral to smoking cessation counseling, roach bait, rodent traps), offer assistance with roach and rodent eradication, and advocate for improved housing conditions. We also offered free skin-prick allergy testing at multiple clinic sites and at special asthma fairs.24 Social cognitive theory25 and the transtheoretical stages of change model26 guided our approach.
Members of the low-intensity group received a single CHW visit, which consisted of the home environmental assessment, an action plan, limited education, and bedding encasements. After completing exit data collection 1 year later, low-intensity group members received the full package of resources and additional education.
Measures
Primary prespecified outcomes were Pediatric Asthma Caregiver Quality of Life Scale27 score (ranging from 1 to 7, with higher scores indicating better quality of life), asthma symptom days (self-reported number of 24-hour periods during the 2 weeks before interview with asthma symptoms: wheeze, tightness in chest, cough, shortness of breath, slowing down activities because of asthma, or nighttime awakening because of asthma), and proportion with self-reported asthma-related urgent health service use during the past 2 months (emergency department, hospital, or unscheduled clinic visit).
Intermediate outcomes included participant self-report of behaviors related to trigger exposure and control, medication use, and school and work absences resulting from asthma. Presence of triggers in the home was assessed through interviewer observation and caregiver report.
Descriptive variables included a measure of asthma severity adapted from national guidelines;17 caregiver race, ethnicity, and educational attainment using US Census categories; and household income defined as a percentage of the 1996 federal poverty threshold ($15600 for a 4-person household).
Data Collection
Community members trained as interviewers collected baseline data before randomization and exit data 1 year later. Data collection consisted of an in-home interview in the participant’s preferred language, collection of a dust sample, and a standardized home inspection. To assess the durability of the intervention effect, interviewers collected data 6 months after exit from all high-intensity group members who completed the intervention. We did not follow up with the low-intensity group. Members of this group crossed over and received the high-intensity resources and additional CHW visits, making it impossible to measure the sustainability of the low-intensity intervention.
Sample Size
A group size of 107 participants provided 80% power to detect a difference between groups of 2 symptom days per 2-week period and 0.5 units in the caregiver’s quality-of-life score (the minimum clinically significant difference28) with α set at 0.05.
Randomization
We randomly assigned participants to groups using a permuted block design with varying block size. Sequence numbers and group allocation were concealed in sealed, opaque, numbered envelopes prepared centrally and provided sequentially to interviewers. The nature of the intervention made it impossible to blind participants and staff to group assignment.
Analysis
Analysis was based on original allocation, and no participants crossed over between groups. We examined baseline differences across groups with the t, Wilcoxon rank-sum, or χ2 tests. We used paired t, signed-rank, or McNemar tests to examine within-group baseline-to-exit changes. To examine across-group exit differences adjusted for baseline across-group differences, we used generalized estimating equation (GEE) models with the robust option (using the Huber/White/Sandwich estimator of variance) and the equal within-group working correlation structure.29 Models included the outcome as the dependent variable and group assignment (coded 0 for low-intensity group and 1 for high-intensity group), time (baseline or exit), and interaction of these 2 variables as independent variables. A P value of less than .05 for the interaction term indicated a statistically significant across-group difference.
The coefficient of the interaction term is the (high-intensity group exit-to-baseline mean change) – (low-intensity group exit-to-baseline mean change) in linear GEE models and the log ([exit-to-baseline odds ratio high-intensity group] / [exit-to-baseline odds ratio low-intensity group]) for logistic GEE models. Because the interpretation of these coefficients is somewhat complex, we used the Stata PREDICT function (Stata Corp, College Station, Tex) to generate linear GEE model–derived estimates of baseline and exit values for each group (or, for the logistic model, the predicted probabilities).
We tested for potential confounding by baseline variables (child’s age, gender, and asthma severity; household income; care-giver’s race/ethnicity, employment status, education, and marital status) by assessing whether inclusion of the variable changed the coefficient of the interaction term by more than 10%. No confounding was present, so these variables were not included in the models. We assessed whether significant (P < .05) interactions between the group × time interaction term and each of the baseline variables was present. We computed the number needed to treat (NNT) for continuous variables with the method of Guyatt et al.30 We performed an intention-to-treat analysis by using the baseline value of the outcome variable of interest as the exit value for participants who did not complete the study, which yields a conservative estimate of intervention effect. We used Stata version 7.0 (Stata Corp, College Station, Tex) to perform analyses. All analyses were 2 tailed.
Cost Analysis of Use of Urgent Care
The potential savings in urgent medical care costs were estimated as the product of the number of units of urgent care services multiplied by the unit cost of each service. Participants reported the number of units of urgent care services during the 2 previous months at baseline and at exit. We obtained 5 sets of unit costs from the health services literature31–34 and Washington State Medicaid data, and adjusted them to 2001 prices using the consumer price index for medical care.35 Sullivan et al.31 reported 1995 data on Medicaid reimbursements for children with asthma. Stroupe et al.32 reported 1995 medical center cost data for all care received by all patients with asthma. Weiss et al.33 reported national data on 1994 charges for asthma care for all patients with asthma. Lozano et al.34 reported 1992 data from a health maintenance organization on costs for asthma care for all patients with asthma. Washington State Medical Assistance Administration provided 2001 and 2002 data on Medicaid fee-for-service reimbursements for children with asthma from the subset of children who were not enrolled in managed care programs.
Each data set included the unit cost of 3 services: hospital admission, emergency department visit, and clinic visit. Each source of unit costs had strengths relative to the others and no source was uniformly more or less expensive for all 3 services. The cost per hospital admission ranged from $4309 to $8044, per emergency department visits ranged from $116 to $496, and per clinic visit ranged from $41 to 159. An average length of stay of 4.06 days33 was used to convert cost per hospital day31,34 to cost per admission. The potential savings were calculated once with each data set for a total of 5 estimates of potential savings, and results are reported as the range of the 5 estimates.
The cost of the intervention was also estimated and included salary and fringe benefits, supplies, rent, travel, office expenses, and indirect charges (13%).36 Project staffing changed during the course of the trial as efficiency improved, and we therefore estimated personnel costs based on the final staffing plan rather than the actual costs accrued over the life of the project.
RESULTS
Participation
We identified 1116 children with provider-diagnosed asthma and reached 714 (64%) of their caregivers (Figure 1 ▶). We randomly assigned 274 eligible and interested households to the study arms, producing groups balanced with respect to demographic characteristics and exposure to triggers, although asthma morbidity was modestly more severe in the high-intensity group (Table 1 ▶). Three-quarters of homes had at least 1 asthma trigger present, while 36% had 2 or more (Table 1 ▶).
FIGURE 1—
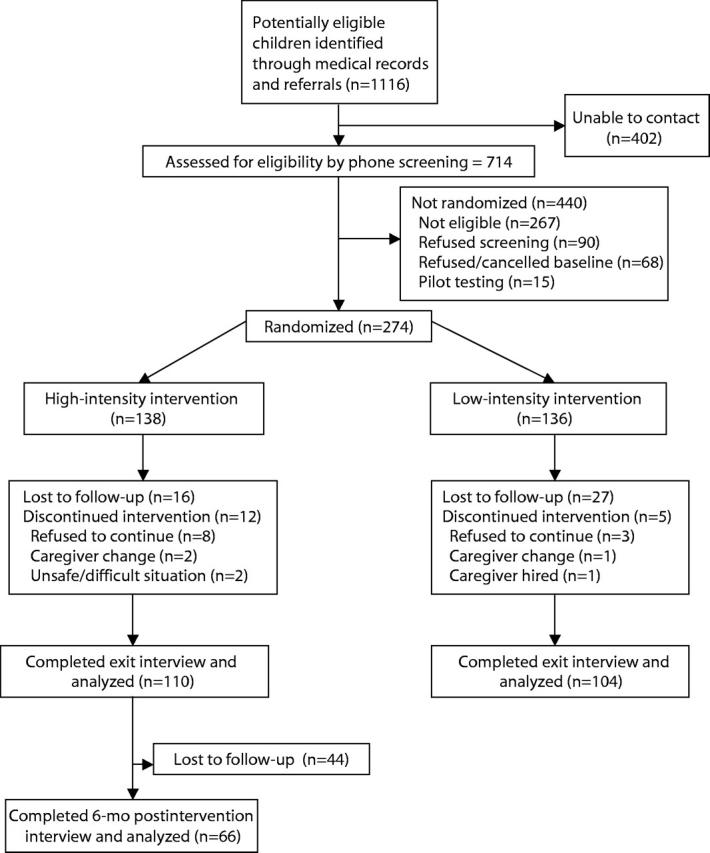
Flow of participants through the study.
TABLE 1—
Baseline Demographic Characteristics and Asthma Severity of Study Participants: Comparison of High- and Low-Intensity Groups
| High-Intensity Group (n = 138) | Low-Intensity Group (n = 136) | |
| Demographic characteristics | ||
| Child’s age (mean years) | 7.4 | 7.3 |
| Child’s gender (% male) | 55.8 | 61.8 |
| Caregiver’s ethnicity (%) | ||
| Non-Hispanic White | 12.3 | 21.3 |
| Non-Hispanic African American | 31.9 | 27.9 |
| Vietnamese | 25.4 | 22.1 |
| Other Asian | 9.4 | 5.2 |
| Hispanic | 17.4 | 17.7 |
| Other | 3.6 | 5.9 |
| Household income (%) | ||
| < 100% poverty | 51.9 | 60.9 |
| 100%–149% poverty | 33.3 | 24.1 |
| 150%–200% poverty | 14.8 | 15.0 |
| Caregiver’s education (%) | ||
| Less than high school | 40.9 | 37.6 |
| High school graduate or general equivalency diploma | 25.8 | 27.8 |
| Some college | 26.5 | 25.6 |
| College graduate | 6.8 | 9.0 |
| Single caregiver in household (%)a | 35.5 | 23.5 |
| Caregiver currently employed (%) | 47.8 | 57.4 |
| Caregiver’s mean age (years) | 35.9 | 34.6 |
| Caregiver rents home (%) | 81.9 | 83.0 |
| Asthma severity (%) | ||
| Mild intermittent | 20.3 | 27.2 |
| Mild persistent | 15.9 | 12.5 |
| Moderate persistent | 31.2 | 36.8 |
| Severe persistent | 32.6 | 23.5 |
| Urgent health use in past 2 months (%) | 25.9 | 21.3 |
| Caregiver quality-of-life scorea | 4.1 | 4.5 |
| Symptom days/2 weeks | 8.1 | 7.6 |
| Days with activity limited by asthma/2 weeks | 5.3 | 4.1 |
| Days used β2-agonist/2 weeks | 7.2 | 7.1 |
| Days used controller medications/2 weeks | 5.2 | 4.6 |
| Missed school in past 2 weeks—child (%) | 33.9 | 26.6 |
| Missed work in past 2 weeks—all adults (%) | 15.9 | 18.4 |
| Smoker in home (%) | 39.9 | 41.9 |
| Pet in home (%) | 20.4 | 26.9 |
| Mold (%) | 41.1 | 46.2 |
| Water damage/moisture/leak (%) | 17.8 | 23.9 |
| Roaches (observed or reported) (%) | 19.6 | 15.6 |
| Rodents (observed or reported) (%)a | 0.0 | 3.5 |
aP < .05 for between-group comparison.
The study was completed by 214 (78%) of the participants: 110 (80%) in the high-intensity group and 104 (76%) in the low-intensity group (Figure 1 ▶). Analysis of across-group differences was based on these participants. Those who completed the study were more likely to be Asian (35% vs. 15%, P = .002) and less likely to have pets (20% vs. 34%, P = .023); otherwise, the 2 groups were similar. Among participants completing the study, members of the 2 groups were similar at baseline (Tables 2 ▶ and 3 ▶).
TABLE 2—
Health and Functional Outcomes: Baseline and Exit Values and Comparison of Baseline-to-Exit Changes
| High-Intensity Group (n = 110) | Low-Intensity Group (n = 104) | Comparison of Baseline-to-Exit Changes Across Groups | |||||
| Base | Exit | Base | Exit | GEE Coefficient (95% CI)a | Odds Ratio (95% CI) | Pb | |
| Primary outcomes | |||||||
| Days with symptoms/2 weeks | 8.0 | 3.2** | 7.8 | 3.9** | −1.24 (−2.9, 0.4) | .138 | |
| Caregiver quality-of-life score | 4.0 | 5.6** | 4.4 | 5.4** | 0.58 (0.18, 0.99) | .005 | |
| Urgent health services use/ 2 months (%) | 23.4 | 8.4** | 20.2 | 16.4 | −0.97 (−1.8, −0.12) | 0.38 (0.16, 0.89) | .026 |
| Secondary outcomes | |||||||
| Days with activity limitation/ 2 weeks | 5.6 | 1.5** | 4.3 | 1.7** | −1.5 (−2.84, −0.15) | 0.22 (0.06, 0.86) | .029 |
| Days used β2-agonist/2 weeks | 7.5 | 4.0** | 6.9 | 4.0** | −0.23 (−1.88, 1.42) | .781 | |
| Days used controller medication/ 2 weeks | 5.9 | 3.5* | 4.4 | 3.6 | −1.03 (−2.79, 0.73) | .250 | |
| Missed school in past 2 weeks—child (%) | 31.1 | 12.2* | 28.4 | 20.3 | −0.77 (−1.70, 0.16) | 0.46 (0.18, 1.18) | .105 |
| Missed work in past 2 weeks—all adults (%) | 13.1 | 11.2 | 21.0 | 13.0 | .07 (−0.91, 1.05) | 1.07 (0.40, 2.85) | .890 |
aGEE coefficient refers to the coefficient of the group × time interaction term in the GEE model and represents (high-intensity group exit-to-baseline mean change) – (low-intensity group exit-to-baseline mean change) for continuous variables and the log (exit-to-baseline odds ratio high intensity group/exit-to-baseline odds ratio low intensity group) for binary variables. A negative coefficient value indicates greater benefit in the high-intensity group (with the exception of quality of life, in which a positive coefficient indicates greater benefit in the high-intensity group).
bP value refers to the significance level of the difference across groups, adjusted for baseline differences and within-group correlation.
*P < .005; **P < .001 (within-group comparison of baseline and exit values using the Wilcoxon matched pairs test or the McNemar test).
TABLE 3—
Trigger Reduction Behaviors: Baseline and Exit Values and Comparison of Baseline-to-Exit Changes
| High-Intensity Group (n = 110) | Low-Intensity Group (n = 104) | Comparison of Baseline-Exit Changes Across Groups | |||||||
| Base | Exit | P | Base | Exit | P | GEE Coefficient (95% CI)a | Odds Ratio (95% CI) | Pb | |
| Vacuum child’s bedroom at least twice/2 weeksc | 63.9 | 78.7 | ** | 62.5 | 64.4 | 0.73 (0.12, 1.35) | 2.08 (1.12, 3.84) | .020 | |
| Dust child’s bedroom at least twice/2 weeksc | 63.9 | 70.4 | 69.2 | 66.3 | 0.42 (−0.29, 1.13) | 1.52 (0.75, 3.08) | .250 | ||
| Vacuum cloth-covered furniture at least twice/2 weeks or remove itc | 35.5 | 64.5 | ** | 26.2 | 36.9 | * | 0.75 (0.03, 1.46) | 2.11 (1.03, 4.31) | .041 |
| Use doormat or remove shoesc | 67.3 | 88.1 | ** | 70.6 | 77.5 | 0.93 (0.12, 1.75) | 2.54 (1.13, 5.74) | .025 | |
| Use allergy control covers on mattress and pillowsc | 5.7 | 85.9 | ** | 7.8 | 71.8 | ** | 1.17 (.07, 2.28) | 3.24 (1.07, 9.77) | .037 |
| Wash sheets weekly and use hot wash or rinsec | 47.3 | 41.8 | 42.3 | 42.3 | .26 (−0.42, 0.95) | 1.30 (0.66, 2.58) | .452 | ||
| No pet in the homec | 81.5 | 81.5 | 77.9 | 75.0 | 0.10 (−0.40, 0.59) | 1.10 (0.67, 1.81) | .699 | ||
| No pet in child’s bedroom | 93.5 | 93.5 | 91.4 | 87.5 | 0.53 (−0.3, 1.36) | 1.70 (0.74, 3.91) | .210 | ||
| Caregiver does not smoke | 78.9 | 83.5 | 74.0 | 72.1 | 0.40 (−0.1, 0.9) | 1.49 (0.38, 2.45) | .115 | ||
| No smoking allowed in the homec | 80.0 | 77.3 | 76.0 | 79.8 | −0.38 (−1.15, 0.38) | 0.68 (0.32, 1.47) | .328 | ||
| Working bath exhaust fan present and usedc | 55.5 | 73.3 | ** | 68.1 | 68.1 | 0.71 (−0.07, 1.5) | 2.04 (0.93, 4.48) | .074 | |
| Working kitchen exhaust fan present and usedc | 70.9 | 67.3 | 54.8 | 70.2 | ** | −0.8 (−1.44, −0.17) | 0.45 (0.23, 0.84) | .013 | |
| Behavior summary score | 6.5 | 8.0 | ** | 6.4 | 7.3 | ** | 0.41 (−0.13, 0.95) | .141 | |
Note. All values are percentages of group unless otherwise indicated, except the behavior summary score.
aGEE coefficient refers to the coefficient of the group x time interaction term in the GEE model, and represents (high-intensity group exit-to-baseline mean change) – (low-intensity group exit-to-baseline mean change) for continuous variables and the log (exit-to-baseline odds ratio high-intensity group/exit-to-baseline odds ratio low-intensity group) for binary variables. A positive coefficient value indicates greater benefit in the high-intensity group.
bP refers to the significance level of the difference across groups, adjusted for baseline differences and within-group correlation
cItems included in the behavior summary score.
*P < .05; **P < .01 (within-group comparison of baseline and exit values using the Wilcoxon matched-pairs test or the McNemar test).
Primary Outcomes
The high-intensity intervention yielded significantly greater benefit in caregiver quality-of-life (GEE group × time interaction coefficient = 0.58 points [95% confidence interval [CI] = 0.18, 0.99], P = .005, NNT = 4.8), with the difference in the change across groups exceeding the clinically significant threshold of 0.528 (Table 2 ▶). Urgent health services use declined significantly more in the high-intensity group (GEE group × time interaction coefficient = −0.97; 95% CI = −1.82, −0.12; P = .026; NNT = 12.9). The absolute change in the proportion with urgent use in the past 2 months was 17.0% in the high-intensity group and 4.6% in the low-intensity group, adjusted for baseline differences and within-group correlations, using the Stata PREDICT function. Symptom days decreased more in the high-intensity group, but the difference between groups was not significant (GEE group × time interaction coefficient = −1.24 days; 95% CI = −2.88, 0.40; P = .138). Intention-to-treat analysis yielded similar results: Improvements in quality of life and urgent health services use were greater in the high-intensity group (P = .009 and .062, respectively). We observed no interactions between group allocation and child’s age, child’s asthma severity, caregiver’s educational attainment, or care-giver’s race/ethnicity.
These across-group differences were attributable to greater improvements within the high-intensity group relative to the low-intensity group. The high-intensity group showed greater and statistically significant improvement in all 3 primary outcome measures (Table 2 ▶). Symptom days decreased by 4.7 (95% CI = 3.6, 5.9). The proportion with urgent health services use decreased absolutely by 15% (95% CI = 6.3, 23.6). The caregiver-quality-of-life score increased by 1.6 (95% CI = 1.3, 1.9). In the low-intensity group, symptom days also decreased significantly (3.9 days, 95% CI = 2.6–5.2), and quality of life improved (1.0, 95% CI = 0.7, 1.3), while urgent health services use did not change (absolute increase 3.8%; 95% CI = −5.4, 13.1).
Secondary Outcomes
Both groups showed statistically significant improvements in most secondary outcome measures. Missed work days did not improve in either group. Need for asthma controller medications and missed school or child care decreased only in the high-intensity group (Table 2 ▶). Although there was a trend toward greater improvement in the high-intensity group for most measures, the degree of improvement in the high-intensity group was statistically greater only for activity limitation due to asthma.
Behavior Changes
The frequencies of actions to reduce dust exposure and the use of bedding encasements increased more in the high-intensity group (Table 3 ▶). Kitchen ventilation improved more in the low-intensity group. Neither group increased the frequency of washing sheets or dusting nor reduced exposure to pets (although pet ownership was uncommon among participants) and smoking in the home. The behavior summary score improved in both groups, and the across-group difference was not significant.
Cost Analysis of Use of Urgent Care
Urgent care costs (hospital admissions, emergency department visits, and unscheduled clinic visits) during the 2 months before the exit interview were $6301–$8856 less in the high-intensity group ($57 to $80 per child) relative to the low-intensity group. The lower estimates were based on data from Sullivan et al.,31 Stroupe et al.,32 and Lozano et al.,34 whereas the higher estimates were based on data from the Washington State Medicaid Program and Weiss.33 Within the high-intensity group, the estimated decrease in 2-month costs between baseline and exit ranged from $22084 to $36700 ($201 to $334 per child), and within the low-intensity group, they ranged from $19246 to $32756 ($185 to $315 per child).
Process Measures and Sustainability in the High-Intensity Group
A CHW made a mean of 7 visits to each high-intensity participant. Fewer than 20% required the maximum allowed 9 visits. The mean visit length was 1 hour. The gains in health outcomes and behaviors at exit persisted for 6 months after the intervention ended, with a tendency for further improvement across all outcomes (data not shown).
DISCUSSION
Low-income households with children with asthma that received multiple visits from community health workers and resources to reduce exposure to asthma triggers experienced significantly reduced urgent health services use and improved caregiver quality-of-life score relative to households receiving a single visit from a CHW and no resources other than bedding encasements. The intervention effect was equivalent across caregivers of all race/ethnic groups and educational attainments and among children of all ages and asthma severities. Households receiving the high-intensity intervention demonstrated significant improvements in care-giver quality-of-life, child’s asthma symptoms, and health care use. Those receiving the low-intensity intervention showed smaller improvements that reached statistical significance for quality-of-life and symptoms.
Analysis of intermediate measures indicates that these differences may have been partly attributable to intervention intensity. Participant actions to reduce exposures generally increased in the high-intensity group but not in the low-intensity group. Floor dust loading decreased significantly more in the high-intensity group than in the low-intensity group.37 Differences in medical management did not explain the differences; the intensity of asthma treatment measured by the use of controller asthma medications and routine asthma care visits did not increase in either group.
These findings, along with the results of two prior studies, support the value of interventions aimed at reducing exposure to multiple indoor asthma triggers. The recently published Inner City Asthma Study38 demonstrated that an in-home multifaceted environmental intervention decreased asthma symptoms and exposure to indoor allergens. The project was designed as an efficacy study and used research assistants to conduct home visits, unlike our project, which was an effectiveness study using CHWs. A smaller study by Carter and colleagues also supported the concept of addressing multiple triggers but used physician home visits, which may prove too costly for widespread implementation.39 Previous studies directed at single triggers, such as dust mites40–42 and environmental tobacco smoke,43 have yielded mixed results,2 perhaps because of the limited effectiveness of addressing a single trigger. Small sample size or inability to effectively motivate participant behavior change may have also contributed to negative findings.
Several factors may have contributed to the intervention’s effectiveness. First, CHWs may be particularly successful in promoting behavior change because they share community, culture, and life experiences with their clients and are readily welcomed into the home.14,16 The CHWs developed motivating relationships with their clients, who rated them highly.19 Second, CHWs educated clients about asthma triggers, information frequently not imparted by health providers (e.g., at baseline, 61% of participants reported receiving education from their providers regarding pets, 55% regarding dust mites, 37% regarding bedding encasements, 30% regarding moisture and mold, and 14% regarding roaches). Third, the intervention offered resources for trigger reduction. Fourth, a home-based intervention permitted direct assessment of the indoor environment and offered opportunities for demonstration and coaching. Fifth, the CHWs used an individualized approach to address each participant’s most pressing concerns, both asthma related and others (e.g., housing, income). Finally, the use of community-based participatory research methods made the project responsive to participant needs and feasible to implement.
This study provides new information regarding the role of CHWs in asthma control. We could not locate any published controlled trials of their use in asthma14 and found only 3 uncontrolled studies.15,44,45 Studies evaluating asthma health education have generally employed health professionals who provide services outside the home.46–49 Clients often find it difficult to attend classes outside the home. CHWs are less costly than other health professionals and may establish rapport more readily with clients.
The high-intensity intervention may be cost saving relative to the low-intensity intervention. The estimated marginal cost of the high-intensity intervention relative to the low-intensity intervention was $124000, or $1124 per child. The savings in urgent care cost (hospital admissions, emergency department visits, and unscheduled clinic visits) during a 2-month period ranged from $57 to $80 per child. These bimonthly savings are likely to persist for several years. Although this study did not collect follow-up data on both groups, we do know that use of urgent care remained low among the high-intensity group for at least 6 months following the intervention. If the lowered urgent care costs observed at study exit among the high-intensity group persisted for 3–4 years, the high-intensity intervention would be cost saving relative to the low-intensity group. The savings per child, discounted at 3% per year, would range from $972 to $1366 for 3 years and from $1316 to $1849 for 4 years.
Special Considerations
Our conclusions are subject to several limitations. It was impossible to blind participants to group assignment. In some cases, participants revealed assignment to exit interviewers, which may have biased collection of self-reported measures. However, objective measures such as surface dust loading were consistent with self-reported measures in showing an intervention effect.37
Loss to follow-up may have biased results if systematic differences in drop-outs had occurred across groups. However, subject retention overall was 78% and did not differ between groups. Among participants completing the study, baseline characteristics of the 2 groups were similar.
The improvements seen in the low-intensity group indicate that a single visit along with bedding encasements may be beneficial. The effectiveness of bedding encasements has been questioned recently,41,42 indicating that the CHW education and action plan may have been the relevant components of the low-intensity intervention. However, our study did not include a usual-care comparison group, which raises the concern that the observed changes in the low-intensity group may have been caused by regression to the mean, temporal trends, or Hawthorne effects.50 A recent trial with participants similar to ours reported a decline of 1.5 symptom days per 2-week period in a control group,48 significantly smaller than the 3.9 days we documented in our low-intensity group. Whether or not the low-intensity intervention was effective, the high-intensity intervention produced greater benefit.
We did not include a usual-care comparison group because we believed that it would have been unethical to enroll participants and not provide them with interventions considered beneficial at the time the study was initiated, such as bedding encasements40 or health education.46,47 Our community partners advised strongly against the use of a usual-care control group, and there is growing debate in the medical literature regarding the appropriateness of placebo-controlled trials.51
Our project did not include all possible interventions to contain costs. For example, we did not remediate structural deficiencies in the home or provide professional house-cleaning services. We were able to complete allergy testing in only 23% of participants despite extensive efforts; testing would have permitted more precise focusing on specific triggers. Expanding the CHW role to include assistance with the medical aspects of asthma control may have provided additional benefits. Focusing on environmental interventions allowed us to isolate the effects of this aspect of asthma control.
Policy Issues
CHW services are not reimbursed by health care payors. Payors may consider supporting these services as evidence of their effectiveness and information about their cost accumulate. Strategies for improving indoor environmental quality must go beyond the actions of household members to include remediation of underlying structural conditions that increase trigger levels. Updating and enforcing housing codes to promote Healthy Homes principles are needed,52 as are policies that ensure access to housing units offering healthy living conditions. Tenants who request repairs need protection from rent increases or retaliation. Including other indoor health hazards beyond asthma triggers may be cost-effective.20,53
Conclusions
Our findings indicate that a Healthy Homes intervention in which community health workers provide education and support to reduce exposure to in-home asthma triggers can reduce asthma morbidity and health service use. Further work will define the place of this approach in the broader context of asthma control.
Acknowledgments
Primary funding was provided by the National Institute of Environmental Health Sciences (grant 5 R21 ES09095 to James Krieger, principle investigator). Additional support was provided by Seattle Partners for Healthy Communities (a Centers for Disease Control and Prevention–funded Urban Research Center) (grant U48/CCU009654-07), the Nesholm Foundation, and the Seattle Foundation.
The Hoover Vacuum Company provided low-emission vacuums at cost. Group Health Cooperative of Puget Sound donated free enrollment in their Free & Clear tobacco cessation program. The Local Hazardous Waste Management Program of King County donated green cleaning kits and pails.
Linda Graybird, Sharon Harris, Blythe Horman, and Scott Jones provided administrative support. Tianji Yu designed the database and tracking system. Lisa Lopez, Barbara Monsey, and Liz Quinn served as research coordinators. Kristy Seidel consulted on statistical analysis. The project community health workers, Zhoni Gilbert, Jean Jackson, Margarita Mendoza, Nilsa Nicholson, Matthew Nguyen, and LaTanya Wilson, worked devotedly with their clients. Carol Allen and Georgiana Arnold coordinated field operations. Sanders Chai, Amy Duggan, Jane Koenig, John Roberts, James Stout, and Todd Yerkes participated on the project Steering Committee. Harriet Amman, David Bates, Thomas Platts-Mills, and Gail Shapiro served on the Scientific Advisory Group. Carol S. Collins, Ha Vu Minh Duong, Rochelle (Toni) Gibson, Rosie Williams Gordon, Augustine Evon Hampton, Doi Le, Celese McDuffie, Kelly (Trinh) Nguyen, Son Thuy Nguyen, Lauretta Perkins, Mary Tranh Pham, Quoi V. Phung, Debbie Rosenthal, Joann Sampson, Nura Sayed, and Robin Shields participated on the Parent Advisory Group.
We thank Gail Shapiro and David Evans for providing helpful comments on the article.
Note. The opinions expressed in this article are those of the authors.
Peer Reviewed
Contributors J. Krieger originated the study, obtained funding, supervised all aspects of its implementation and analysis, and wrote the article. T. Takaro participated in study design, supervised environmental data collection, and participated in data analysis. L. Song managed data and conducted the analyses. M. Weaver designed and conducted the cost analysis. All authors helped plan and implement the study, interpreted findings, and reviewed drafts of the article.
Human Participant Protection This study was approved by the Children’s Hospital and Regional Medical Center institutional review board.
References
- 1.Mannino DM, Homa DM, Akinbami LJ, Moorman JE, Gwynn C, Redd SC. Surveillance for asthma—United States, 1980–1999. MMWR Surveill Summ. 2002;51: 1–13. [PubMed] [Google Scholar]
- 2.Institute of Medicine. Clearing the Air: Asthma and Indoor Air Exposures. Washington, DC: National Academy Press; 2000.
- 3.Custovic A, Woodcock A. On allergens and asthma (again): does exposure to allergens in homes exacerbate asthma? Clin Exp Allergy. 2001;31:670–673. [DOI] [PubMed] [Google Scholar]
- 4.Sarpong SB, Karrison T. Sensitization to indoor allergens and the risk for asthma hospitalization in children. Ann Allergy Asthma Immunol. 1997;79:455–459. [DOI] [PubMed] [Google Scholar]
- 5.Eggleston PA, Buckley TJ, Breysse PN, Wills-Karp M, Kleeberger SR, Jaakkola, JJK. The environment and asthma in US inner cities. Environ Health Perspect. 1999;107(suppl 3):439–450. [DOI] [PMC free article] [PubMed] [Google Scholar]
- 6.Healthy Homes for Healthy Kids. Health Care for All Web site. Available at: http://www.hcfama.org/hcfa_contents.php3?fldID=92. Accessed August 5, 2003.
- 7.Leung R, Koenig JQ, Simcox N, van Belle G, Fenske R, Gilbert SG. Behavioral changes following participation in a home health promotional program in King County, Washington. Environ Health Perspect. 1997;105:1132–1135. [DOI] [PMC free article] [PubMed] [Google Scholar]
- 8.Healthy House. Environmental Health Watch Web site. Available at: http://www.ehw.org/Healthy_House/HH_home.htm. Accessed August 5, 2003.
- 9.National Institute of Environmental Health Sciences. Community-Based Participatory Research and Environmental Justice: Partnerships for Communication Programs. Available at: http://www.niehs.nih.gov/translat/cbpr/proj2001.htm; http://www.niehs.nih.gov/translat/envjust/ej-desc.htm. Accessed June 28, 2004.
- 10.US Department of Housing and Urban Development, Office of Healthy Homes and Lead Hazard Control. Available at: http://www.hud.gov/offices/lead/hhi/hhigrantee_summaries.cfm. Accessed June 28, 2004.
- 11.US Environmental Protection Agency, Asthma Education and Outreach Program. Available at: Alliance for Healthy Homes. Available at: http://www.afhh.org. Accessed November 17, 2004.
- 12.Eggleston PA. Urban children and asthma. Immunol Allergy Clin North Am. 1998;18:75–84. [Google Scholar]
- 13.Krieger J, Collier C, Song L, Martin D. Linking community-based blood pressure measurement to clinical care: a randomized controlled trial of outreach and tracking by community health workers. Am J Public Health. 1999;89:856–861. [DOI] [PMC free article] [PubMed] [Google Scholar]
- 14.Swider SM. Outcome effectiveness of community health workers: an integrative literature review. Public Health Nurs. 2002;19:11–20. [DOI] [PubMed] [Google Scholar]
- 15.Butz AM, Malveaux FJ, Eggleston P, et al. Use of community health workers with inner-city children who have asthma. Clin Pediatr (Phila). 1994;33: 135–141. [DOI] [PubMed] [Google Scholar]
- 16.Love MB, Gardner K, Legion V. Community health workers: who they are and what they do. Health Educ Behav. 1997;24:510–522. [DOI] [PubMed] [Google Scholar]
- 17.National Asthma Education and Prevention Program. Expert Panel Report 2: Guidelines for the Diagnosis and Management of Asthma. Bethesda, Md: National Heart, Lung, and Blood Institute; 1997.
- 18.Krieger J, Allen C, Cheadle A, et al. Using community-based participatory research to address social determinants of health: lessons learned from Seattle Partners for Healthy Communities. Health Educ Behav. 2002; 29:361–382. [DOI] [PubMed] [Google Scholar]
- 19.Krieger JK, Takaro TK, Allen C, et al. The Seattle-King County Healthy Homes Project: implementation of a comprehensive approach to improving indoor environmental quality for low-income children with asthma. Environ Health Perspect. 2002;110(suppl 2):311–322. [DOI] [PMC free article] [PubMed] [Google Scholar]
- 20.Committee on Environmental Health. Handbook of Pediatric Environmental Health. Elk Grove Village, Ill: American Academy of Pediatrics; 1999.
- 21.Platts-Mills TA, Vaughan JW, Carter MC, Wood-folk JA. The role of intervention in established allergy: avoidance of indoor allergens in the treatment of chronic allergic disease. J Allergy Clin Immunol. 2000; 106:787–804. [DOI] [PubMed] [Google Scholar]
- 22.Tovey E, Marks G. Methods and effectiveness of environmental control. J Allergy Clin Immunol. 1999; 103:179–191. [DOI] [PubMed] [Google Scholar]
- 23.Eggleston PA, Bush RK. Environmental allergen avoidance: an overview. J Allergy Clin Immunol. 2001; 107(3 suppl):S403–405. [DOI] [PubMed] [Google Scholar]
- 24.Nelson H. Clinical application of immediate skin testing. In: Spector SL, ed. Provocative Challenge Procedures. New York, NY: Marcel Dekker; 1995.
- 25.Baranowski T, Perry CL, Parcel GS. How individuals, environments and health behavior interact: social cognitive theory. In: Glanz K, Lewis FM, Rimer, BK, eds. Health Behavior and Health Education, 2nd ed. San Francisco, Calif: Jossey-Bass; 1997.
- 26.Prochaska JO, Redding CO, Evers KE. The transtheoretical model and stages of change. In: Glanz K, Lewis FM, Rimer, BK, eds. Health Behavior and Health Education, 2nd ed. San Francisco, Calif: Jossey-Bass, 1997.
- 27.Juniper EF, Guyatt GH, Feeny DH, et al. Measuring quality of life in the parents of children with asthma. Quality Life Res. 1996;5:27–34. [DOI] [PubMed] [Google Scholar]
- 28.Juniper EF, Guyatt GH, Willan A, Griffith LE. Determining a minimal important change in a disease-specific quality of life questionnaire. J Clin Epidemiol. 1994;47:81–87. [DOI] [PubMed] [Google Scholar]
- 29.Hardin JW, Hilbe JM. Generalized Estimating Equations. New York, NY: Chapman & Hill/CRC; 2003.
- 30.Guyatt GH, Juniper EF, Walter SD, Griffith LE, Goldstein RS. Interpreting treatment effects in randomised trials. BMJ. 1998;316:690–693. [DOI] [PMC free article] [PubMed] [Google Scholar]
- 31.Sullivan SD, Weiss KB, Lynn H, et al. National Cooperative Inner-City Asthma Study (NCICAS) Investigators. The cost-effectiveness of an inner-city asthma intervention for children. J Allergy Clin Immunol. 2002; 110:576–581. [DOI] [PubMed] [Google Scholar]
- 32.Stroupe KT, Gaskins D, Murray MD. Health-care costs of inner-city patients with asthma. J Asthma. 1999; 36:645–655. [DOI] [PubMed] [Google Scholar]
- 33.Weiss KB, Sullivan SD, Lyttle C. Trends in the cost of illness for asthma in the United States, 1985–1994. J Allergy Clin Immunol. 2000;106:493–499. [DOI] [PubMed] [Google Scholar]
- 34.Lozano P, Fishman P, VonKorff M, Hecht J. Health care utilization and cost among children with asthma who were enrolled in a health maintenance organization. Pediatrics. 1997;99:757–764. [DOI] [PubMed] [Google Scholar]
- 35.U.S. Bureau of Labor Statistics. Consumer Price Index—All Urban Consumers. US city average, medical care, not seasonally adjusted. Available at http://www.bls.gov/data/home.htm. Accessed on January 19, 2003.
- 36.Balas EA, Kretschmer RAC, Gnann W, et al. Interpreting cost analyses of clinical interventions. JAMA. 1998;279:54–57. [DOI] [PubMed] [Google Scholar]
- 37.Takaro T, Krieger JW, Song L. Effect of environmental interventions to reduce exposure to asthma triggers in homes of low-income children in Seattle. J Expo Anal Enviro Epidemiol. In press. [DOI] [PubMed]
- 38.Morgan WJ, Crain EF, Gruchalla RS, et al. Results of a home-based environmental intervention among urban children with asthma. N Engl J Med. 2004;351: 1068–1080. [DOI] [PubMed] [Google Scholar]
- 39.Carter MC, Perzanowski MS, Raymond A, et al. Home intervention in the treatment of asthma among inner-city children. J Allergy Clin Immunol. 2001;108: 732–737. [DOI] [PubMed] [Google Scholar]
- 40.Ehnert B, Lau-Schadendorf S, Weber A, Buettner P, Schou C, Wahn U. Reducing domestic exposure to dust mite allergen reduces bronchial hyperreactivity in sensitive children with asthma. J Allergy Clin Immunol. 1992;1:135–138. [DOI] [PubMed] [Google Scholar]
- 41.Woodcock A, Forster L, Matthews E, et al. Medical Research Council General Practice Research Framework: control of exposure to mite allergen and allergen-impermeable bed covers for adults with asthma. N Engl J Med. 2003;17;349:225–236. [DOI] [PubMed] [Google Scholar]
- 42.Gotzsche PC, Johansen HK, Burr ML, Hammarquist C. House dust mite control measures for asthma. Cochrane Database Syst Rev. 2001;(3):CD001187. [DOI] [PubMed]
- 43.Wilson SR, Yamada EG, Sudhakar R, et al. A controlled trial of an environmental tobacco smoke reduction intervention in low-income children with asthma. Chest. 2001;120:1709–1722. [DOI] [PubMed] [Google Scholar]
- 44.Stout JW, White LC, Rogers LT, et al. The Asthma Outreach Project: a promising approach to comprehensive asthma management. J Asthma. 1998;35:119–127. [DOI] [PubMed] [Google Scholar]
- 45.Baier C, Grant EN, Daugherty SR, Eckenfels EJ. The Henry Horner Pediatric Asthma Program. Chest. 1999;116(suppl 1):204S–206S. [DOI] [PubMed] [Google Scholar]
- 46.Lewis CE, Rachelefsky G, Lewis MA, de la Sota A, Kaplan M. A randomized trial of A.C.T. (asthma care training) for kids. Pediatrics. 1984;74:478–486. [PubMed] [Google Scholar]
- 47.Clark NM, Feldman CH, Evans D, Levison MJ, Wasilewski Y, Mellins RB. The impact of health education on frequency and cost of health care use by low income children with asthma. J Allergy Clin Immunol. 1986;78:108–115. [DOI] [PubMed] [Google Scholar]
- 48.Evans R, Gergen PJ, Mitchell H, et al. A randomized clinical trial to reduce asthma morbidity among inner-city children: results of the National Cooperative Inner-City Asthma Study. J Pediatr. 1999;135: 332–338. [DOI] [PubMed] [Google Scholar]
- 49.Guevara JP, Wolf FM, Grum CM, Clark NM. Effects of educational interventions for self management of asthma in children and adolescents: systematic review and meta-analysis. BMJ. 2003;326:308–309. [DOI] [PMC free article] [PubMed] [Google Scholar]
- 50.Greineder DK, Loane KC, Parks P. Outcomes for control patients referred to a pediatric asthma outreach program: an example of the Hawthorne effect. Am J Manag Care. 1998;4:196–202. [PubMed] [Google Scholar]
- 51.Emanuel EJ, Miller FG. The ethics of placebo-controlled trials—a middle ground. N Engl J Med. 2001; 345:915–919. [DOI] [PubMed] [Google Scholar]
- 52.Krieger J, Higgins DL. Housing and health: time again for public health action. Am J Public Health. 2002;92:758–768. [DOI] [PMC free article] [PubMed] [Google Scholar]
- 53.Schneider D, Freeman N. Children’s Environmental Health: Reducing Risk in a Dangerous World. Washington, DC: American Public Health Association; 2000.