

Abstract
Objectives. We compared trends in and correlates of marijuana use, cocaine use, and heavy alcohol use for adolescents of Mexican American, Puerto Rican, Cuban, and other Latin American heritage in the United States.
Methods. We used/examined data from nationally representative samples of eighth-grade Hispanic students who participated in the Monitoring the Future study during the years 1991–2002 (n=24235).
Results. Drug use was significantly higher among boys and adolescents of almost all Hispanic ethnicities who did not live with both parents. In addition, drug use differed considerably according to ethnic group on language first spoken, parental education, urbanicity, and region.
Conclusions. A better understanding of the homogeneity and heterogeneity of drug use patterns within and between Hispanic groups should assist in the development of prevention programs.
Despite recent downward trends in drug use among American youths, drug use among Hispanic young people remains disturbingly high.1,2 The relatively high prevalence of drug use among Hispanic youths is of particular concern because of recent demographic trends: relative to the general population, Hispanic youths have higher school dropout rates,3 a higher proportion of families living in poverty,4 and a higher proportion of births among 15- to 19-year-old women.5 Furthermore, the Hispanic population is significantly younger than the general population, has the highest fertility rate among all racial and ethnic groups,6 and has become the largest racial and ethnic minority group in the United States.7 The US Census Bureau estimated that by the year 2050, Hispanics will make up nearly 25% of the total population.8
These demographic and social trends underscore the need to increase our understanding of drug use among Hispanic youths. To date, however, most studies of adolescent drug use either have not included data on Hispanic adolescents or have aggregated data across groups, thus failing to capture the potential heterogeneity that exists within the broad Hispanic population. The limited number of studies that provide information about drug use among specific Hispanic ethnicities have generally been confined to a single school district, a city, or a small cluster of cities.9–12
We addressed some of the limitations of prior research and sought to increase knowledge about patterns, trends, and sociodemographic correlates of substance use within the largest subgroups of the Hispanic population. We focused on eighth-grade students to identify sociodemographic correlates of drug use among a nationally representative sample of Hispanic students before their transition to high school, when they might be at greater risk of dropping out of school.3 The sociodemographic characteristics we found to be associated with drug use could serve as targets of prevention interventions among youths who are at the early stages of drug involvement. Guided by previous research that found drug use to vary according to gender, acculturation level, socioeconomic status (SES), and parental influence,13–15 we focused specifically on assessing the magnitude of variation in drug use among a nationally representative sample of Hispanic eighth-grade students.
METHODS
Sample and Survey Methods
We used 1991–2002 data from the University of Michigan’s Monitoring the Future project. The design and methods are summarized briefly here; a detailed description is available elsewhere.16 The Monitoring the Future study employs a multistage sampling design to obtain nationally representative samples of secondary school students (i.e., 8th-, 10th-, and 12th-grade students) from the 48 contiguous states. Data have been collected annually from high school seniors since 1975. Beginning in 1991, data have been collected annually from 8th- and 10th-grade students. The sampling procedures involve 3 stages17: (1) geographic regions are selected, (2) schools are selected (without replacement)—approximately 420 each year, (3) between 42000 and 49000 students are sampled annually from within schools. Sample weights are assigned to each student to account for school sample sizes as well as for any variation in selection probabilities that occurs at earlier stages of the sampling procedures.
The analyses presented here focus on a sample of 24 235 students who self-identified as Mexican American, Puerto Rican, Cuban American, or other Latin American ethnicity. To examine trends in drug use, we aggregated data into four 3-year intervals (1991–1993, 1994–1996, 1997–1999, 2000–2002). To determine how these trends compared with the entire US population, we included trend data for all eighth-grade students who participated in the Monitoring the Future study.
To examine differences in the distribution of drug use by demographic and social characteristics, we aggregated data for the entire 1991–2002 period to obtain a sufficiently large number of respondents to permit inferences regarding each of the population groups.
Measures
Students completed a self-administered, machine-readable questionnaire during a normal class period. Student response rates averaged approximately 90% for eighth-grade students. Absence on the day of data collection was the primary reason that students were missed; fewer than 1% of students were estimated to have refused to complete the questionnaire.
The dependent variables were defined as the proportion of students who (1) used marijuana during the past 12 months, (2) used cocaine during the past 12 months, and (3) drank heavily (consumption of 5 or more drinks in a row on at least 1 occasion) during the past 2 weeks. The predictor variables were gender, language first spoken as a child, parental education, number of parents living in the household, urbanicity, and region. Gender was measured by the question “What is your sex?” and the following response categories: male, female. Language first spoken was measured by the question “What was the first language you spoke when you were a child?” and the following response categories: English, Spanish, some other language. We excluded the latter response category because the percentage of Hispanic students who answered that they first spoke a language other than English or Spanish was too small (Table 1 ▶). Parental education (as a proxy for SES) was defined as the average of the father’s and the mother’s educational attainment (with 1 missing data case permitted). The measure was coded as follows: 1 = completed grade school or less, 2 = completed some high school, 3 = completed high school, 4 = completed some college, 5 = completed college, 6 = completed graduate or professional school after college. Number of parents living in the household was measured as students who did not live with either parent, students living with only 1 parent, and students living with both parents. Urbanicity was determined by the US Census Bureau’s classification of the area in which the school was located: large metropolitan statistical area (MSA), small or medium-sized MSA, or no MSA. Region was the geographic region of the country in which the school was located (Northeast, North Central, South, and West).
TABLE 1—
Demographic Characteristics of Mexican American, Puerto Rican, Cuban American, and Other Latin American Eighth-Grade Students: Monitoring the Future 1991–2002
| Mexican American Students (n = 16 280) | Puerto Rican Students (n = 3403) | Cuban American Students (n = 997) | Other Latin American Students (n = 3555) | |
| Gender, % | ||||
| Male | 49.4 | 48.3 | 59.0 | 49.6 |
| Female | 50.6 | 51.7 | 41.0 | 50.4 |
| First language spoken as a child, % | ||||
| English | 50.7 | 54.6 | 35.0 | 34.6 |
| Spanish | 48.8 | 43.4 | 59.4 | 62.5 |
| Other | 0.5 | 2.0 | 5.6 | 2.9 |
| Parent’s education score,a % | ||||
| 1.0–2.0 | 36.7 | 20.3 | 11.2 | 19.2 |
| 2.5–3.0 | 29.7 | 30.6 | 18.6 | 22.4 |
| 3.5–4.0 | 19.2 | 24.0 | 21.5 | 22.2 |
| 4.5–5.0 | 10.2 | 16.8 | 27.2 | 21.9 |
| 5.5–6.0 | 4.2 | 8.3 | 21.5 | 14.3 |
| No. of parents in household, % | ||||
| 0 | 5.4 | 8.5 | 6.1 | 4.0 |
| 1 | 22.3 | 31.3 | 22.2 | 24.5 |
| 2 | 72.3 | 60.2 | 71.7 | 71.5 |
| Urbanicity, % | ||||
| Large MSA | 30.8 | 39.1 | 39.5 | 49.7 |
| Small to medium MSA | 58.6 | 55.9 | 54.6 | 43.0 |
| Non-MSA | 10.6 | 5.0 | 5.9 | 7.3 |
| Region, % | ||||
| Northeast | 1.0 | 61.2 | 16.9 | 32.0 |
| North Central | 6.2 | 14.9 | 7.5 | 8.1 |
| South | 40.6 | 18.9 | 67.7 | 30.5 |
| West | 52.2 | 5.0 | 7.9 | 29.4 |
Note. MSA = metropolitan statistical area. Total numbers are weighted.
aParental education (as a proxy for socioeconomic status) was defined as the average of father’s and mother’s educational attainment (with 1 missing data case permitted). The measure was coded as follows: 1 = completed grade school or less, 2 = completed some high school, 3 = completed high school, 4 = completed some college, 5 = completed college, 6 = completed graduate or professional school after college.
Finally, students’ Hispanic ethnicity was measured by “How do you describe yourself?” and the following response categories: Mexican American or Chicano, Puerto Rican, Cuban American, or other Latin American. We recognized that the “other Latin American” response category included a very heterogeneous population, possibly masking important within- and between-group differences. Unfortunately, more refined measures for these populations were not available in our data sets. Nevertheless, the response categories provided allowed us to analyze drug use among the largest Hispanic ethnic groups in the United States
Data Analysis
We used Stata version 8.0 (Stata Corporation, College Station, Tex) to estimate between- and within-group differences in the weighted proportion of drug use and to account for design effects in calculating variance estimates. To estimate adjusted odds ratios for the study’s predictors and the dependent variables, we used weighted multiple logistic regression analysis with listwise deletion of missing cases and with adjustment for standard errors to account for the complex sampling design. To be certain that no bias resulted from use of the listwise deletion strategy, we conducted the same multivariate analyses with a missing response category added to each of the predictors to represent the missing data cases on the predictor. In these special analyses, no individuals were deleted because of missing data. The results did not show any appreciable effect on the estimated odds ratios and corresponding confidence intervals. Most estimates did not change, and the few estimates that did change from the original analyses (i.e., the analyses using listwise deletion) did not differ by more than ±0.02 and did not affect the significance level. Therefore, given the robustness of these findings, we present the results only from the analyses that used listwise deletion.
RESULTS
Patterns and Trends in Drug Use According to Hispanic Ethnicity
Table 1 ▶ presents the characteristics of study participants. Adolescents of Mexican American ethnicity accounted for 67% of Hispanic students, whereas students of Puerto Rican, Cuban American, and other Latin American ethnicities accounted for 14%, 4%, and 15%, respectively. A greater percentage of Cuban American and other Latin American students than of Mexican American and Puerto Rican students reported speaking Spanish as their first language. The percentage of students surveyed who lived in households with adults other than their parents was highest among Puerto Ricans and lowest among those of other Latin American ethnicities. Table 2 ▶ shows the annual prevalence of marijuana and cocaine use and the 2-week prevalence of heavy drinking, all of which varied by Hispanic group and by gender. Generally, the lowest prevalence of drug use was observed among adolescents of other Latin American ethnicities. Boys were more likely than girls to use marijuana, but there were no significant gender differences for cocaine use and heavy drinking. As shown in Figure 1 ▶, we also observed that the prevalence of drug use among adolescents of other Latin American ethnicities was similar to that among the US population of eighth-grade students. Prevalence of drug use varied according to specific drug and ethnicity (Table 2 ▶).
TABLE 2—
Prevalence of Substance Use Among Mexican American, Puerto Rican, Cuban American, and Other Latin American Eighth-Grade Students, by Gender: Monitoring the Future 1991–2002
| Mexican American Students, % (95% CI) | Puerto Rican Students, % (95% CI) | Cuban American Students, % (95% CI) | Other Latin American Students, % (95% CI) | |
| Marijuana use (past 12 months) | ||||
| Male | 22.7b (20.4, 24.9) | 20.8b (18.2, 23.3) | 15.5 (10.2, 20.8) | 14.8b (12.9, 16.7) |
| Female | 19.5 (17.3, 21.6) | 16.5 (14.5, 18.5) | 18.7 (13.8, 23.5) | 10.9 (9.2, 12.6) |
| Total | 20.9 (19.0, 23.0) | 18.8 (17.0, 20.6) | 16.7 (12.5, 20.8) | 12.8a (11.5, 14.2) |
| Cocaine use (past 12 months) | ||||
| Male | 4.9 (4.0, 5.8) | 2.9 (1.8, 3.9) | 5.4 (2.9, 7.9) | 2.7 (1.9, 3.6) |
| Female | 5.3 (4.5, 6.1) | 2.7 (1.7, 3.8) | 5.6 (3.0, 8.1) | 2.2 (1.4, 2.9) |
| Total | 5.1 (4.3, 5.9) | 3.0a (2.1, 3.8) | 5.9 (3.6, 8.2) | 2.4a (1.8, 3.0) |
| Heavy drinking (past 2 weeks) | ||||
| Male | 21.9 (20.4, 23.3) | 18.0 (15.7, 20.2) | 17.7 (13.3, 22.0) | 14.2 (12.2, 16.2) |
| Female | 22.4 (20.8, 24.0) | 15.2 (12.8, 17.6) | 20.5 (15.8, 25.3) | 14.5 (12.8, 16.3) |
| Total | 22.2a (21.0, 23.4) | 16.7 (15.0, 18.5) | 18.7 (15.2, 22.1) | 14.4 (12.9, 15.8) |
Note. All analyses used weighted data and took into account the design effects resulting from the complex sampling design. CI = confidence interval.
aDenotes significant differences between Hispanic groups in the total percentage of youth who used each substance.
bDenotes significant differences within each Hispanic group in the percentage of males and females who used each substance.
FIGURE 1—
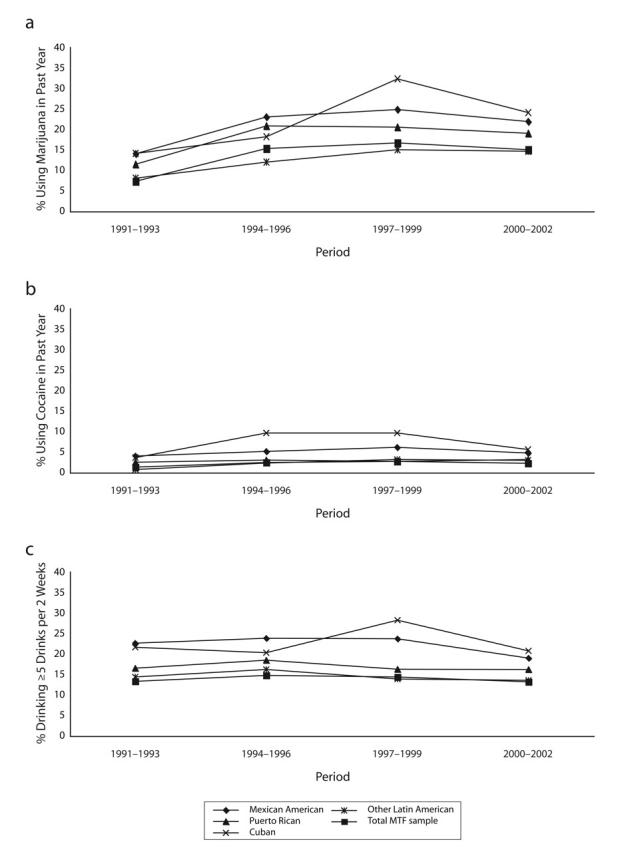
Drug use among Hispanic eighth-grade students: (a) Past-year marijuana use, (b) past-year cocaine use, (c) heavy drinking in past 2 weeks. Note. MTF = Monitoring the Future study.
Figure 1 ▶ illustrates that trends in drug use during 1991–2002 varied with ethnicity and by specific drug. The data showed an increase in the annual prevalence of marijuana and cocaine use in the 1990s, followed by a decrease in the 2000–2002 period. Conversely, the prevalence of heavy drinking was highest in the 1994–1996 period, followed by a small decline during the 1997–1999 period for all groups except Cuban Americans, and a subsequent decline during the 2000–2002 period for Cuban and Mexican Americans. These patterns were generally consistent with trends in drug use observed for the entire US population of eighth-grade students (Figure 1 ▶). Trend data for Cuban Americans, who showed the greatest deviation from national trends, must be viewed with caution; smaller sample sizes compared with the other groups may account for the wider fluctuations observed in the data.
Drug Use Prevalence and Sociodemographic Correlates
Table 3 ▶ provides the results of multivariate analyses. Because of the large volume of findings, we cannot summarize them all here; we instead focus on the most robust results.
TABLE 3—
Odds Ratios for Substance Use Among Mexican American, Puerto Rican, Cuban American, and Other Latin American Eighth-Grade Students: Monitoring the Future 1991–2002
| Marijuana Use (Past 12 Months) | Cocaine Use (Past 12 Months) | Heavy Drinking (Past 2 Weeks) | ||||||||||
| Mexican American Students (n = 12 816) | Puerto Rican Students (n = 2657) | Cuban American Students (n = 798) | Other Latin American Students (n = 2807) | Mexican American Students (n = 12 963) | Puerto Rican Students (n = 2703) | Cuban American Students (n = 812) | Other Latin American Students (n = 2837) | Mexican American Students (n = 11 955) | Puerto Rican Students (n = 2501) | Cuban American Students (n = 779) | Other Latin American Students (n = 2672) | |
| Gender | ||||||||||||
| Female (reference) | 1.00 | 1.00 | 1.00 | 1.00 | 1.00 | 1.00 | 1.00 | 1.00 | 1.00 | 1.00 | 1.00 | 1.00 |
| Male | 1.25** | 1.33* | 0.80 | 1.32* | 0.94 | 0.98 | 0.69 | 1.11 | 0.98 | 1.26 | 0.70 | 0.97 |
| First language spoken as a child | ||||||||||||
| English (reference) | 1.00 | 1.00 | 1.00 | 1.00 | 1.00 | 1.00 | 1.00 | 1.00 | 1.00 | 1.00 | 1.00 | 1.00 |
| Spanish | 0.54** | 1.14 | 0.81 | 0.75* | 0.90 | 1.48 | 1.20 | 1.06 | 0.87* | 1.04 | 1.39 | 0.94 |
| Parent’s education score,a % | ||||||||||||
| 1.0–2.0 (reference) | 1.00 | 1.00 | 1.00 | 1.00 | 1.00 | 1.00 | 1.00 | 1.00 | 1.00 | 1.00 | 1.00 | 1.00 |
| 2.5–3.0 | 1.05 | 0.94 | 0.47 | 1.32 | 1.11 | 0.92 | 0.13** | 1.08 | 1.19** | 1.06 | 0.68 | 1.01 |
| 3.5–4.0 | 0.95 | 0.63** | 0.53 | 1.42 | 0.95 | 0.75 | 0.69 | 1.30 | 1.00 | 0.83 | 1.54 | 1.14 |
| 4.5–5.0 | 0.89 | 0.54** | 0.36* | 1.22 | 1.07 | 1.13 | 0.55 | 0.95 | 0.87 | 0.73 | 1.44 | 1.01 |
| 5.5–6.0 | 0.89 | 0.64* | 0.36* | 0.83 | 1.29 | 0.75 | 0.72 | 1.00 | 0.94 | 0.72 | 0.95 | 0.83 |
| No. of parents in household | ||||||||||||
| 0 (reference) | 1.00 | 1.00 | 1.00 | 1.00 | 1.00 | 1.00 | 1.00 | 1.00 | 1.00 | 1.00 | 1.00 | 1.00 |
| 1 | 0.69** | 0.76 | 0.47 | 1.40 | 0.71 | 0.46 | 0.33 | 1.10 | 0.83 | 0.58* | 0.23** | 0.98 |
| 2 | 0.43** | 0.50** | 0.39** | 0.92 | 0.53** | 0.34* | 0.28* | 0.67 | 0.60** | 0.57** | 0.25** | 0.71 |
| Urbanicity | ||||||||||||
| Large MSA (reference) | 1.00 | 1.00 | 1.00 | 1.00 | 1.00 | 1.00 | 1.00 | 1.00 | 1.00 | 1.00 | 1.00 | 1.00 |
| Small to medium MSA | 1.29* | 1.21 | 0.92 | 1.36* | 1.39* | 1.11 | 2.47** | 0.99 | 1.09 | 1.22 | 1.23 | 1.29 |
| Non-MSA | 0.94 | 1.80 | 1.48 | 0.91 | 0.63 | 4.01* | 0.89 | 1.54 | 1.00 | 2.20* | 1.63 | 1.40 |
| Region | ||||||||||||
| Northeast (reference) | 1.00 | 1.00 | 1.00 | 1.00 | 1.00 | 1.00 | 1.00 | 1.00 | 1.00 | 1.00 | 1.00 | 1.00 |
| North Central | 1.72 | 1.50* | 0.89 | 1.50 | 1.24 | 2.05 | 2.39 | 0.49 | 1.00 | 1.17 | 0.88 | 0.76 |
| South | 1.66 | 1.22 | 0.58 | 1.40 | 1.76 | 1.43 | 0.81 | 2.32 | 0.99 | 0.96 | 0.95 | 0.80 |
| West | 1.53 | 1.56 | 1.08 | 1.82** | 1.11 | 2.04 | 2.39 | 2.78* | 0.86 | 1.65 | 1.22 | 1.09 |
Note. All analyses used weighted data and took into account the design effects resulting from the complex sampling design. Confidence intervals for each of the estimates are not included in the table but can be obtained from the authors.
aParental education (as a proxy for socioeconomic status) was defined as an average of father’s and mother’s educational attainment (with 1 missing data case permitted). The measure was coded as follows: 1 = completed grade school or less, 2 = completed some high school, 3 = completed high school, 4 = completed some college, 5 = completed college, 6 = completed graduate or professional school after college.
* P < .05; **P < .01.
Marijuana use.
As shown in Table 3 ▶, the results of the multivariate analyses indicate that the odds ratios of marijuana use were approximately 25% to 33% higher for boys than for girls of Mexican American, Puerto Rican, and other Latin American ethnicity; were approximately 46% and 25% lower, respectively, for adolescents of Mexican American and other Latin American ethnicity whose first language was Spanish than for those whose first language was English; were between 46% and 36% lower for Puerto Rican adolescents of middle to high SES than for those of lower SES; and were 64% lower for Cuban American adolescents of middle to high SES than for those of lower SES. We also found that the odds ratios of marijuana use were between 50% and 61% lower for Mexican American, Puerto Rican, and Cuban American students who lived with 1 or 2 of their parents than for those who lived with neither of their parents (Table 3 ▶). Among Mexican American and other Latin American students, the likelihood of marijuana use was estimated to be significantly higher for those who lived in small or medium-sized MSAs compared with those who lived in large MSAs. Puerto Rican students living in the North Central region of the United States were more likely to have used marijuana compared with Puerto Rican adolescents living in the Northeast. Among adolescents of other Latin American ethnicities, those living in the West were more likely to have used marijuana than were those living in the Northeast.
Cocaine use.
The results of the multivariate analyses showed that for all adolescents except those of other Latin American ethnicity, the estimated odds ratios predicting cocaine use were between 47% and 72% lower among students living in households with both parents than among students living in households with no parents (Table 3 ▶). No significant language and gender differences in the likelihood of cocaine use were observed for the 4 Hispanic groups. The likelihood of cocaine use was higher for Mexican American and Cuban American students who resided in small or medium-sized MSAs and for Puerto Rican students who resided outside MSAs compared with students of the same ethnicity who resided in large MSAs. Students of other Latin American ethnicities who lived in the West were more likely to have used cocaine than were those who lived in the Northeast.
Heavy drinking.
Results of the multivariate analyses indicated that the likelihood of heavy drinking was greatest among Mexican American, Puerto Rican, and Cuban American students who lived in households with no parents present and lower among Mexican American students whose first language spoken was Spanish (Table 3 ▶). In addition, among Puerto Rican students, the likelihood of heavy drinking was lowest among those living in major cities. The same trends appeared to hold among Cuban and other Latin American students, although the differences did not reach statistical significance. No significant regional differences were observed.
DISCUSSION
In the United States, Hispanic adolescents are substantially overrepresented among eighth-grade students who use drugs.2 This finding is alarming, given prior findings documenting that youths who use drugs are at significantly greater risk of experiencing a host of social, economic, and health problems.18–24 To better understand the epidemiology of drug use among Hispanic adolescents, we conducted separate analyses of drug use trends and sociodemographic correlates for adolescents belonging to Mexican American, Puerto Rican, Cuban American, and other Latin American ethnicities for the years 1991–2002.
We identified a number of important similarities and differences in drug use patterns among the 4 Hispanic groups. These similarities and differences highlight the heterogeneity that exists within the various Hispanic populations and may serve to identify potential intervention targets. For example, the much higher prevalence of marijuana use estimated among Mexican American and Puerto Rican boys suggests that there is a need for more aggressive prevention efforts among these adolescents. It is important to note the lack of gender difference in the annual prevalence of marijuana use among adolescents of Cuban ethnicities (Table 2 ▶). No statistically significant gender differences in the prevalence of cocaine use and heavy drinking were found in any Hispanic ethnic groups. Another interesting finding is that patterns of marijuana and alcohol use among Cuban adolescents differ from those among other Hispanic groups. As we indicated earlier, it is plausible that the observed fluctuations are caused by the smaller sample size of Cubans. However, an alternative explanation is that use of these drugs by Cuban adolescents has actually changed. Future research is needed to determine whether these changes have indeed occurred and what the prevention implications might be for this population.
Research has suggested that the associations among peer, parental, and familial influences, exposure opportunity, and drug use vary by gender.14,15,25–27 Therefore, our findings point to important differences and similarities in drug use opportunities among Hispanic boys and girls. These differences require further investigation. Our findings suggest the existence of substance-specific mechanisms that determine access to drugs and decisions to use or abstain from drug use given the opportunity. Gender differences, or lack thereof in some cases, in drug-using opportunities among Hispanic youths deserve further investigation. Two decades ago, the likelihood of drug involvement among Hispanic girls was considerably lower than that among Hispanic boys and among non-Hispanic girls.2,28 Such trends are no longer present. Relative to 2 decades ago, during the 1990s the United States saw a significant increase in the prevalence of drug use among Hispanic youths in general and among Hispanic girls in particular; for many substances, the prevalence of drug use among Hispanic boys and girls is now higher than that among non-Hispanic boys and girls.2,29 What accounts for this large increase in drug use among Hispanic youths is not yet understood. Prevention programs developed and implemented during the 1980s and 1990s either have failed to reach Hispanic youths or have been ineffective in preventing the onset of drug use or in helping youths discontinue drug use if they are already using drugs.
Perhaps the scope and effectiveness of prevention programs can be increased if greater attention is paid to the specific characteristics associated with drug use for each of the Hispanic groups. For example, in this study we observed an association between language first spoken and marijuana and alcohol use among some, but not all, Hispanic groups. Specifically, the likelihood of marijuana or heavy alcohol use was significantly lower among Mexican American adolescents whose first language spoken was Spanish compared with those whose first language spoken was English. Among adolescents of other Latin American ethnicities, the likelihood of marijuana use also was lower among those whose first language spoken was Spanish; however, language first spoken and heavy alcohol use were not associated in this group. By contrast, no association was observed between language first spoken and drug use among Puerto Rican and Cuban American adolescents. If first language spoken is taken as a proxy for acculturation, these findings suggest that associations between acculturation and drug use found by previous research28–33 might differ by Hispanic group and by type of drug. Without a measure of acculturation, it was not possible to know with precision how and what acculturative differences exist between adolescents and their families that might shed further light on the relationship of acculturation and drug use. Nevertheless, our findings suggest that for Mexican American and Latin American youths of other ethnicities, programs aimed at preventing and reducing marijuana use may be more effective if they pay greater attention to acculturation experiences, whereas programs that target cocaine use and heavy drinking may not need to place the same emphasis on acculturation.
Finally, one finding is consistent across all Hispanic groups and drugs studied and therefore has important implications for prevention. The likelihood of drug use was estimated to be significantly higher among adolescents who do not live with their parents than among adolescents who live with both parents. This finding identifies a highly vulnerable and fairly large population in need of prevention services: youths who live with relatives or who are in foster care. The positive or protective influences of parental communication, supervision, and support have been well documented34; however, less is known about drug use patterns and drug prevention among youths who are not living with their parents. Prior research has shown that at-risk youths who develop meaningful relationships with other caring adults (e.g., grandparents, neighbors, teachers) are less likely to initiate drug use than are at-risk youths without such support.35 Although little is known about the ways in which Hispanic youths may overcome the challenges of living away from their parents, these studies indicate that Hispanic youths who develop such supportive networks might be at lower risk of initiating drug use. Further research is needed to identify the factors and mechanisms that increase the risk of drug use among Hispanic youths who do not live with their parents.
Our findings support the surgeon general’s36 and the National Institutes of Health’s37 calls for more attention to be paid to the heterogeneity of populations to better understand the distribution and burden of disease and to target and tailor interventions appropriately. We hope that the information presented in this study contributes to the substance abuse field’s understanding of the epidemiology of drug use and suggests future areas of investigation among the largest Hispanic ethnic groups in the United States.
Acknowledgments
Data collection for this research was supported by the National Institute on Drug Abuse, US Department of Health and Human Services (grant R01-DA 01411).
We thank Tanya Hart for editorial assistance and Timothy Perry for assistance with data analysis.
Human Participant Protection The institutional review board of the University of Michigan approved this study and the consent information provided to the participants.
Peer Reviewed
Contributors J. Delva conceptualized and conducted the analyses and led the writing of the article. J. M. Wallace Jr was a co-investigator for the study and collaborated on the conceptualization and writing. P. M. O’Malley was a co–principal investigator for the study and collaborated on the conceptualization, analyses, and writing. J. G. Bachman was a co–principal investigator for the study and contributed to the conceptualization and writing of the article. L. D. Johnston was the principal investigator for the study and contributed to the writing of the article J. E. Schulenberg was a co–principal investigator for the study and collaborated in writing the article.
References
- 1.Johnston LD, O’Malley PM, Bachman JG. Demographic Subgroup Trends for Various Licit and Illicit Drugs, 1975–2001. Ann Arbor, Mich: Institute for Social Research; 2002. Monitoring the Future Occasional Paper 57. Available at: http://monitoringthefuture.org/pubs/occpapers/occ57.pdf. Accessed December 31, 2004.
- 2.Johnston LD, O’Malley PM, Bachman JG. Monitoring the Future National Survey Results on Drug Use, 1975–2002. Bethesda, Md: National Institute on Drug Abuse; 2003. NIH publication 03-5375.
- 3.Enrollment status of the population 3 years old and over, by age, sex, race, Hispanic origin, nativity, and selected educational characteristics: October 2000. US Census Bureau. Available at: http://www.census.Washington,DC:gov/population/socdemo/school/ppl-148/tab01.txt. Accessed June 26, 2003.
- 4.Poverty: 1999 (census brief). Washington, DC: US Census Bureau. Available at: http://www.census.gov/prod/2003pubs/c2kbr-19.pdf. Accessed June 26, 2003.
- 5.Fertility of American Women: June 2000. Population Characteristics. Washington, DC: US Census Bureau; 2001. Publication P20-543RV. Available at: http://www.census.gov. Accessed June 26, 2003.
- 6.Projections of the total resident population by 5-year age groups, race, and Hispanic origin with special age categories: middle series, 2001 to 2005. Washington, DC: US Census Bureau. Available at: www.census.gov/population/projections/nation/summary/np-t4-b.pdf. Accessed February 28, 2003.
- 7.USA Statistics in Brief. Washington, DC: US Census Bureau. Available at: http://www.census.gov/statab/www/poprace.html. Accessed January 4, 2005.
- 8.Projected total fertility rates by race and Hispanic origin, 1999 to 2100. Washington, DC: US Census Bureau. Available at: www.census.gov/population/projections/nation/summary/np-t7-a.pdf. Accessed February 28, 2003.
- 9.Arellano CM, Chavez EL, Deffenbacher JL. Alcohol use and academic status among Mexican American and non-White Hispanic adolescents. Adolescence. 1998;33:751–760. [PubMed] [Google Scholar]
- 10.Brook JS, Whiteman M, Balka EB, Win PT, Gursen MD. Drug use among Puerto Ricans: ethnic identity as a protective factor. Hispanic J Behav Sci. 1998;20:241–254. [Google Scholar]
- 11.Epstein JA, Botvin GJ, Diaz T. Alcohol use among Dominican and Puerto Rican adolescents residing in New York City: role of Hispanic group and gender. J Dev Behav Pediatr. 2001;22:113–118. [DOI] [PubMed] [Google Scholar]
- 12.Vega WA, Zimmerman RS, Warheit GJ, Apospori E, Gil AG. Risk factors for early adolescent drug use in four ethnic and racial groups. Am J Public Health. 1993;83:185–189. [DOI] [PMC free article] [PubMed] [Google Scholar]
- 13.Botvin GJ, Schinke S, Orlandi MA (eds). Drug Abuse Prevention With Multiethnic Youth. Thousand Oaks, Calif: Sage; 1995.
- 14.Guo J, Hill KG, Hawkins D, Catalano RF, Abbott RD. A developmental analysis of sociodemographic, family, and peer effects on adolescent illicit drug initiation. J Am Acad Child Adolesc Psychiatry. 2002;41:838–845. [DOI] [PubMed] [Google Scholar]
- 15.Bachman JG, Wadsworth KN, O’Malley PM, Johnston LD, Schulenberg J. Smoking, Drinking and Drug Use in Young Adulthood: The Impacts of New Freedoms and New Responsibilities. Mahwah, NJ: Lawrence Erlbaum Associates; 1997.
- 16.Bachman JG, Johnston LD, O’Malley PM. The Monitoring the Future Project After 27 Years: Design and Procedures. Ann Arbor, Mich: Institute for Social Research; 2001. Monitoring the Future Occasional Paper 54.
- 17.Kish I. Survey Sampling. New York, NY: John Wiley & Sons, Inc.; 1965.
- 18.Arria AM, Dohey MA, Mezzich AC, Bukstein OG, VanThiel DH. Self-reported health problems and physical symptomatology in adolescent alcohol abusers. J Adolesc Health. 1995;16:226–231. [DOI] [PubMed] [Google Scholar]
- 19.DuRant RH, Krowchuk DP, Kreiter S, Sinal SH, Woods CR. Weapon carrying on school property among middle school students. Arch Pediatr Adolesc Med. 1999; 153:21–26. [DOI] [PubMed] [Google Scholar]
- 20.Mensch BS, Kandel DB. Dropping out of high school and drug involvement. Soc Educ. 1988;61: 95–113. [Google Scholar]
- 21.Newcomb MD, Bentler PM. Consequences of Adolescent Drug Use: Impact on the Lives of Young Adults. Newbury Park, Calif: Sage; 1988.
- 22.Newcomb MD, Schieier LM, Bentler PM. Effects of adolescent drug use on adult mental health: a prospective study of a community sample. Exp Clin Psychopharmacol. 1993;1:215–241. [Google Scholar]
- 23.Office of Technology Assessment. Adolescent health. Background and the effectiveness of selected prevention and treatment services. Washington, DC: US Government Printing Office; 1991:499–578. Publication OTA-H-466.
- 24.Shedler J, Block J. Adolescent drug use and psychological health: a longitudinal inquiry. Am Psychol. 1990;45:612–630. [DOI] [PubMed] [Google Scholar]
- 25.Wagner FA, Anthony JC. Into the world of illegal drug use: exposure opportunity and other mechanisms linking the use of alcohol, tobacco, marijuana, and cocaine. Am J Epidemiol. 2002;155:918–925. [DOI] [PubMed] [Google Scholar]
- 26.Delva J, VanEtten ML, González G, et al. First opportunities to try drugs and the transition to first drug use: evidence from a national school survey in Panama. Subst Use Misuse. 1999;34:1451–1467. [DOI] [PubMed] [Google Scholar]
- 27.Chilcoat HD, Anthony JC. Impact of parent monitoring on initiation of drug use through late childhood. J Am Acad Child Adolesc Psychiatry. 1996;35:91–100. [DOI] [PubMed] [Google Scholar]
- 28.Wallace JM, Bachman JG, O’Malley PM, Schulenberg JE, Cooper SM, Johnston LD. Gender and ethnic differences in smoking, drinking, and illicit drug use among American 8th, 10th and 12th grade students, 1976–2000. Addiction. 2003;98:225–234. [DOI] [PubMed] [Google Scholar]
- 29.National Institute on Drug Abuse. Drug Use Among Racial and Ethnic Minorities. Bethesda, Md: National Institute on Drug Abuse; 2003. NIH publication 03-3888.
- 30.Ortega AN, Rosenbeck R, Alegría M, Desai RA. Acculturation and lifetime risk of psychiatric and substance use disorders among Hispanics. J Nerv Ment Dis. 2000;188:728–735. [DOI] [PubMed] [Google Scholar]
- 31.LaFromboise T, Coleman HL, Gerton J. Psychological impact of biculturalism: evidence and theory. Psychol Bull. 1993;114:395–412. [DOI] [PubMed] [Google Scholar]
- 32.Vega WA, Kolody B, Aguilar-Gaxiola S, Alderate E, Catalano R, Carveo-Anduaga J. Lifetime prevalence of DSM-III-R psychiatric disorders among urban and rural Mexican Americans in California. Arch Gen Psychiatry. 1998;55:771–778. [DOI] [PubMed] [Google Scholar]
- 33.Szalay LB, Canino G, Vilov SK. Vulnerabilities and cultural change: drug use among Puerto Rican adolescents in the United States. Int J Addict. 1993;28: 327–354. [DOI] [PubMed] [Google Scholar]
- 34.Hawkins JD, Catalano RF, Miller JY. Risk and protective factors for alcohol and other drug problems in adolescence and early adulthood: implications for substance abuse prevention. Psychol Bull. 1992;112: 4–105. [DOI] [PubMed] [Google Scholar]
- 35.Werner EE, Smith RS. Overcoming the Odds: High Risk Children From Birth to Adulthood. Ithaca, NY: Cornell University Press; 1999.
- 36.Mental Health, Culture, Race, and Ethnicity. Washington, DC: US Dept of Health and Human Services; 2001.
- 37.Preventing Drug Use Among Children and Adolescents: A Research-Based Guide for Parents, Educators, and Community Leaders. 2nd ed. Washington, DC: US Dept of Health and Human Services; 2003.