Abstract
Income inequality has been associated with both homicides and births to adolescents in the United States and with homicides internationally. We found that adolescent birth rates and general homicide rates were closely correlated with each other internationally (r= 0.95) and within the United States (r = 0.74) and with inequality internationally and within the United States. These results, coupled with no association with absolute income, suggested that violence and births to adolescents may reflect gender-differentiated responses to low social status and could be reduced by reducing income inequality.
Violence and births to adolescents seem to stand out as gender-differentiated markers of the corrosive effects of poverty among young people.1–3 Although adolescent births and levels of violence are strongly associated with poverty within developed countries, national rates of both violence and adolescent births are nevertheless higher in several wealthy countries compared with poor countries. In other words, homicides and adolescent pregnancies appear to be associated with relative rather than absolute poverty. Indeed, the degree of income distribution within a society has been linked to homicide rates within and outside the United States (see, for example, Hsieh and Pugh,4 Wilkinson et al.,5 Daly et al.,6 and Fajnzylber et al.7), but only within the United States for adolescent births.8,9 We decided to investigate how much these 2 social problems were related to each other and, if they have common roots, whether these roots might lie in relative or in absolute deprivation.
METHODS
International Comparisons
Countries were included if they were among the 50 countries with the highest gross national income per capita by purchasing power parity in 2002, had populations of more than 3 million, and had data on income inequality. The eligible countries were Australia, Austria, Belgium, Canada, Denmark, Finland, France, Germany, Greece, Ireland, Israel, Italy, Japan, The Netherlands, New Zealand, Norway, Portugal, Singapore, Slovenia, Spain, Sweden, Switzerland, the United Kingdom, and the United States.
Data on income inequality came from the United Nations Development Program Human Development Indicators; dates for each country vary slightly from country to country but are within the period 1992–1998.10 Income inequality was measured as the ratio of the total annual income received by the richest 20% of the population to the total average annual income received by the poorest 20% of the population. Gross national income per capita by purchasing power parity was measured in US dollars and obtained from the World Bank World Development Indicators database.11 Data on births per 1000 women aged 15 to 19 years for 1998 came from UNICEF.12 Adolescent birth rates were unavailable for Israel, Singapore, and Slovenia, and these countries were excluded from our study. Data on homicides came from the United Nations’ Survey on Crime Trends and the Operations of Criminal Justice Systems.13 Homicide data were period averages of available rates per 100000 persons for 1990–2000.
US Comparisons
Data on income inequality for the 50 United States and the District of Columbia were obtained from the US Census Bureau.14 Income inequality was measured as the Gini coefficient based on family income for 1999. Per capita income in 1999 was obtained from the US Census Bureau Census 2000 Summary File 3.15 Data on births to adolescents in 2000 came from the US National Vital Statistics System.16 Data are presented as births per 1000 females aged 15 to 19 years. Homicide rates per 100 000 persons came from the Federal Bureau of Investigation’s annual report on crime statistics for the United States for 1999.17 Data were unavailable for Wyoming and the District of Columbia. From a national report on juvenile offenders and victims, we also extracted juvenile homicide arrest rates per 100 000 juveniles (aged 10–17 years) for 46 states in 1997.18
Statistical Methods
We first estimated simple correlations between homicide rates and adolescent birth rates both within the United States and internationally. We then measured the independent effects of income inequality and per capita (absolute) income on homicide rates and adolescent birth rates internationally and within the United States. Within the United States only, this analysis was repeated for juvenile homicide rates. We also examined the effect of income inequality on each outcome while controlling for the other outcome.
RESULTS
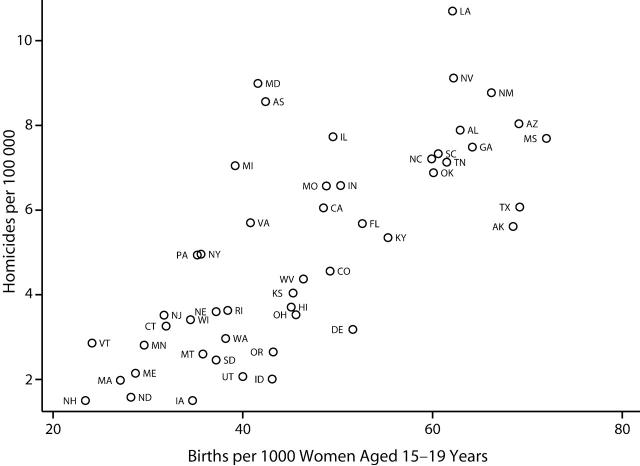
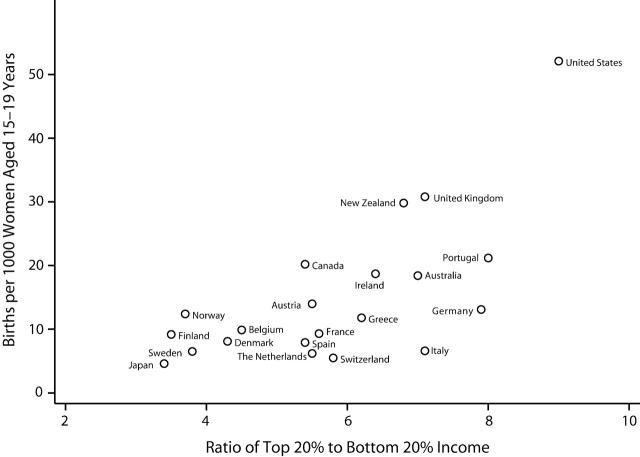
Figure 1 ▶ shows a plot of adolescent birth rates and homicide rates in the United States. The Pearson correlation coefficient between adolescent birth rates and homicide rates was 0.95 (P < .001) internationally and 0.74 (P < .001) across the United States. The independent effects of income inequality and per capita income on adolescent births and homicides are shown in Table 1 ▶. The partial correlation coefficients for income inequality and both outcomes in both settings were statistically significant (P < .01) and ranged from 0.51 to 0.73. Figure 2 ▶ shows a plot of income inequality and adolescent birth rates for 21 developed countries.
FIGURE 1—
Homicide rates and rates of adolescent births in 49 states (indicated by postal codes): United States, Federal Bureau of Investigation, 1999, and US National Vital Statistics System, 2000.
TABLE 1—
Independent Effects of Absolute Income and Income Inequality on Homicide Rates and Births to Adolescents Among Rich Countries and Within the United States
| Among Rich Countries | Within the United States | |||||||
| Adolescent Births | Homicides | Adolescent Births | Homicides | |||||
| r | P | r | P | r | P | R | P | |
| Income inequality | 0.73 | <.001 | 0.71 | <.01 | 0.72 | <.001 | 0.51 | <.001 |
| Per capita income | 0.75 | <.001 | 0.78 | <.001 | −0.55 | <.001 | −0.17 | .245 |
FIGURE 2—
Income inequality and rates of adolescent births among 21 of the richest developed countries: United Nations, 1990–2000, and UNICEF, 1998.
The effect of per capita income differed in the 2 comparisons. Internationally, higher per capita income was associated with higher rates of adolescent births and homicides (P < .001), whereas in the United States, higher per capita income was associated with lower adolescent birth rates (P < .001) and was not significantly related to homicide rates. The Pearson correlation coefficient for juvenile homicides and income inequality was 0.31 (P = .035), and for juvenile homicides and per capita income it was effectively zero (0.001; P = .994) (data not shown). The international associations between each outcome and income inequality were removed by controlling for the other. In the United States, an attenuated correlation remained between income inequality and adolescent births.
DISCUSSION
Our findings suggested that the links between deprivation and both violence and adolescent births reflect the destructive psychosocial and behavioral effects of inequality. As Luker19 put it, it is “the discouraged among the disadvantaged” who become adolescent mothers. Gilligan20 and others pointed out how often violence among young men is triggered by humiliation and disrespect. Successful programs for preventing adolescent pregnancy and violence have often focused on personal development, attempting to undo the psychosocial costs of low social status.1,21 But these patterns demand a common explanation. Our study suggests that levels of relative deprivation may be an underlying cause. Interestingly, the decline in US homicide and adolescent birth rates since the 1990s was accompanied by declining unemployment and improved relative income among the poorest individuals.17,22
Peer Reviewed
Contributors All authors contributed to the origination and design of the study and to the writing and revising of the brief. K. E. Pickett conducted the statistical analysis.
Human Participant Protection No protocol approval was needed for this ecological study.
References
- 1.Health Development Agency. Teenage Pregnancy and Parenthood: A Review of Reviews. London, England: Health Development Agency, National Health Service; 2003. Evidence Briefing.
- 2.The Alan Guttmacher Institute. Teen Sex and Pregnancy: Facts in Brief. New York, NY: The Alan Guttmacher Institute; 1999.
- 3.Wilson M, Daly M. Competitiveness, risk-taking and violence: the young male syndrome. Ethol Sociobiol.1985;6:59–73. [Google Scholar]
- 4.Hsieh C-C, Pugh MD. Poverty, income inequality, and violent crime: a meta-analysis of recent aggregate data studies. Crim Justice Rev.1993;18:182–202. [Google Scholar]
- 5.Wilkinson RG, Kawachi I, Kennedy BP. Mortality, the social environment, crime and violence. Sociol Health Illn.1998;20:578–597. [Google Scholar]
- 6.Daly M, Wilson M, Vasdev S. Income inequality and homicide rates in Canada and the United States. Can J Criminol.2001;43:219–236. [Google Scholar]
- 7.Fajnzylber P, Lederman D, Loayza N. Inequality and violent crime. J Law Econ.2002;45:1–40. [Google Scholar]
- 8.Gold R, Kawachi I, Kennedy BP, Lynch JW, Connell FA. Ecological analysis of teen birth rates: association with community income and income inequality. Matern Child Health J.2001;5:161–167. [DOI] [PubMed] [Google Scholar]
- 9.Gold R, Kennedy B, Connell F, Kawachi I. Teen births, income inequality, and social capital: developing an understanding of the causal pathway. Health Place.2002;8(2):77–83. [DOI] [PubMed] [Google Scholar]
- 10.United Nations Development Program. Human Development Report. New York, NY: Oxford University Press; 2003.
- 11.World Development Indicators [database online]. Washington, DC: World Bank; 2004. Available at: http://www.worldbank.org/data/wdi2004. Accessed December, 2004.
- 12.A League Table of Teenage Births in Rich Nations: Innocenti Report Card. Florence, Italy: UNICEF Innocenti Research Centre; 2001. Report No. 3.
- 13.United Nations Crime and Justice Information Network. Survey on Crime Trends and the Operations of Criminal Justice Systems (Fifth, Sixth, Seventh). New York, NY: United Nations; 2000.
- 14.Table S4: Gini ratios by state: 1969, 1979, 1989, 1999. Washington, DC: Income Statistics Branch/Housing and Household Economic Statistics Division, US Census Bureau; 2004. Available at: http://www.census.gov/hhes/income/histinc/state/state4.html. Accessed April 13, 2005.
- 15.Census 2000 Summary File 3. Washington, DC: US Census Bureau; 2003.
- 16.Ventura SJ, Mathews TJ, Hamilton BE. Teenage births in the United States: state trends, 1991–2000, an update. Natl Vital Stat Rep. May 30, 2002;50(9): 1–4. [PubMed] [Google Scholar]
- 17.Crime in the United States. Washington, DC: Federal Bureau of Investigation; 1990–2000.
- 18.Office of Juvenile Justice and Delinquency Prevention. Juvenile Offenders and Victims: 1999 National Report. Pittsburgh, Pa: National Center for Juvenile Justice; 1999.
- 19.Luker K. Dubious Conception: The Politics of Teen-age Pregnancy. Cambridge, Mass: Harvard University Press; 1996.
- 20.Gilligan J. Violence: Our Deadly Epidemic and Its Causes. New York, NY: GP Putnam; 1996.
- 21.Center for the Study and Prevention of Violence. Blueprints Model Program Descriptions, FS-BP02. Boulder: University of Colorado; 2004. Available at: http://www.colorado.edu/cspv/blueprints/model/overview.html. Accessed April 13, 2005.
- 22.The Alan Guttmacher Institute. The Guttmacher Report on Public Policy. New York, NY: The Alan Guttmacher Institute; 1998.


