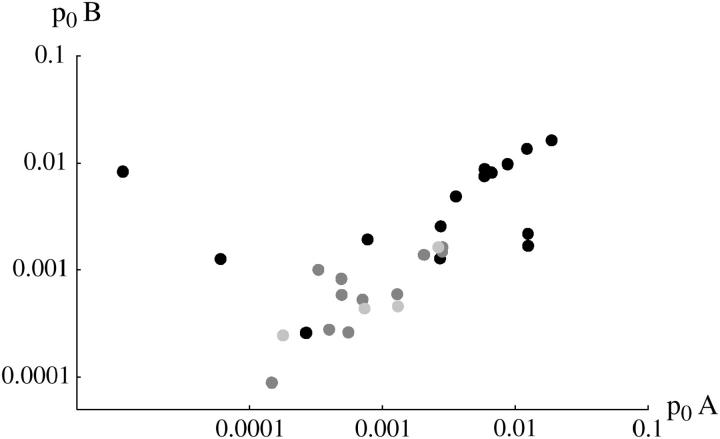
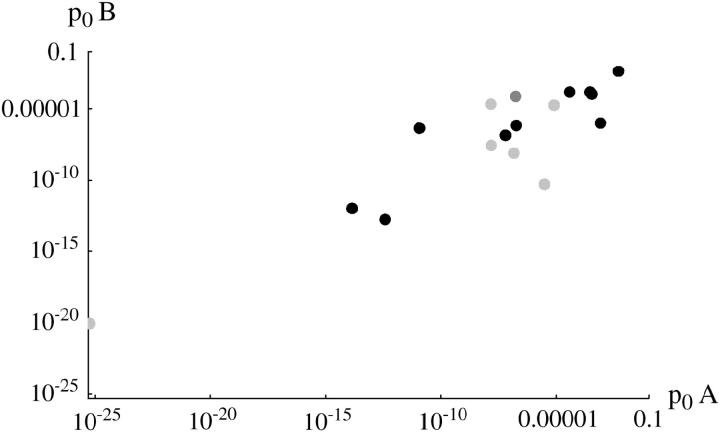
Figure 5.—
Estimated initial frequencies, p0, compared between replicates A and B. Top, “invader” lines, estimates made assuming constant fitnesses. Bottom, “transient” lines, estimates made assuming changing fitness. Solid circles, +/+ lethal; dark-shaded circles, +/+ lethal (Fowler et al. 1997); light-shaded circles, +/+ viable.


