

Abstract
Emerging species within the primary malaria vector Anopheles gambiae show different ecological preferences and significant prezygotic reproductive isolation. They are defined by fixed sequence differences in X-linked rDNA, but most previous studies have failed to detect large and significant differentiation between these taxa elsewhere in the genome, except at two other loci on the X chromosome near the rDNA locus. Hypothesizing that this pericentromeric region of the X chromosome may be accumulating differences faster than other regions of the genome, we explored the pattern and extent of differentiation between A. gambiae incipient species and a sibling species, A. arabiensis, from Burkina Faso, West Africa, at 17 microsatellite loci spanning the X chromosome. Interspecific differentiation was large and significant across the entire X chromosome. Among A. gambiae incipient species, we found some of the highest levels of differentiation recorded in a large region including eight independent loci near the centromere of the X chromosome. Outside of this region, no significant differentiation was detected. This pattern suggests that selection is playing a role in the emergence of A. gambiae incipient species. This process, associated with efficient exploitation of anthropogenic modifications to the environment, has public health implications as it fosters the spread of malaria transmission both spatially and temporally.
ALTHOUGH the concept of species continues to inspire debate, all models of the process of speciation involve a reduction in gene flow between lineages. In the classic case of allopatric speciation, gene flow is eliminated completely because of a geographic barrier. As long as this barrier remains, isolated populations are subject to differentiation across the entire genome (Mayr 1963). As a consequence, genetic changes underlying differential adaptation, reproductive isolation, and speciation are difficult to distinguish from accumulated neutral changes. By contrast, sympatric speciation may proceed despite incomplete barriers to gene flow (Wu 2001). Emerging ecological differentiation between incipient species may be associated with premating behavioral differences that limit gene flow without altogether preventing it. In the absence of selection against genetic introgression, the incipient species should fuse. However, early in the speciation process selection may act only on regions of the genome directly involved in divergent ecological adaptations and mating behaviors, barring the introgression of these regions without impeding exchange of the remainder of the genome. This model has led to the prediction that nascent species may have mosaic genomes composed of highly differentiated and undifferentiated regions (Wu 2001; Gentile et al. 2002; Machado et al. 2002). It also predicts that “speciation genes”— those genes directly responsible for reproductive or ecological incompatibilities—will be found in regions of the genome that are unusually diverged among incipient species. Identification of these genes and an appreciation of their function at molecular, cellular, and organismal levels will improve our understanding of the speciation process.
Within the Anopheles gambiae complex—a cluster of seven isomorphic and closely related mosquito species from Africa—the nominal species A. gambiae has evolved into the principal vector of human malaria by specializing on humans (Coluzzi et al. 2002). It rests indoors, bloodfeeds almost exclusively on humans, and breeds in anthropogenic sites. Moreover, A. gambiae is subject to an ongoing speciation process, which continues to have a major impact on the epidemiology of malaria (della Torre et al. 2002). Nascent species within A. gambiae continue to specialize as they shift into new habitats, particularly those habitats created by human activity such as irrigated agricultural sites. This ecological specialization allows temporal and spatial range expansion of an already highly anthropophilic vector, resulting in increased malaria transmission. Discovery of the relevant ecological cues used by these incipient species to partition their environment may lead to targeted vector control strategies aimed at disrupting specific associations.
Before the advent of DNA markers, reproductive and ecological discontinuities within A. gambiae from West Africa were recognized by sets of polymorphic inversions on chromosome 2, mainly its right arm (2R; Toure et al. 1998). Inversion frequencies, considered jointly, reflected large heterozygote deficits within samples from the same localities. The expected genotypic proportions eventually were recovered only when the existence of five chromosomally differentiated and reproductively isolated taxa referred to as “chromosomal forms” was postulated (Coluzzi et al. 1985). These included the Savanna chromosomal form found throughout tropical Africa and the Mopti chromosomal form found only in West Africa, where both forms are extensively sympatric. In the Sudan-Savanna ecoclimatic zone, the Savanna form breeds only in the rainy season, exploiting rain-dependent pools and puddles for oviposition, whereas the Mopti form can tolerate more arid conditions and is associated with irrigated sites such as rice fields that allow breeding into the dry season. In 1997, the first molecular discontinuities within A. gambiae were discovered in a region of the genome independent of chromosome 2 inversions: the pericentromeric (proximal) end of the acrocentric X chromosome in the ribosomal DNA (rDNA; Favia et al. 1997). On the basis of fixed differences in the rDNA and very infrequent hybrid rDNA genotypes in nature, two “molecular forms” of A. gambiae were defined and provisionally named M and S (della Torre et al. 2001). Although the correspondence does not hold across all of West Africa, in Burkina Faso where only the Savanna and Mopti chromosomal forms of A. gambiae are present, the molecular forms M and S correspond to the chromosomal forms Mopti and Savanna, respectively. Where M and S are sympatric and synchronously breeding, there is strong assortative mating, but premating barriers are incomplete. A survey from Mali found that ∼1% of females had mated with males of the other form (Tripet et al. 2001). Taken together, these data suggest that M and S are emerging species (della Torre et al. 2002).
Recent common ancestry and small amounts of ongoing gene flow are likely explanations for the failure of previous genome-wide surveys to find genetic differentiation between M and S at most loci (Lanzaro et al. 1998; Gentile et al. 2001; Mukabayire et al. 2001; Wang et al. 2001; Lehmann et al. 2003; but see Wondji et al. 2002). Aside from the rDNA locus, only three loci that are divergent between the two forms have been found. One is a sodium channel gene near the tip of chromosome 2L (Gentile et al. 2004 and references therein). The other two, H678 and E614, are microsatellite loci located on the X chromosome near the centromere. Significant divergence at locus H678 was found not only between allopatric populations of M from Ghana and S from Gabon, but also between sympatric M and S populations from Mali and the Democratic Republic of Congo (Wang et al. 2001; Lehmann et al. 2003). Locus E614 also revealed a high level of differentiation between M and S in Mali (Wang et al. 2001). Thus, three of four loci at which significant differentiation has been found are X-linked and physically located proximal to the centromere in divisions 5 and 6.
The apparent overrepresentation of X-linked loci associated with differentiation among incipient species of A. gambiae recalls the “large X effect” noted in hybrids of A. gambiae and its sibling species, A. arabiensis, and in other insects and birds, whereby morphological, physiological, and behavioral differences among species map to the X chromosome more often than expected by chance (Curtis 1982; Sperling 1994; Prowell 1998; Saetre et al. 2003; Counterman et al. 2004; Slotman et al. 2004). It has been suggested that X-linked differences—especially those controlling pre- and postzygotic isolation—tend to be associated with the species boundary (Sperling 1994). If so, the loci underlying these differences, along with other loci tightly linked to them, should be refractory to introgression and should show unusually high levels of differentiation between closely related or incipient species despite some gene exchange. If the observed differentiation at rDNA, H678, and E614 represents a large X effect in A. gambiae, these markers may be linked to one or more loci underlying species differences. We predicted that a multilocus scan of the X chromosome using microsatellite markers should reveal additional divergent loci near the proximal end of the X chromosome. Accordingly, the present study had two objectives. First, we sought to confirm and extend the preliminary observations by documenting levels of differentiation between molecular forms at multiple loci in divisions 5 and 6. Second, we wanted to measure the pattern and physical extent of differentiation along the length of the X from proximal to distal. To achieve these objectives, we compared microsatellite variation at 17 loci on the X chromosome in sympatric populations of A. gambiae M and S and a sibling species, A. arabiensis, from Burkina Faso.
MATERIALS AND METHODS
DNA samples:
Indoor-resting A. gambiae s.l. mosquitoes were collected by pyrethrum spray catches in September 2001 in Goundri village (12°30′ N, 12°0′ W), Burkina Faso, West Africa (for detailed description, see Costantini et al. 1996). In this village, the morphologically indistinguishable species A. gambiae (M and S) and A. arabiensis are sympatric and often are present within the same samples. All specimens were placed in tubes and preserved at room temperature over desiccant. With the eventual goal of directly sequencing sex-linked loci, DNA was isolated from individual male specimens using DNeasy tissue kits (QIAGEN, Valencia, CA) or the Wizard SV 96 genomic DNA purification system (Promega, Madison, WI) and resuspended in 50 μl of eluent buffer. Mosquitoes were identified for species and molecular form using a PCR-restriction fragment length polymorphism assay based on ribosomal DNA (Fanello et al. 2002).
Microsatellites:
Microsatellite markers used in this study (Table 1) were previously described (Zheng et al. 1993, 1996; Lehmann et al. 1996) or were developed by us using the Ensembl A. gambiae genome assembly. Candidates were chosen on the basis of physical location, number of repeats (at least 10 consecutive di- or trinucleotide repeats where possible), and unique flanking sequence. Primers to amplify across the microsatellite were designed using Primer3 (Rozen and Skaletsky 2000). The locus was considered unique if queries of the genome using local BLAST yielded no nonself hits. Queries consisted of 200 nucleotides of flanking sequence on each side; individual primers were also used as queries. Initially, unlabeled primers were tested with genomic DNA to verify robust PCR amplification of products in the expected size range. For primer pairs that performed reliably, the forward primer was labeled using Beckman-Coulter dyes (D2, D3, and D4; Invitrogen, Carlsbad, CA).
TABLE 1.
Differentiation betweenA. gambiae M, S, andA. arabiensis
|
A. gambiae M and A. gambiae S
|
A. gambiae M and A. arabiensis
|
A. gambie S and A. arabiensis
|
||||||||||||||
|---|---|---|---|---|---|---|---|---|---|---|---|---|---|---|---|---|
| Locus | Div | FST | RST | Dps | Ln RV | Ln RH | FST | RST | Dps | Ln RV | Ln RH | FST | RST | Dps | Ln RV | Ln RH |
| AGXH503 | 4B | −0.002NS | 0.022 | 0.468 | 0.707 | 0.957 | 0.142 | 0.015 | 0.815 | 0.373 | −4.987 | 0.159*** | −0.132 | 0.794 | 1.080 | −4.030 |
| AGXH36a | 4B | 0.007NS | 0.073 | 0.446 | 1.412 | 0.917 | — | — | — | — | — | — | — | — | — | — |
| AGXH99 | 2C | −0.018NS | −0.001 | 0.087 | 0.600 | 0.150 | 0.624*** | 0.030 | 1.000 | −5.029 | −5.236 | 0.633*** | −0.002 | 1.000 | −4.429 | −5.086 |
| AGXH7 | 1C | −0.018NS | −0.009 | 0.089 | −0.359 | 0.035 | 0.226*** | 0.374 | 0.639 | 0.186 | −0.994 | 0.206*** | 0.299 | 0.595 | −0.173 | −0.960 |
| AGX1D1 | 1C | −0.013NS | 0.020 | 0.100 | −1.776 | −0.263 | 0.685*** | 0.672 | 0.957 | −2.912 | −2.990 | 0.656*** | 0.331 | 0.957 | −4.688 | −3.253 |
| AGXND5A1 | 5A | 0.022NS | 0.001 | 0.286 | −0.814 | −1.175 | 0.051* | 0.088 | 0.357 | −1.959 | −1.812 | 0.153*** | 0.100 | 0.578 | −2.773 | −2.987 |
| AGXH766 | 5A | 0.000NS | −0.010 | 0.020 | −4.179b | −0.021 | 0.723*** | 0.832 | 1.000 | 3.324 | 3.854b | 0.701*** | 0.628 | 1.000 | −0.855 | 3.833b |
| AGXND5B1 | 5B | 0.015NS | −0.010 | 0.326 | 1.454 | 0.084 | 0.185*** | 0.059 | 0.601 | −2.974 | −2.587 | 0.176*** | 0.200 | 0.544 | −1.520 | −2.502 |
| AGXND5B2 | 5B | 0.034** | 0.157 | 0.458 | 0.538 | 2.131 | 0.025** | 0.133 | 0.538 | 0.579 | −0.309 | 0.126*** | 0.390 | 0.814 | 1.118 | 1.822 |
| AGXND5C1 | 5C | 0.045** | 0.001 | 0.331 | 0.175 | 0.739 | 0.514*** | 0.709 | 1.000 | −4.762 | −5.530 | 0.557*** | 0.767 | 1.000 | −4.587 | −4.792 |
| AGXND5C2 | 5C | 0.202*** | 0.108 | 0.630 | −0.904 | 1.933 | 0.248*** | 0.914 | 1.000 | 0.808 | −1.287 | 0.397*** | 0.899 | 1.000 | −0.096 | 0.646 |
| AGXH678 | 5D | 0.322*** | 0.589 | 0.980 | −2.657 | −3.303b | 0.128*** | 0.155 | 0.383 | −0.472 | 0.302 | 0.283*** | 0.659 | 0.970 | −3.129 | −3.001 |
| AGXND5D1 | 5D | −0.005NS | 0.030 | 0.178 | −0.805 | −0.488 | 0.415*** | 0.831 | 0.979 | −1.050 | −0.952 | 0.366*** | 0.651 | 0.913 | −1.855 | −1.440 |
| AGXND5D2 | 5D | 0.468*** | 0.481 | 0.780 | 0.661 | 0.174 | 0.378*** | 0.310 | 0.620 | 2.180 | 0.600 | 0.403*** | 0.540 | 0.780 | 2.841 | 0.774 |
| AGXND6U2 | 6 | 0.246*** | 0.480 | 0.733 | −1.431 | −1.651 | 0.661*** | 0.886 | 1.000 | −2.737 | −3.464 | 0.556*** | 0.852 | 1.000 | −4.167 | −5.115 |
| AGXND6U3 | 6 | 0.241*** | 0.380 | 0.936 | 2.040 | 1.983 | 0.129*** | 0.557 | 0.919 | −0.177 | −0.038 | 0.249*** | 0.855 | 1.000 | 1.863 | 1.945 |
| AGXND6U4 | 6 | 0.067*** | 0.845 | 1.000 | 0.517 | −0.030 | 0.104*** | 0.406 | 0.977 | −2.382 | −1.608 | 0.109*** | 0.956 | 1.000 | −1.865 | −1.637 |
Div, cytological location to polytene chromosome division and subdivision. NS, not significant.
P < 0.05;
P < 0.01;
P < 0.001.
This locus failed to amplify in A. arabiensis samples.
Significant when standardized with ln RV or ln RH distribution.
Genotyping:
PCR was performed in a GeneAmp 9600 thermal cycler (Applied Biosystems, Foster City, CA). Each 25-μl reaction contained 12.5 pmol of each primer, 0.2 mm of each dNTP, variable amounts of MgCl2 (Table 1), 1.25 units Taq polymerase, and 1 μl of a 1:7 dilution of template DNA extracted from a single mosquito. Cycling conditions were 94° denaturation for 5 min followed by 35 cycles of 94° for 20 sec, 53.5°–60° for 20 sec, and 72° for 30 sec, with a final 72° extension of 5 min. After diluting the resulting PCR products with H2O (1:4 or 1:8 for reactions containing D2/D3 or D4, respectively), up to five distinct microsatellite loci were pooled, according to the expected nonoverlapping size of the products. For each pool, 0.5-μl aliquots of each PCR reaction and 0.3 μl of a 400-bp size standard (Beckman-Coulter) were added to 25 μl of SLS buffer (Beckman-Coulter). PCR products were resolved by capillary electrophoresis on a CEQ8000 System (Beckman-Coulter) according to manufacturer recommendations. Allele sizes were determined using the CEQ8000 fragment analysis software.
Data analysis:
Descriptive statistics per population and locus, including allele counts, number of chromosomes, expected heterozygosity (gene diversity), variance in repeat number, and mean allele length were computed using Microsatellite Analyzer (MSA) v3.12 (Dieringer and Schlotterer 2003). MSA was also used to calculate genetic distances (Dps = 1 − proportion of shared alleles) and FST values per locus and population pair. RST values were calculated on the basis of variance in repeat number following Slatkin (1995), and the ln RV and ln RH test statistics were calculated on the basis of variance in repeat number and gene diversity, respectively, following Kauer et al. (2003). To allow the calculation of these statistics in those few cases where variance in repeat number and gene diversity was zero, one allele was replaced by one dummy allele differing in length by one repeat unit. Gametic linkage disequilibrium was tested for each pair of loci after adding the same dummy allele for all individuals and loci, using Genepop (http://wbiomed.curtin.edu.au/genepop; Raymond and Rousset 1995). We used the Bayesian model-based clustering method implemented in the program Structure 2.1 (Pritchard et al. 2000) for unsupervised inference of population structure. We assumed a model in which there were K clusters (where K = 1–5) characterized by a set of allele frequencies at each of 16 loci (AgXH36 was omitted because it did not amplify in A. arabiensis). Given K clusters, each run (repeated five times) consisted of a burn-in length of 150,000 and a run length of 250,000 Markov chain Monte Carlo iterations. Population structure was also inferred from unrooted neighbor-joining trees based on Dps. Neighbor-joining trees were produced using Neighbor and Drawtree as implemented in PHYLIP v3.6 (J. Felsenstein, http://evolution.gs.washington.edu/phylip.html).
RESULTS
Genotypes at 17 microsatellite loci spanning the X chromosome were determined from a total of 150 randomly selected A. gambiae M, S, and A. arabiensis collected at Goundri village, Burkina Faso (Figure 1; supplementary Table 1 at http://www.genetics.org/supplemental/). Most loci in divisions 5 and 6 on the cytogenetic map (Coluzzi et al. 2002) were designed specifically for this study using the A. gambiae genome sequence (Holt et al. 2002). For ease of reference, we adopted the naming convention AgXND (A. gambiae, X chromosome, Notre Dame) followed by the cytological location (e.g., 5C) and a unique number. Robust, specific amplification was obtained for 10 of 13 new loci. Because we used males that are hemizygous for the X chromosome, nonamplifying (presumed null) alleles at a locus were readily apparent (supplementary Table 2 at http://www.genetics.org/supplemental/). All 17 loci amplified for most M and S individuals. The overall frequency of null alleles was 5–6%, but this estimate includes locus AgXH36, at which rates were 24% and 31%, respectively. Omitting this locus, the frequency of null alleles in M and S samples dropped below 5%. In A. arabiensis, AgXH36 failed to amplify for all specimens, and four other loci (AgXND5C1, AgXND5C2, AgXH503, and AgXH678) had high rates of null alleles (35–63%), but the mean rate of null alleles for the remaining 12 loci was <4%.
Figure 1.—

Relative location of microsatellite markers on the cytogenetic map of the A. gambiae X chromosome.
Polymorphism:
Although generally abundant, polymorphism within each sample varied by locus from little or none to extremely high (supplementary Table 2 at http://www.genetics.org/supplemental/). In M and S samples, the average number of alleles per locus was approximately nine and, assuming Hardy-Weinberg equilibrium within each taxon, the average gene diversity was 0.72. The diversity estimates for A. arabiensis (∼5 and 0.49, respectively) were generally lower (one-way ANOVA; Na: F = 2.264, P = 0.115; He: F = 3.967, P = 0.026). Similar to other measures of variation, variance in repeat number also fluctuated widely across loci and among taxa. Locus AgXH503 was distinguished by extremely high variance in repeat number in all taxa (from 44 to 128; supplementary Table 2 at http://www.genetics.org/supplemental/). This finding was anticipated by Wang et al. (1999) because of long repeat arrays in the original sequenced clone, but not predicted from the modest interrupted repeat array in the A. gambiae (PEST) genome sequence (supplementary Table 1 at http://www.genetics.org/supplemental/). A. gambiae M was characterized by the highest overall variance, including (13.22) or excluding (8.53) locus AgXH503. Excluding this locus, repeat number variance in A. gambiae S was intermediate (5.66) and A. arabiensis showed the least variance (4.02), consistent with lower heterozygosity and allele number in this species relative to M and S.
Histograms of allelic frequencies revealed strikingly different patterns of polymorphism among loci. These ranged from broad and shallow distributions representing many low-frequency alleles at AgXH503, AgXND5B2, and AgXND6U4 to narrow and strongly peaked distributions representing one or few high-frequency alleles at loci such as AgXH766 (Figure 2). At those loci where A. gambiae M and S samples contained many low-frequency alleles (e.g., AgXH503, AgXH99, AgX1D1, AgXND5C1, and AgXND5C2), the A. arabiensis sample was either monomorphic or nearly so. The opposite pattern was found at AgXH766, where diversity was much lower in A. gambiae than in A. arabiensis. Both patterns are especially noteworthy, given that these sibling species likely share similar or identical repeat structure at corresponding loci. These patterns were observed at loci with few or no null alleles, suggesting that this trend is independent of null allele effects.
Figure 2.—
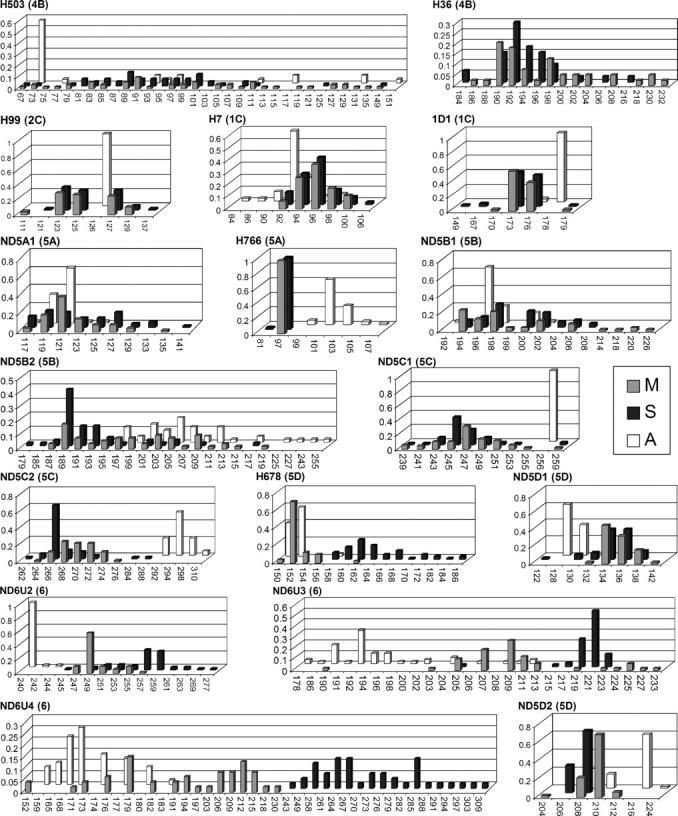
Allele size distribution and frequency observed at 17 microsatellite loci in A. gambiae M (M, shaded bars), A. gambiae S (S, solid bars), and A. arabiensis (A, open bars) sampled from Goundri. Allele size in base pairs is given on the x-axis; frequency is given on the y-axis. Locus names are abbreviated by omitting the prefix AgX; chromosomal location (numbered division and lettered subdivision) is provided in parentheses.
Linkage disequilibrium:
Pairwise tests of gametic linkage disequilibrium were conducted within M, S, and A. arabiensis samples. Of 120 possible tests within M, 12 resulted in P-values <0.05 (range, 0.002–0.047). When the significance level for each test was adjusted for multiple tests, none of the P-values were significant. Following the same procedure for S and A. arabiensis samples, none of the 12 nominally significant P-values resulting from 225 tests remained significant following Bonferroni adjustment, with one exception. In A. arabiensis, allele frequencies at relatively distant loci in subdivisions 1C and 5B (AgXH7 and AgX5B1) deviated significantly from equilibrium frequencies (P = 0.00053).
Differentiation:
Natural hybridization between A. arabiensis and A. gambiae is rare, but resulting F1 female progeny are fertile and can mediate genetic introgression between these species. The X chromosome of each species is fixed for independent sets of compound inversions that encompass much of its length. In the F1 hybrid female, the heterologous X chromosomes synapse only rarely, and only in the division 6 region containing the centromere (Davidson et al. 1967; White 1971). Laboratory crossing experiments have shown that in subsequent backcross generations the heterologous X is rapidly lost (della Torre et al. 1997). Thus, despite evidence for interspecific gene flow of mitochondrial and autosomal sequences (Besansky et al. 2003), trafficking of X chromosome sequences should be quite rare or nonexistent, particularly outside of division 6 heterochromatin.
Examination of allelic frequency histograms (Figure 2) suggests that A. arabiensis has indeed diverged from A. gambiae at these X-linked loci. Four main features emerge from an informal visual comparison. First, at five loci (AgXH99, AgXH766, AgXND5C1, AgXND5C2, and AgXND6U2) neither allele sharing nor allele size overlap between A. arabiensis and A. gambiae was found. Second, where allele distributions of A. arabiensis and A. gambiae overlap, there are differences in allele frequency and diversity. Third, where allele distributions overlap, the A. arabiensis and A. gambiae canonical allele series are occasionally offset by one nucleotide (e.g., AgXH99, AgX1D1, AgXND5C1, and AgXND6U4). With the exception of AgX1D1 in A. arabiensis, deviations from canonical allele series were rarely observed within taxa. For this reason, and because noncanonical alleles were verified by direct comparison with canonical alleles on the same electrophoretic run, it is unlikely that this result is a technical artifact. Finally, where allele distributions overlap, the overlap includes A. arabiensis and M alleles more often than A. arabiensis and S alleles (e.g., AgXH678, AgXND5D2, AgXND6U3, and AgXND6U4).
The informal observations based on allele frequency histograms were corroborated by quantitative analyses of differentiation among M, S, and A. arabiensis on the basis of distance measures (FST, RST, and Dps: Table 1). With few exceptions, these indicated moderate or high differentiation along the length of the X chromosome, including division 6.
By contrast, no significant differentiation between M and S was noted on the X chromosome for the eight loci distal to AgXND5B2 (Table 1). Beginning rather abruptly with AgXND5B2 (only ∼70 kb from AgXND5B1) and extending proximally, FST values were significantly different from zero at eight of nine loci. Distance measures generally increased in magnitude proceeding proximally from subdivision 5B through division 6. The average FST value for this region was 0.164, compared with −0.003 outside of it. The FST values within divisions 5B–6 are among the highest recorded between M and S molecular forms of A. gambiae. Inspection of the allele frequency histograms shows that allele sharing between M and S is greatly reduced in this region, especially at AgXH678 and AgXND6U3; at the most proximal locus in this survey, AgXND6U4, M, and S share no alleles despite very high allelic diversity (Figure 2).
Two different clustering procedures were performed on these data to explore the correspondence of population structure with taxonomic designations. First, a matrix of pairwise distances based on the proportion of shared alleles was used to construct an unrooted neighbor-joining tree (Figure 3). All A. arabiensis clustered together in a clade exclusive of, and well separated from, A. gambiae. The majority of M and S individuals also formed exclusive clusters, but smaller mixed clusters occupied intermediate positions between the main M and S clades.
Figure 3.—
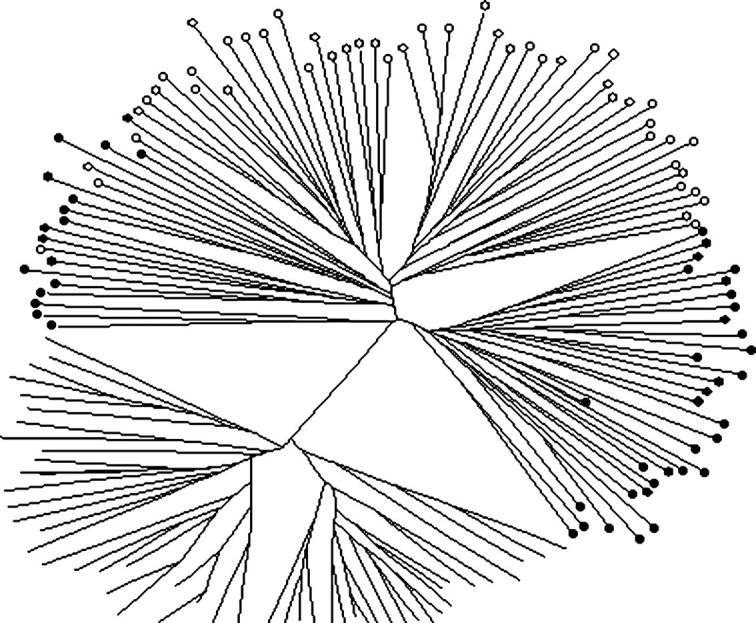
Neighbor-joining tree of A. gambiae M, S, and A. arabiensis individuals. Unlabeled tips represent A. arabiensis individuals; tips labeled with solid and open circles represent M and S individuals, respectively.
A second, model-based clustering approach employed multilocus genotype data in a Bayesian framework (Pritchard et al. 2000). Given the K population(s) characterized by a set of allele frequencies at each locus, individuals are assigned probabilistically to one or more populations, depending upon the inferred level of admixture. Exploring K = 1–5 over five replicates revealed that three populations were most likely (Figure 4). The membership of these three populations corresponded precisely with the taxonomically defined M, S, and A. arabiensis samples. For the cluster corresponding to A. arabiensis, only 0.7% and 0.5% of its alleles were inferred to have been derived from the M and S clusters, respectively. The clusters corresponding to M and S each contained 2–3% of alleles inferred to have been derived from the alternative molecular form. The admixture model employed for this analysis assumed Hardy-Weinberg equilibrium within populations, unlinked loci, and linkage equilibrium. Random mating within taxa collected from a single village is a reasonable (and here, an unavoidable) assumption, and our data are consistent with linkage equilibrium. However, as the loci reside on the same chromosome, we implemented an additional admixture model that allows for linkage between loci and incorporates information about the relative position of markers on the X chromosome (Falush et al. 2003). Three populations corresponding to A. arabiensis, M and S remained the most likely population structure, although the admixture proportions inferred for each cluster rose to ∼28% of alleles from each of the other two clusters (not shown).
Figure 4.—

Triangle plot summarizing the unsupervised population structure analysis of A. gambiae M, S, and A. arabiensis individuals assuming three populations. Each individual is represented by a point (black, S; light shading, M; dark shading, A. arabiensis). The position of each point relative to the three corners represents the estimated ancestry of that individual with respect to the three inferred populations; individuals in one corner are completely assigned to one population.
Selection:
Divergence among species, incipient species, or populations in response to demographic factors results from random processes that act on all loci within a taxon. Even limited amounts of gene flow between taxa can preclude divergence at loci that lack fitness effects. Divergence associated with habitat specialization or premating isolation is likely the result of selection acting at a locus or combinations of interacting loci. In the face of genetic exchange, divergence is not expected at loci whose selective advantage is universal, but only at those loci whose beneficial effects are limited to the particular environment or genetic background characteristic of one taxon (Barton and Gale 1993). In principle, a multilocus scan can identify genomic regions likely to contain these private beneficial mutations (Harr et al. 2002). A footprint is created when a newly arisen beneficial mutation increases in frequency within a population, carrying with it flanking neutral variants (“hitchhiking”) and resulting in a chromosomal region initially devoid of polymorphism (“selective sweep”). Before the footprint of selection decays as a function of recombination, mutation, and strength of selection, it should be manifest at nearby neutral marker loci that are relatively devoid of polymorphism within a taxon and relatively highly diverged between taxa.
The measures ln RV and ln RH were developed to assist the identification of recent selective sweeps in multilocus genome scans of pairs of taxa (“hitchhiking mapping”) (Schlotterer 2002; Kauer et al. 2003). Ln RV and ln RH are relative measures of variability between two taxa based on variance in repeat length or gene diversity, respectively. For each locus, the natural logarithm of the ratio of variation is calculated, resulting in a measure that is relatively insensitive to demographic events and different microsatellite mutation rates among loci (Schlotterer 2002). Outlier loci are identified as those differing significantly in variability from the remainder of the genome under the assumption (supported by simulation studies) that ln RV and ln RH values are normally distributed (Schlotterer 2002; Kauer et al. 2003). It has been noted that ln RH is the more powerful indicator because it has lower variance, but considering ln RV together with ln RH reduces false positives (Kauer et al. 2003). Table 1 lists the observed ln RV and ln RH values at each locus for all pairwise comparisons of M, S, and A. arabiensis. In both comparisons involving A. arabiensis, the variance or gene diversity of A. arabiensis was in the numerator of the ln RV and ln RH values, respectively. Thus, where both values were very large and negative (AgXH99, AGX1D1, AgXND5C1, and AgXND6U2), A. arabiensis showed reduced variation (see also Figure 2). Only at AgXH766 were values of ln RH (and, in the comparison with M, ln RV) large and positive. To identify loci potentially deviating from neutrality, observed ln RV and ln RH values should be standardized by the mean and standard deviation of corresponding values at putatively neutral loci in the same populations (Kauer et al. 2003). In the absence of independent evidence about neutral evolution, we used values from all available loci, including those eight potentially subject to positive selection. Under this conservative treatment (Schofl and Schlotterer 2004), there were no loci for which ln RV or ln RH fell outside of the interval between −1.96 and 1.96 except AgXH766, and that only for ln RH values (Table 1). For the comparison between M and S, M was in the numerator of ln RV and ln RH values. The significantly large negative ln RV value for AgXH766 in this comparison appears to lack biological meaning, as M is monomorphic and S nearly so at this locus. However, the large negative values for AgXH678, significant for ln RH, show that variation is significantly reduced in M and suggest that this locus is a candidate for nonneutral evolution. The large positive values at AgXND5B2 and AgXND6U3 indicate reduced variation in S, although these values were not significant after the conservative standardization protocol.
DISCUSSION
The incipient species A. gambiae M and S are defined in practice by fixed sequence differences at a single pericentromeric locus on the X chromosome, the rDNA. This has stimulated an extended debate about taxonomic status and has raised more profound questions about whether these taxa are on independent evolutionary trajectories, given that available evidence from other regions of the genome has generally revealed little or no differentiation between A. gambiae M and S (della Torre et al. 2002; Gentile et al. 2002). Notable exceptions include two X-linked microsatellite loci near the rDNA (Wang et al. 2001; Lehmann et al. 2003), where exceptionally high levels of differentiation were recorded. Despite the absence of genome-wide genetic differentiation, M and S are nevertheless associated with distinct ecological settings and are isolated by significant, although incomplete, premating reproductive barriers (Tripet et al. 2001; della Torre et al. 2002). These data led us to hypothesize a “large X effect,” a phenomenon noted in other examples of newly emerging species whereby differences are found disproportionately often on the X chromosome. Consistent with this hypothesis, at eight of nine microsatellite loci spanning >5 Mb at the proximal end of the X chromosome, we found levels of divergence that were among the largest ever recorded between M and S. In contrast, genetic distances at eight microsatellite loci distal to this region were not significantly different from zero.
The large X effect hypothesis assumes the existence of speciation genes on the X chromosome responsible for ecological and/or behavioral adaptations that affect mate choice, but it cannot by itself explain the disjunct distribution of differentiated and undifferentiated loci observed in this study. In the absence of counteracting forces, any genetic exchange between M and S on the X chromosome would lead to homogenization. Protection from recombination and by selection could facilitate the persistence of a differentiated region in the face of gene flow. By preventing recombination between alternative arrangements in closely related or emerging species, paracentric chromosomal inversions may contribute to the speciation process (Noor et al. 2001; Rieseberg 2001). The X chromosomes of A. gambiae and A. arabiensis are fixed for different inversions that may contribute to the large X effect noted between them (Slotman et al. 2004). No X chromosome inversions, detectable at the cytological level, distinguish M and S. However, recombination is generally suppressed near centromeres. Moderate levels of recombination occur along most of the X chromosome of A. gambiae (Zheng et al. 1996), but no estimates of recombination are yet available for the pericentromeric region proximal to AgXH678. We tentatively suggest that reduced recombination may at least partially explain the clustering of strikingly differentiated loci at the proximal end of the X chromosome.
The pattern of high differentiation proximally, but little or no differentiation distally, on the X chromosome in M and S is difficult to explain through the action of demographic forces alone. If selection and/or suppressed recombination are responsible for heightened differentiation, then a footprint of linkage disequilibrium and reduced allelic diversity would be expected. Although the strongly peaked allelic distributions of S at AgXND5C2 and AgXND6U3, and of M at AgXH678 and AgXND6U2, are suggestive of selective sweeps (Figure 2), the expected footprint was weak or nonexistent. The ability to detect these footprints diminishes with time, as recombination events and new microsatellite mutations break up allelic associations and restore allelic diversity. It is possible that the A. gambiae microsatellite mutation rate may be too high to detect any but the most recent selective sweeps. The upper-bound estimate of average mutation rate for dinucleotide microsatellites in this species is similar to the estimate in Drosophila melanogaster, ∼3 × 10⁻⁵ (Lehmann et al. 1998; Schug et al. 1998). As the nucleotide mutation rate is several orders of magnitude lower, SNP genotyping and DNA sequencing, underway in our laboratory, will increase the power to detect older selective sweeps.
Heightened differentiation observed between M and S at the base of the X chromosome is unlikely to be the result of local selection in Burkina Faso, nor is it likely to be limited to this one class of markers. Locus AgXH678 was surveyed previously outside of Burkina Faso: Mali to the north, Ghana to the south, Gabon, and the Democratic Republic of Congo to the distant southeast (Wang et al. 2001; Lehmann et al. 2003). The allelic distributions observed within M and S and the large genetic distance estimates between them are remarkably similar to our Burkina Faso study population across these locales. Additionally, we have surveyed these same Burkina Faso M and S populations, together with M and S populations from Mali, for transposable element insertion polymorphism on the X chromosome. In samples from both geographic locales, significant differentiation was found only at the proximal end of the X chromosome (Barnes et al. 2005).
The X chromosome harbors the only two taxonomic characters routinely used to identify morphologically indistinguishable A. arabiensis and A. gambiae: fixed chromosomal inversion differences and fixed sequence differences in the rDNA. Interestingly, the two diagnostic characters make sharply contrasting predictions about the phylogenetic relationship between these species and their siblings in the A. gambiae species complex. Resolution of the conflict between these characters requires invoking introgression of portions of the X chromosome; available data favor the hypothesis that it was the rDNA locus that was introgressed between species (Garcia et al. 1996; della Torre et al. 1997). This is consistent with the observation that rare synapsis between heterologous X chromosomes in female F1 hybrids of A. gambiae and A. arabiensis has been observed only at the proximal end of the X chromosome in the vicinity of the rDNA (Davidson et al. 1967; White 1971). These data led us to predict that differentiation between A. arabiensis and A. gambiae would be reduced in the pericentromeric region of the X chromosome. In fact, the data do not support this prediction. A. arabiensis is differentiated from both M and S at microsatellite loci along the entire length of the X chromosome. Strong differentiation remains even where allelic distributions apparently overlap. Particularly instructive are the distributions observed at AgXND6U3 and AgXND6U4, because despite the apparent overlap, close inspection reveals that the allele series are offset between taxa (Figure 2). At the first locus, while most alleles differ in size by multiples of two, the series is even in A. arabiensis and odd in M. At the second locus, most alleles differ in size by multiples of three, but the sizes are “out of register” (e.g., … 174–177–180 … in A. arabiensis and … 176–179–182 … in M). Although a small number of noncanonical alleles in these taxa could have been introgressed, sequence analysis revealed that they are more closely related to other alleles within the same taxon (not shown).
Also surprising was the lower diversity in A. arabiensis. This can be seen most clearly in Figure 2 from the smaller number of alleles and very strongly peaked distributions (occasional monomorphism) at many loci. Because A. arabiensis and A. gambiae are sibling species, it seems unlikely that different mutation rates could explain the difference. The population genetics of A. arabiensis is relatively poorly studied, so it can only be speculated that it has a smaller effective population size than A. gambiae in this part of Africa. However, even in the driest parts of West Africa that remain hospitable for this species, indirect genetic methods ruled out severe population bottlenecks between short annual rainy seasons (Taylor et al. 1993; Simard et al. 2000). Moreover, significant linkage disequilibrium was detected only between a pair of loci in 1C and 5B. Positive selection is another explanation that cannot be ruled out, although the reiteration of this pattern at so many widely distributed loci strains its credibility. The truth may lie in a complex interaction of forces, both nonneutral and demographic, that need to be disentangled by more detailed future studies at the sequence level.
This X chromosome scan using 17 microsatellite markers identified a 5-Mb centromere-proximal region that we believe contains genes of significance to ecological adaptation or premating behavior and may be contributing to an ongoing speciation process in M and S. We propose that at some point in the past, one or more advantageous mutations appeared at the base of the X chromosome in the M and/or in the S form. Positive selection on these mutations drove divergence between the forms and depleted polymorphism at the base of the X chromosome. Subsequent microsatellite mutations have largely restored variation, but selection against introgression and reduced recombination have maintained differentiation, even in the face of occasional interbreeding and admixture of other parts of the genome. Support for this model awaits similar scans in other populations across Africa, a higher density of microsatellite markers in candidate regions (such as that surrounding AgXH678), SNP and DNA sequencing studies, and ultimately functional analysis. Although the data do not resolve the taxonomic status of M and S, they have implications for public health by advancing the argument that these competent malaria vectors should be treated as separate entities with potentially unique population dynamics in models of malaria transmission.
Acknowledgments
We are grateful to A. Michel for technical advice and to Meagan Fitzpatrick for technical assistance. We thank the inhabitants of Goundri for their collaboration and the director and entomological staff of the Centre National de Recherche et de Formation sur le Paludisme for their support. Michael Barnes made helpful comments that improved the manuscript. This study was funded by grants from the National Institutes of Health (AI44003) to N.J.B., the UNDP/World Bank/World Health Organization Special Program for Research and Training in Tropical Diseases (00892) to N'F.S., and by an Arthur Schmidt Ph.D. Fellowship to A.D.S. J.A.S. was supported by National Science Foundation grant DBI-0139317 to Michelle Whaley.
References
- Barnes, M. J., N. F. Lobo, M. B. Coulibaly, N.'F. Sagnon, C. Costantini et al., 2005. SINE insertion polymorphism on the X chromosome differentiates Anopheles gambiae molecular forms. Insect Mol. Biol. (in press). [DOI] [PubMed]
- Barton, N. H., and K. S. Gale, 1993 Genetic analysis of hybrid zones, pp. 13–45 in Hybrid Zones and the Evolutionary Process, edited by R. G. Harrison. Oxford University Press, New York.
- Besansky, N. J., J. Krzywinski, T. Lehmann, F. Simard, M. Kern et al., 2003. Semipermeable species boundaries between Anopheles gambiae and Anopheles arabiensis: evidence from multilocus DNA sequence variation. Proc. Natl. Acad. Sci. USA 100: 10818–10823. [DOI] [PMC free article] [PubMed] [Google Scholar]
- Coluzzi, M., V. Petrarca and M. A. DiDeco, 1985. Chromosomal inversion intergradation and incipient speciation in Anopheles gambiae. Boll. Zool. 52: 45–63. [Google Scholar]
- Coluzzi, M., A. Sabatini, A. Della Torre, M. A. Di Deco and V. Petrarca, 2002. A polytene chromosome analysis of the Anopheles gambiae species complex. Science 298: 1415–1418. [DOI] [PubMed] [Google Scholar]
- Costantini, C., S. G. Li, A. Della Torre, N. Sagnon, M. Coluzzi et al., 1996. Density, survival and dispersal of Anopheles gambiae complex mosquitoes in a west African Sudan savanna village. Med. Vet. Entomol. 10: 203–219. [DOI] [PubMed] [Google Scholar]
- Counterman, B. A., D. Ortiz-Barrientos and M. A. F. Noor, 2004. Using comparative genomic data to test for fast-X evolution. Evolution 58: 656–660. [PubMed] [Google Scholar]
- Curtis, C. F., 1982 The mechanism of hybrid male sterility from crosses in the Anopheles gambiae and Glossina morsitans complexes, pp. 290–312 in Recent Developments in the Genetics of Insect Disease Vectors, edited by W. W. M. Steiner, W. J. Tabachnick, K. S. Rai and S. Narang. Stipes, Champaign, IL.
- Davidson, G., H. E. Paterson, M. Coluzzi, G. F. Mason and D. W. Micks, 1967 The Anopheles gambiae complex, pp. 211–250 in Genetics of Insect Vectors of Disease, edited by J. W. Wright and R. Pal. Elsevier, Amsterdam.
- della Torre, A., L. Merzagora, J. R. Powell and M. Coluzzi, 1997. Selective introgression of paracentric inversions between two sibling species of the Anopheles gambiae complex. Genetics 146: 239–244. [DOI] [PMC free article] [PubMed] [Google Scholar]
- della Torre, A., C. Fanello, M. Akogbeto, J. Dossou-yovo, G. Favia et al., 2001. Molecular evidence of incipient speciation within Anopheles gambiae s.s. in West Africa. Insect Mol. Biol. 10: 9–18. [DOI] [PubMed] [Google Scholar]
- della Torre, A., C. Costantini, N. J. Besansky, A. Caccone, V. Petrarca et al., 2002. Speciation within Anopheles gambiae—the glass is half full. Science 298: 115–117. [DOI] [PubMed] [Google Scholar]
- Dieringer, D., and C. Schlotterer, 2003. Microsatellite analyzer (MSA): a platform independent analysis tool for large microsatellite data sets. Mol. Ecol. Notes 3: 167–169. [Google Scholar]
- Falush, D., M. Stephens and J. K. Pritchard, 2003. Inference of population structure using multilocus genotype data: linked loci and correlated allele frequencies. Genetics 164: 1567–1587. [DOI] [PMC free article] [PubMed] [Google Scholar]
- Fanello, C., F. Santolamazza and A. della Torre, 2002. Simultaneous identification of species and molecular forms of the Anopheles gambiae complex by PCR-RFLP. Med. Vet. Entomol. 16: 461–464. [DOI] [PubMed] [Google Scholar]
- Favia, G., A. della Torre, M. Bagayoko, A. Lanfrancotti, N. Sagnon et al., 1997. Molecular identification of sympatric chromosomal forms of Anopheles gambiae and further evidence of their reproductive isolation. Insect Mol. Biol. 6: 377–383. [DOI] [PubMed] [Google Scholar]
- Garcia, B. A., A. Caccone, K. D. Mathiopoulos and J. R. Powell, 1996. Inversion monophyly in African anopheline malaria vectors. Genetics 143: 1313–1320. [DOI] [PMC free article] [PubMed] [Google Scholar]
- Gentile, G., M. Slotman, V. Ketmaier, J. R. Powell and A. Caccone, 2001. Attempts to molecularly distinguish cryptic taxa in Anopheles gambiae s.s. Insect Mol. Biol. 10: 25–32. [DOI] [PubMed] [Google Scholar]
- Gentile, G., A. Della Torre, B. Maegga, J. R. Powell and A. Caccone, 2002. Genetic differentiation in the African malaria vector, Anopheles gambiae s.s., and the problem of taxonomic status. Genetics 161: 1561–1578. [DOI] [PMC free article] [PubMed] [Google Scholar]
- Gentile, G., F. Santolamazza, C. Fanello, V. Petrarca, A. Caccone et al., 2004. Variation in an intron sequence of the voltage-gated sodium channel gene correlates with genetic differentiation between Anopheles gambiae s.s. molecular forms. Insect Mol. Biol. 13: 371–377. [DOI] [PubMed] [Google Scholar]
- Harr, B., M. Kauer and C. Schlotterer, 2002. Hitchhiking mapping: a population-based fine-mapping strategy for adaptive mutations in Drosophila melanogaster. Proc. Natl. Acad. Sci. USA 99: 12949–12954. [DOI] [PMC free article] [PubMed] [Google Scholar]
- Holt, R. A., G. M. Subramanian, A. Halpern, G. G. Sutton, R. Charlab et al., 2002. The genome sequence of the malaria mosquito Anopheles gambiae. Science 298: 129–149. [DOI] [PubMed] [Google Scholar]
- Kauer, M. O., D. Dieringer and C. Schlotterer, 2003. A microsatellite variability screen for positive selection associated with the “out of Africa” habitat expansion of Drosophila melanogaster. Genetics 165: 1137–1148. [DOI] [PMC free article] [PubMed] [Google Scholar]
- Lanzaro, G. C., Y. T. Toure, J. Carnahan, L. Zheng, G. Dolo et al., 1998. Complexities in the genetic structure of Anopheles gambiae populations in west Africa as revealed by microsatellite DNA analysis. Proc. Natl. Acad. Sci. USA 95: 14260–14265. [DOI] [PMC free article] [PubMed] [Google Scholar]
- Lehmann, T., W. A. Hawley, L. Kamau, D. Fontenille, F. Simard et al., 1996. Genetic differentiation of Anopheles gambiae populations from East and West Africa: comparison of microsatellite and allozyme loci. Heredity 77: 192–200. [DOI] [PubMed] [Google Scholar]
- Lehmann, T., W. A. Hawley, H. Grebert and F. H. Collins, 1998. The effective population size of Anopheles gambiae in Kenya: implications for population structure. Mol. Biol. Evol. 15: 264–276. [DOI] [PubMed] [Google Scholar]
- Lehmann, T., M. Licht, N. Elissa, B. T. Maega, J. M. Chimumbwa et al., 2003. Population structure of Anopheles gambiae in Africa. J. Hered. 94: 133–147. [DOI] [PubMed] [Google Scholar]
- Machado, C. A., R. M. Kliman, J. A. Markert and J. Hey, 2002. Inferring the history of speciation from multilocus DNA sequence data: the case of Drosophila pseudoobscura and close relatives. Mol. Biol. Evol. 19: 472–488. [DOI] [PubMed] [Google Scholar]
- Mayr, E., 1963 Animal Species and Evolution. Harvard University Press, Cambridge, MA.
- Mukabayire, O., J. Caridi, X. Wang, Y. T. Toure, M. Coluzzi et al., 2001. Patterns of DNA sequence variation in chromosomally recognized taxa of Anopheles gambiae: evidence from rDNA and single copy loci. Insect Mol. Biol. 10: 33–46. [DOI] [PubMed] [Google Scholar]
- Noor, M. A., K. L. Grams, L. A. Bertucci and J. Reiland, 2001. Chromosomal inversions and the reproductive isolation of species. Proc. Natl. Acad. Sci. USA 98: 12084–12088. [DOI] [PMC free article] [PubMed] [Google Scholar]
- Pritchard, J. K., M. Stephens and P. Donnelly, 2000. Inference of population structure using multilocus genotype data. Genetics 155: 945–959. [DOI] [PMC free article] [PubMed] [Google Scholar]
- Prowell, D. P., 1998 Sex linkage and speciation in Lepidoptera, pp. 309–319 in Endless Forms: Species and Speciation, edited by D. J. Howard and S. H. Berlocher. Oxford University Press, New York.
- Raymond, M., and F. Rousset, 1995. GENEPOP Version 1.2. A population genetics software for exact tests and ecumenicism. J. Hered. 86: 248–249. [Google Scholar]
- Rieseberg, L. H., 2001. Chromosomal rearrangements and speciation. Trends Ecol. Evol. 16: 351–358. [DOI] [PubMed] [Google Scholar]
- Rozen, S., and H. J. Skaletsky, 2000 Primer3 on the WWW for general users and for biologist programmers, pp. 365–386 in Bioinformatics Methods and Protocols: Methods in Molecular Biology, edited by S. Krawetz and S. Misener. Humana Press, Totowa, NJ. [DOI] [PubMed]
- Saetre, G. P., T. Borge, K. Lindroos, J. Haavie, B. C. Sheldon et al., 2003. Sex chromosome evolution and speciation in Ficedula flycatchers. Proc. R. Soc. Lond. B Biol. Sci. 270: 53–59. [DOI] [PMC free article] [PubMed] [Google Scholar]
- Schlotterer, C., 2002. A microsatellite-based multilocus screen for the identification of local selective sweeps. Genetics 160: 753–763. [DOI] [PMC free article] [PubMed] [Google Scholar]
- Schofl, G., and C. Schlotterer, 2004. Patterns of microsatellite variability among X chromosomes and autosomes indicate a high frequency of beneficial mutations in non-African D. simulans. Mol. Biol. Evol. 21: 1384–1390. [DOI] [PubMed] [Google Scholar]
- Schug, M. D., C. M. Hutter, K. A. Wetterstrand, M. S. Gaudette, T. F. Mackay et al., 1998. The mutation rates of di-, tri- and tetranucleotide repeats in Drosophila melanogaster. Mol. Biol. Evol. 15: 1751–1760. [DOI] [PubMed] [Google Scholar]
- Simard, F., T. Lehmann, J. J. Lemasson, M. Diatta and D. Fontenille, 2000. Persistence of Anopheles arabiensis during the severe dry season conditions in Senegal: an indirect approach using microsatellite loci. Insect Mol. Biol. 9: 467–479. [DOI] [PubMed] [Google Scholar]
- Slatkin, M., 1995. A measure of population subdivision based on microsatellite allele frequencies. Genetics 139: 457–462. [DOI] [PMC free article] [PubMed] [Google Scholar]
- Slotman, M., A. della Torre and J. R. Powell, 2004. The genetics of inviability and male sterility in hybrids between Anopheles gambiae and An. arabiensis. Genetics 167: 275–287. [DOI] [PMC free article] [PubMed] [Google Scholar]
- Sperling, F. A. H., 1994. Sex-linked genes and species differences in Lepidoptera. Can. Entomol. 126: 807–818. [Google Scholar]
- Taylor, C. E., Y. T. Toure, M. Coluzzi and V. Petrarca, 1993. Effective population size and persistence of Anopheles arabiensis during the dry season in west Africa. Med. Vet. Entomol. 7: 351–357. [DOI] [PubMed] [Google Scholar]
- Toure, Y. T., V. Petrarca, S. F. Traore, A. Coulibaly, H. M. Maiga et al., 1998. The distribution and inversion polymorphism of chromosomally recognized taxa of the Anopheles gambiae complex in Mali, West Africa. Parassitologia 40: 477–511. [PubMed] [Google Scholar]
- Tripet, F., Y. T. Toure, C. E. Taylor, D. E. Norris, G. Dolo et al., 2001. DNA analysis of transferred sperm reveals significant levels of gene flow between molecular forms of Anopheles gambiae. Mol. Ecol. 10: 1725–1732. [DOI] [PubMed] [Google Scholar]
- Wang, R., F. C. Kafatos and L. Zheng, 1999. Microsatellite markers and genotyping procedures for Anopheles gambiae. Parasitol. Today 15: 33–37. [DOI] [PubMed] [Google Scholar]
- Wang, R., L. Zheng, Y. T. Toure, T. Dandekar and F. C. Kafatos, 2001. When genetic distance matters: measuring genetic differentiation at microsatellite loci in whole-genome scans of recent and incipient mosquito species. Proc. Natl. Acad. Sci. USA 98: 10769–10774. [DOI] [PMC free article] [PubMed] [Google Scholar]
- White, G. B., 1971. Chromosomal evidence for natural interspecific hybridization by mosquitoes of the Anopheles gambiae complex. Nature 231: 184–185. [DOI] [PubMed] [Google Scholar]
- Wondji, C., F. Simard and D. Fontenille, 2002. Evidence for genetic differentiation between the molecular forms M and S within the forest chromosomal form of Anopheles gambiae in an area of sympatry. Insect Mol. Biol. 11: 11–19. [DOI] [PubMed] [Google Scholar]
- Wu, C.-I, 2001. The genic view of the process of speciation. J. Evol. Biol. 14: 851–865. [Google Scholar]
- Zheng, L., F. H. Collins, V. Kumar and F. C. Kafatos, 1993. A detailed genetic map for the X chromosome of the malaria vector, Anopheles gambiae. Science 261: 605–608. [DOI] [PubMed] [Google Scholar]
- Zheng, L., M. Q. Benedict, A. J. Cornel, F. H. Collins and F. C. Kafatos, 1996. An integrated genetic map of the African human malaria vector mosquito, Anopheles gambiae. Genetics 143: 941–952. [DOI] [PMC free article] [PubMed] [Google Scholar]