

Abstract
Immune system genes in a California population sample of Drosophila simulans were shown to bear several hallmarks of the effects of past directional selection. One potential effect of directional selection is an increase in linkage disequilibrium among the polymorphic sites that are linked to the site under selection. In this study, we focus on three D. simulans immunity loci, Hmu, Sr-CI/Sr-CIII, and Tehao, for which the polymorphic sites are in nearly perfect linkage disequilibrium, an unusual finding even with respect to other immunity genes sampled from the same lines. The most likely explanation for this finding is that, at each locus, two divergent alleles have been selected to intermediate frequencies in the recent past. The extent to which the linkage disequilibrium extends to the flanks of each of the immunity genes is minimal, suggesting that the favored mutations actually occurred within the immunity genes themselves. Furthermore, the excess linkage disequilibrium found in the California population is not found in an African D. simulans population sample and may be a result of novel pathogen-mediated selection pressures encountered during establishment of non-African populations.
ONE of the opportunities of evolutionary genomics is to use heterogeneity in observed patterns of nucleotide variation to infer the relative importance of various modes of selection. Heterogeneity in polymorphism and/or divergence can be investigated in many contexts, including variation across classes of nucleotide sites, variation between regulatory and coding regions, variation between genes of different functional classes, and spatial variation along chromosomes. The rationale behind investigation of genomic heterogeneity, as opposed to tests of individual loci vs. an explicit theoretical model of evolution, is that unusual empirical observations made in a genomic context are more likely to require explanations involving natural selection. This conclusion follows from the idea that demographic effects such as population bottlenecks or population expansions are expected to have homogeneous effects across the genome and therefore are unlikely to be a major source of genomic heterogeneity. At the very least, it seems reasonable to propose that unusual patterns of genomic heterogeneity are worthy of further empirical and/or theoretical investigations.
For example, we recently compared patterns of polymorphism and divergence in immune system genes vs. a random sample of genes in Drosophila simulans (Schlenke and Begun 2003). Our study revealed that the population genetics of immune system genes is dramatically different from the population genetics of most D. simulans genes. Immune system genes were consistent outliers compared to the random sample of genes, showing increased protein evolution, reduced silent site heterozygosity, an unusual frequency distribution of polymorphisms, and reduced haplotype diversity. It is highly unlikely that demographic effects could provide a sufficient explanation for these differences. We interpreted these data as support for the idea that positively selected mutations are more common and have larger effects in immunity genes compared to most other genes in this species.
An alternative approach for investigating heterogeneity in genetic variation is to assay spatial variation along chromosomes. For example, we recently reported an unusual “valley” of severely reduced heterozygosity on chromosome 2R of D. simulans, consistent with the hitchhiking effect of a beneficial mutation (Schlenke and Begun 2004). Interestingly, we found no evidence of reduced heterozygosity in an African sample of D. simulans, suggesting recent strong “Out-of-Africa” adaptive evolution associated with this genomic region. Other recently published studies of Drosophila have also found evidence for heterozygosity valleys associated with non-African populations (Harr et al. 2002; Glinka et al. 2003). These examples demonstrate the usefulness of joint analysis of heterogeneity across chromosomes and populations.
In this article we use a combination of these genomic heterogeneity approaches to infer the recent selective histories of candidate selected D. simulans genes, using within-locus linkage disequilibrium (LD) as our descriptor of nucleotide variation. Linkage disequilibrium, or the associations between mutations at different sites, can result from genetic drift or from natural selection (Przeworski 2002). For example, unusually high LD would result if a single haplotype rapidly increased in frequency as a result of either directional selection or genetic drift. The creation of LD by drift is facilitated by demographic effects such as population bottlenecks (Wall et al. 2002), a process that may be relevant in D. simulans given evidence of reduced nucleotide variation and excess LD associated with establishment of non-African populations (Irvin et al. 1998; Andolfatto and Przeworski 2000; Andolfatto 2001; Wall et al. 2002). Once again, however, the genome-wide LD generated by drift in D. simulans may be distinguished from LD generated by selection because effects of positive selection on LD are expected to be gene specific. Although spatial patterns of intralocus LD have been the subject of recent attention in human genomics (Sabeti et al. 2002; Saunders et al. 2002; Ohashi et al. 2004), there has been little attempt to use spatial patterns of LD in flies to make inferences on the selective forces affecting different genomic regions.
Here we show that the three immunity loci Hmu, Sr-CI/Sr-CIII, and Tehao have a significant excess of intralocus LD compared to other immunity and nonimmunity genes sequenced from the same California D. simulans lines, indicative of recent positive selection. Hemomucin (Hmu) is a hemocyte surface mucin that binds a known inducer of the gram-negative antibacterial humoral response pathway (Theopold et al. 1996). Sr-CI is a hemocyte-specific plasma membrane class C scavenger receptor that can bind a wide variety of microbial ligands (Pearson et al. 1995) and is implicated in phagocytosis of pathogens (Ramet et al. 2001), while Sr-CIII is a tandem duplicate of Sr-CI that is putatively secreted into the hemolymph. Tehao (otherwise known as Toll-5) is a Toll-like transmembrane receptor that can activate transcription of the antifungal immunity peptide drosomycin (Tauszig et al. 2000; Luo et al. 2001). It is possible that all three of these loci act as pattern recognition receptors (Theopold et al. 1996; Kimbrell and Beutler 2001; Ramet et al. 2001). We investigated the likelihood that the extreme LD in these three loci was generated by positive selection on sites in these genes, as opposed to linked genes, by measuring the extent of LD upstream and downstream of each locus. We also collected population DNA sequence data for these genes from three additional D. simulans population samples to address the possibility of geographically or temporally variable selection pressures.
MATERIALS AND METHODS
D. simulans DNA sequence data are from four population samples, CA1, CA2, TX, and ZIM. The CA1 sample consists of eight highly inbred lines made from field-caught inseminated females collected in the Wolfskill Orchard, Winters, California in Summer 1995. The CA2 sample consists of field-caught D. simulans males collected from Davis, California (∼20 miles east of the Wolfskill Orchard) in Spring 2001. The TX sample consists of field-caught D. simulans males collected from Austin, Texas in Spring 2000. The ZIM sample consists of field-caught isofemale lines collected from Harare, Zimbabwe in 1997 and kindly provided by C. Aquadro. These lines are a subset of the Zimbabwe sample used in a previous study of DNA sequence variation at vermilion and G6pd in African and non-African populations of D. simulans (Hamblin and Veuille 1999).
Hmu, Sr-CI/Sr-CIII, and Tehao sequences from the CA1 sample (previously published GenBank accession nos. AY349745, AY349746, AY349747, AY349748, AY349749, AY349750, AY349751, AY349752, AY349846, AY349847, AY349848, AY349849, AY349850, AY349851, AY349852, AY349853, and AY349878, AY349879, AY349880, AY349881, AY349882, AY349883, AY349884, AY349885, AY349886, AY349887, AY349888, AY349889, AY349890, AY349891, AY349892, AY349893), as well as sequences from tightly linked regions, were amplified from genomic DNA. Sr-CI and Sr-CIII sequences were concatenated and treated as a single locus because they are very tightly linked (∼300 bp between coding regions). Because the CA2, TX, and ZIM lines were not highly inbred, PCR products from these lines were generated using the Expand High-Fidelity PCR system (Boehringer Mannheim, Indianapolis) and cloned prior to sequencing. This procedure introduces polymerase errors into the data at a low level [∼4.8 × 10⁻⁶ errors/base, which corresponds to ∼1 error/3000 bp for a typical DNA fragment after 35 PCR cycles (Keohavong and Thilly 1989)]; however, such errors are likely to be singletons. Therefore, in analyses using the CA2, TX, and ZIM samples we excluded mutations that occur as singletons in all four population samples combined (the CA1 sample harbored no such singletons; see supplementary Table 1 at http://www.genetics.org/supplemental/). Although this method eliminates actual and artifactual singletons, it is conservative with respect to our conclusions, since LD values in the CA2, TX, and ZIM samples are increased by removing such singleton mutations (making them more similar to CA1). All sequences were determined on an Applied Biosystems 377 automated sequencer. Sequences flanking Hmu, Sr-CI/Sr-CIII, and Tehao from the D. simulans CA1 population sample and sequences from Hmu, Sr-CI/Sr-CIII, and Tehao from the D. simulans CA2, TX, and ZIM population samples are deposited in GenBank under accession nos. AY864379, AY864606.
LD was estimated using the ZnS statistic, which is a standardized variant of the D statistic (pij − pipj, the frequency that alleles at two loci occur on the same haplotype minus the product of the individual allele frequencies) averaged over all pairwise combinations of segregating sites at a locus (Kelly 1997). Significance values for the ZnS statistic were calculated in DnaSP (Rozas et al. 2003) by comparing the observed values to those obtained from sets of 10,000 simulated neutral coalescence genealogies, conditional on the observed number of segregating sites (S). The simulations were conducted without recombination. The P-values are the proportion of simulated data sets for which the ZnS value is greater than or equal to the observed ZnS value. Because we are testing for excess LD, simulating data under the assumption of no recombination is extremely conservative.
We conducted bottleneck simulations using the ms program (Hudson 2002) to determine whether excess linkage disequilibrium at some genes in the CA1 population sample might be explained by a population bottleneck out of Africa. In these simulations, an ancestral population incurs an instantaneous reduction in effective population size (Ne) at various timepoints in the past, followed by an instantaneous return to the ancestral population size 1000 generations later (or 100 years, assuming 10 generations/year). Ancestral D. simulans Ne was assumed to be 2 × 10⁶ (Przeworski et al. 2001). Given that Hmu, Sr-CI/Sr-CIII, and Tehao are located in cytological locations (Table 2) expected to undergo normal levels of recombination (Ohnishi and Voelker 1979; True et al. 1996), the recombination rate per site (r) was assumed to be 5 × 10⁻⁸ (True et al. 1996; Comeron et al. 1999). Average observed nucleotide diversity (θ) from the ZIM population is 0.013, whereas it is 0.007 in the CA1 population sample, a 46% reduction. In pilot experiments we determined that an ∼99.91% reduction in effective population size is required to cause a 46% reduction in θ. Thus, a 99.91% reduction in Ne was imposed on simulated population samples. P-values for observed ZnS values at Hmu, Sr-CI/Sr-CIII, and Tehao were calculated by comparison to ZnS values from 10,000 such simulated data sets. Because variance in ZnS is high when there are few segregating sites, only simulated data sets harboring 20 or more segregating sites were used for calculating P-values (in the most extreme case, only 11% of simulated data sets had <20 segregating sites).
TABLE 2.
LD values for outlier genes from the CA1 population sample
| Gene | Cytological location |
N | Sites | S | ZnS | P-value |
|---|---|---|---|---|---|---|
| Dredd | 1B | 8 | 1237 | 3 | 1.000 | 0.145 |
| garnet | 12B | 7 | 1265 | 17 | 0.886 | 0.018 |
| Hmu | 97F | 8 | 1901 | 21 | 1.000 | 0.002 |
| Sr-CI/Sr-CIII | 24D | 8 | 2915 | 58 | 1.000 | 0.000 |
| Tehao | 34B | 8 | 2049 | 26 | 0.966 | 0.001 |
Genetic differentiation between the CA, TX, and ZIM population samples was estimated using Snn, Hudson's nearest neighbor statistic (Hudson 2000). Snn is the fraction of nearest neighbors (most closely related alleles) of a sequence that occurs in the same population as that sequence, averaged over all sequences. Unlike other population differentiation estimates (Workman and Niswander 1970; Hudson et al. 1992), the Snn statistic was designed to have power to differentiate both high- and low-diversity populations (Hudson 2000). Significance values for the Snn statistic were determined by permutations (n = 10,000) implemented in DnaSP (Rozas et al. 2003). The P-value is the proportion of permuted data sets for which Snn is greater than or equal to the observed Snn.
RESULTS
LD in immunity and nonimmunity genes:
We estimated LD in 61 CA1 D. simulans immunity (N = 33; 29 autosomal, 4 X-linked) and nonimmunity (N = 28; 13 autosomal, 15 X-linked) genes that were sequenced as part of earlier surveys (Begun and Whitley 2000; Schlenke and Begun 2003). Despite evidence for increased haplotype structure in immunity genes (Schlenke and Begun 2003), average ZnS was not significantly different between immunity and nonimmunity genes (Table 1). ZnS values for 56 of these genes are roughly evenly distributed between 0.16 and 0.64 (Figure 1a). However, ZnS values for four immunity loci (Dredd, Hmu, Sr-CI/Sr-CIII, and Tehao) and one nonimmunity X-linked locus (garnet), have ZnS estimates near 1.0, far outside the range of the other genes. LD in Hmu, Sr-CI/Sr-CIII, Tehao, and garnet is highly significant even under the extremely conservative assumption of no recombination (Table 2). Because its small number of segregating sites (S = 3) decreases power, Dredd was not found to have a significant excess of LD.
TABLE 1.
Average LD in different gene classes from CA1D. simulans
| ZnS | Mann-Whitney U P-value | ||
|---|---|---|---|
| Immunity | 0.417 | Imm vs. 3R | 0.495 |
| NonImm-3R | 0.337 | Imm vs. X | 0.345 |
| NonImm-X | 0.439 | X vs. 3R | 0.107 |
Figure 1.—

(a) Linkage disequilibrium (ZnS) values in D. simulans immunity, nonimmunity autosomal, and nonimmunity X-linked genes from the CA1 population sample. Outlier genes are identified. (b) Nucleotide heterozygosity (θ) in the same genes.
We decided to focus on the three immunity loci, Hmu, Sr-CI/Sr-CIII, and Tehao. With the exception of one site in Tehao, polymorphic sites in each of these genes are in complete linkage disequilibrium—that is, there are only two haplotypes or “major alleles.” Nevertheless, heterozygosity at Hmu, Sr-CI/Sr-CIII, and Tehao is similar to that observed in other immunity and nonimmunity genes (Figure 1b), demonstrating that the two haplotypes segregating at these loci are highly divergent (Figure 2). Compared to a typical D. simulans locus, it is as though two divergent chromosomes replaced all other chromosomes in the population. The presence of one or more major alleles has previously been observed at loci from several D. simulans population samples (Begun and Aquadro 1994, 1995; Begun et al. 1994; Eanes et al. 1996; Hasson et al. 1998; Hamblin and Veuille 1999; Labate et al. 1999; Quesada et al. 2003; Schlenke and Begun 2004). However, the absence of polymorphism within major alleles and the lack of a diversity of low-frequency alleles at CA1 Hmu, Sr-CI/Sr-CIII, and Tehao are unique for genes located in regions of normal recombination.
Figure 2.—
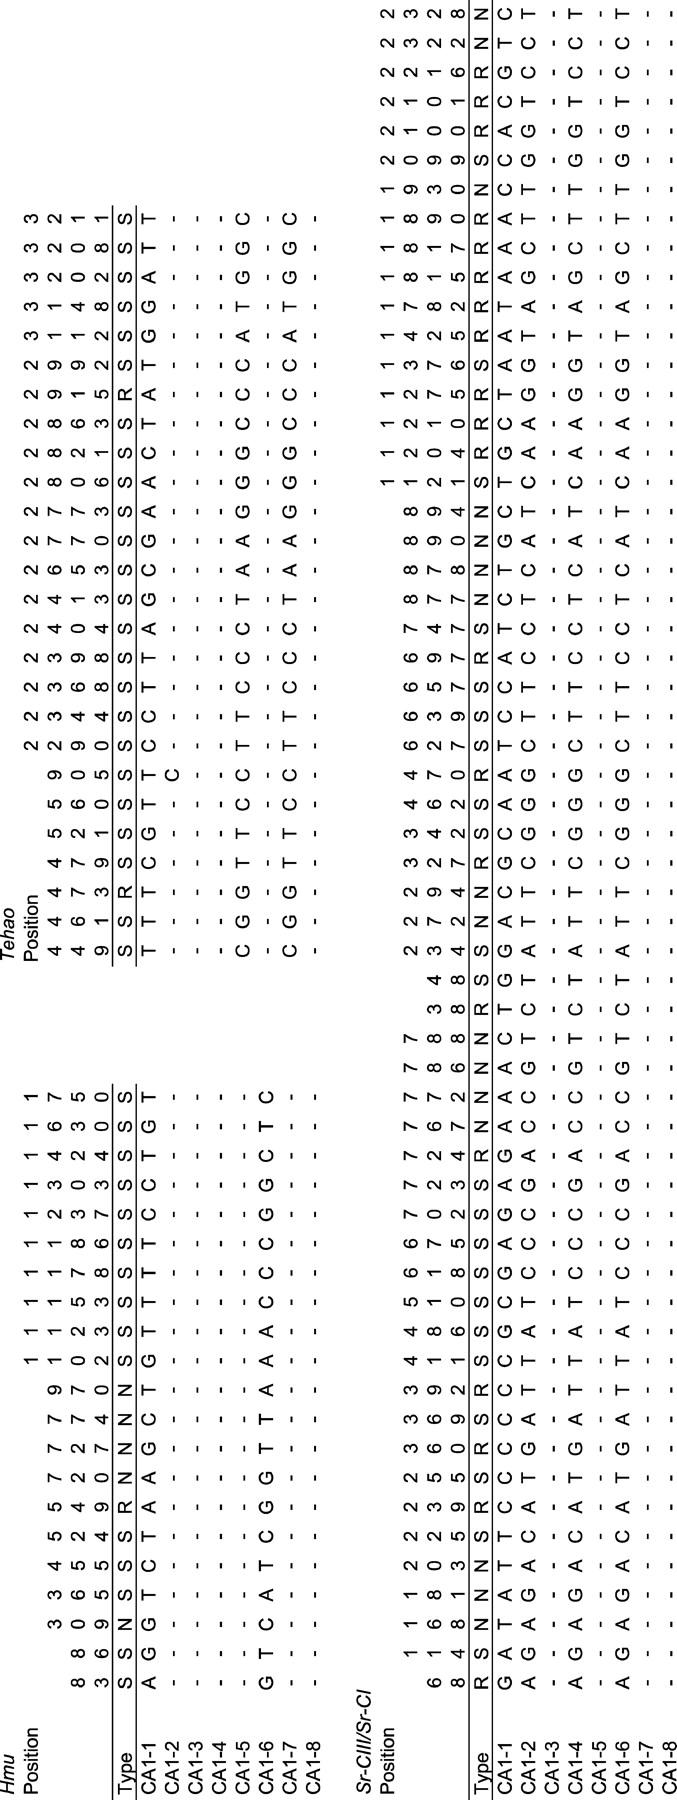
Polymorphism tables for Hmu, Sr-CI/Sr-CIII, and Tehao from the CA1 population sample. Position refers to the nucleotide position in the alignment; type refers to noncoding, silent, or replacement mutations; and dashes represent identity to the allele at first sequence.
Excess LD may be generated by positive selection or genetic drift (Przeworski 2002). While the effects of positive selection are expected to be gene specific, strong drift is expected to cause a genome-wide increase in LD. Although ZnS values at Hmu, Sr-CI/Sr-CIII, and Tehao appear to be outliers compared to other genes (Figure 1a), it is possible that genetic drift associated with a population bottleneck might increase variance in LD enough that outliers such as Hmu, Sr-CI/Sr-CIII, and Tehao are expected. We tested this possibility by conducting simple population bottleneck simulations in which the ancestral D. simulans effective population size decreased from 2 × 10⁶ to 1800 individuals sometime in the past and then returned to the ancestral Ne after 1000 generations (see materials and methods). We tested the effects of bottlenecks at three timepoints: 3000, 12,000, and 60,000 generations in the past. These timepoints span the range of estimates for the timing of the worldwide colonization of D. simulans out of Africa (Lachaise et al. 1988).
ZnS values from simulations that assume a bottleneck between 3000 and 12,000 generations ago provided the best match to the average ZnS value of genes from the CA1 population sample (Table 3). Assuming a bottleneck occurred between 3000 and 12,000 generations ago, we can extrapolate from the data that the probability of observing a locus with a ZnS value on the order of those from Hmu, Sr-CI/Sr-CIII, and Tehao is exceedingly small (between 0.058 and 0.001 for Hmu, between 0.027 and 0.000 for Sr-CI/Sr-CIII, and between 0.030 and 0.000 for Tehao). This result is robust to changes in the assumed recombination rate, bottleneck strength, and duration of the population size reduction (data not shown). Thus, it appears unlikely that a simple population bottleneck scenario can explain both the high ZnS values observed at Hmu, Sr-CI/Sr-CIII, and Tehao and the much lower average ZnS value from the CA1 population sample. Instead, we propose that LD in these genes was generated by linked selection of beneficial mutations.
TABLE 3.
Results of population bottleneck simulations
| θ | ZnS |
P-value of observed LD |
|
|---|---|---|---|
| Observed population averages | |||
| ZIM | 0.013 | 0.209 | |
| CA1 | 0.007 | 0.415 | |
| Simulated bottleneck averagesa | |||
| Hmu, none | 0.013 | 0.152 | |
| Hmu, t = 3,000b | 0.007 | 0.522 | 0.0575 |
| Hmu, t = 12,000 | 0.007 | 0.332 | 0.0012 |
| Hmu, t = 60,000 | 0.007 | 0.194 | 0.0000 |
| Sr-CI/Sr-CIII, none | 0.013 | 0.149 | |
| Sr-CI/Sr-CIII, t = 3,000 | 0.007 | 0.466 | 0.0266 |
| Sr-CI/Sr-CIII, t = 12,000 | 0.007 | 0.280 | 0.0004 |
| Sr-CI/Sr-CIII, t = 60,000 | 0.007 | 0.176 | 0.0000 |
| Tehao, none | 0.013 | 0.149 | |
| Tehao, t = 3,000 | 0.007 | 0.463 | 0.0296 |
| Tehao, t = 12,000 | 0.007 | 0.277 | 0.0003 |
| Tehao, t = 60,000 | 0.007 | 0.175 | 0.0000 |
The only difference between gene simulations is the length in base pairs over which recombination can occur.
Time in generations since the bottleneck occurred.
LD in flanking regions:
The elevated LD at Hmu, Sr-CI/Sr-CIII, and Tehao could result from selection acting on these genes or on tightly linked genes. We reasoned that if LD quickly diminishes to each flank of the immunity genes, it is likely that selection acted on the immunity genes themselves. To investigate this issue, we collected population DNA sequence data from several loci proximal and distal of Hmu, Sr-CI/Sr-CIII, and Tehao to describe the physical scale of LD near the immunity genes.
For each case, the immunity genes are located at the center of the regions of excess LD, which declines and becomes nonsignificant to both 5′- and 3′-flanking regions (Figure 3). For Hmu, the excess LD may extend up to 87 kb, as the ZnS value for the locus 23 kb to the 5′ flank of Hmu is significantly high, and the ZnS value for the locus 25 kb to the 3′ flank of Hmu remains at 1.0 (but is not significant because of a paucity of segregating sites; Table 4). For both the Sr-CI/Sr-CIII and the Tehao gene regions, LD drops off precipitously to both flanks. Excess LD may extend only up to 39 kb around Sr-CI/Sr-CIII and 16 kb around Tehao (Table 4). Aside from the immunity genes, there are only 14 other predicted genes in the region of potentially excess LD surrounding Hmu, 1 other predicted gene in the region of potentially excess LD surrounding Sr-CI/Sr-CIII, and 2 other predicted genes in the region of potentially excess LD surrounding Tehao (see supplementary Table 2 at http://www.genetics.org/supplemental/). These results support the idea that selected mutations leading to the extreme perturbations observed in our samples are associated with immunity gene regulatory or coding regions, although other sites are not ruled out.
Figure 3.—
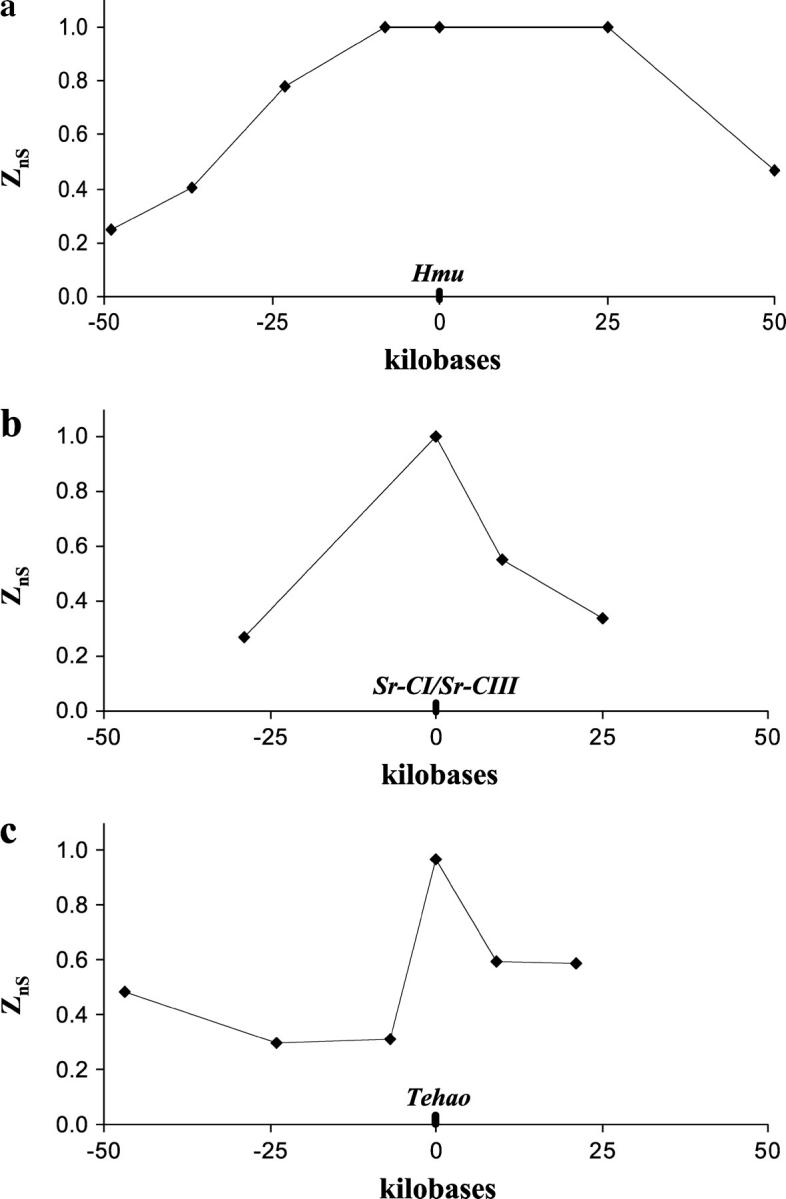
LD values at loci to the flanks of Hmu, Sr-CI/Sr-CIII, and Tehao in the CA1 population sample.
TABLE 4.
LD values to the flanks ofHmu,Sr-CI/Sr-CIII, andTehao in CA1
| Gene region | N | Sites | S | ZnS | P-value |
|---|---|---|---|---|---|
| Hmu | |||||
| 5′ 49 kb | 8 | 1075 | 18 | 0.248 | 0.839 |
| 5′ 37 kba | 8 | 1237 | 10 | 0.407 | 0.390 |
| 5′ 23 kb | 8 | 975 | 11 | 0.782 | 0.040 |
| 5′ 8 kb | 8 | 1130 | 12 | 1.000 | 0.006 |
| 3′ 25 kb | 8 | 980 | 3 | 1.000 | 0.143 |
| 3′ 50 kb | 8 | 905 | 40 | 0.466 | 0.276 |
| Sr-CI/Sr-CIII | |||||
| 5′ 29 kb | 8 | 490 | 23 | 0.267 | 0.799 |
| 3′ 10 kb | 8 | 388 | 16 | 0.551 | 0.178 |
| 3′ 25 kb | 8 | 772 | 18 | 0.341 | 0.560 |
| Tehao | |||||
| 5′ 47 kb | 8 | 754 | 9 | 0.481 | 0.276 |
| 5′ 24 kb | 8 | 537 | 6 | 0.301 | 0.609 |
| 5′ 7 kb | 8 | 663 | 21 | 0.308 | 0.666 |
| 3′ 9 kb | 8 | 877 | 18 | 0.597 | 0.135 |
| 3′ 21 kb | 8 | 583 | 4 | 0.587 | 0.179 |
The Hmu 5′ 37-kb locus corresponds to the immunity gene pelle (Schlenke and Begun 2003).
Geographic and temporal pattern of LD:
To further investigate the potential nature of selection associated with Hmu, Sr-CI/Sr-CIII, and Tehao, we sequenced these genes in three additional D. simulans population samples. For the Sr-CI/Sr-CIII locus, data for the new populations were limited to Sr-CI. Singleton mutations from the four population samples combined were deleted for the following analyses (see materials and methods); however, results from data including the singletons are qualitatively similar (not shown). For all three genes, we estimated genetic differentiation between population samples, as well as nucleotide heterozygosity, the number of haplotypes, and LD within each population sample (Tables 5 and 6).
TABLE 5.
Genetic differentiation between population samples
|
Hmu
|
Sr-CI
|
Tehao
|
||||
|---|---|---|---|---|---|---|
| Populations | Snn | P-value | Snn | P-value | Snn | P-value |
| CA1 vs. CA2 | 0.404 | 1.000 | 0.433 | 0.783 | 0.545 | 0.193 |
| CA1 + 2 vs. TX | 0.540 | 0.139 | 0.558 | 0.185 | 0.474 | 0.675 |
| CA1 + 2 vs. ZIM | 0.926 | 0.000 | 0.748 | 0.001 | 0.796 | 0.000 |
| TX vs. ZIM | 0.681 | 0.041 | 0.500 | 0.424 | 0.634 | 0.053 |
| CA + TX vs. ZIM | 0.799 | 0.000 | 0.707 | 0.010 | 0.800 | 0.000 |
TABLE 6.
Polymorphism statistics forHmu,Sr-CI, andTehao from different populations
| Gene | Population | N | Sites | S | θ | No. of haplotypes |
ZnS | P-value |
|---|---|---|---|---|---|---|---|---|
| Hmu | CA1 | 8 | 1901 | 21 | 0.004 | 2 | 1.000 | 0.002 |
| CA2 | 8 | 1917 | 21 | 0.004 | 2 | 1.000 | 0.002 | |
| CA-both | 16 | 1887 | 21 | 0.003 | 2 | 1.000 | 0.000 | |
| TX | 12 | 1901 | 44 | 0.008 | 7 | 0.364 | 0.315 | |
| ZIM | 11 | 1868 | 60 | 0.012 | 10 | 0.149 | 0.992 | |
| Sr-CI | CA1 | 8 | 2136 | 35 | 0.006 | 2 | 1.000 | 0.000 |
| CA2 | 7 | 2717 | 65 | 0.010 | 3 | 0.511 | 0.262 | |
| CA-both | 15 | 2126 | 51 | 0.007 | 3 | 0.537 | 0.050 | |
| TX | 11 | 2703 | 82 | 0.010 | 8 | 0.255 | 0.698 | |
| ZIM | 11 | 2621 | 92 | 0.012 | 10 | 0.160 | 0.985 | |
| Tehao | CA1 | 8 | 2049 | 26 | 0.005 | 3 | 0.966 | 0.001 |
| CA2 | 8 | 1903 | 0 | 0.000 | 1 | NA | NA | |
| CA-both | 16 | 1777 | 22 | 0.004 | 3 | 0.965 | 0.000 | |
| TX | 12 | 1992 | 37 | 0.006 | 5 | 0.488 | 0.131 | |
| ZIM | 12 | 1880 | 41 | 0.008 | 9 | 0.190 | 0.874 | |
| G6PD | ZIM | 11 | 724 | 13 | 0.006 | 9 | 0.205 | 0.795 |
| vermilion | ZIM | 10 | 728 | 30 | 0.015 | 7 | 0.199 | 0.904 |
NA, not applicable.
The CA2 sample, collected from the same locality as CA1 but 6 years later, allows us to assess the temporal nature of the LD observed in the CA1 sample at Hmu, Sr-CI/Sr-CIII, and Tehao. Haplotype structure at Hmu is identical in the CA1 and CA2 samples, with the same haplotypes occurring at frequencies 7/8 and 1/8 in each (see supplementary Figure 1 at http://www.genetics.org/supplemental/). For Sr-CI, haplotypes at 5/8 and 3/8 frequency in CA1 occur at 3/7 and 3/7 frequency in CA2. A third CA2 haplotype at 1/7 frequency is nearly identical to a haplotype found in the TX and ZIM population samples. For Tehao, the major allele found at 6/8 frequency in CA1 was found at 8/8 frequency in CA2. These data, along with lack of evidence for genetic differentiation between the CA samples based on the Snn statistic (Table 5), reveal no major change in haplotype structure for the three genes in the 6 years between the collection of the CA1 and CA2 population samples. Therefore, data from the CA1 and CA2 samples were combined and are referred to as the CA sample. Thus, in the CA sample, there are two invariant haplotypes at Hmu (at frequencies 14/16 and 2/16), three invariant haplotypes at Sr-CI (at frequencies 8/15, 6/15, and 1/15), and two haplotypes at Tehao (at frequencies 14/16 and 2/16, although one allele of the more common haplotype has one mutation).
The Snn test statistic revealed no significant population genetic differentiation between the CA sample and TX sample for any gene (Table 5). Nevertheless, some aspects of the data suggest that these two populations are heterogeneous. For example, the TX population sample shows greater nucleotide heterozygosity, a greater number of haplotypes, and lower LD than does the combined CA sample for all three genes. Unlike the CA sample, none of the ZnS values from the TX sample are significantly different from simulated neutral data (Table 6). Furthermore, the TX sample contains a total of 46 private mutations relative to the CA sample, while the CA sample contains no unique mutations relative to the TX sample (in data deleted of singletons). In other words, the CA variation is a subset of the TX variation at each gene, and LD values in the TX sample do not unambiguously reject neutrality. Data from additional loci will be required to determine whether these apparent differences between North American populations are locus specific (or immunity specific) or more genomic in nature.
The ZIM population sample and North American population samples show significant genetic differentiation (Table 5). The ZIM population sample also has greater nucleotide heterozygosity, a greater number of haplotypes, and lower LD than the North American population samples (Table 6). While the ZIM sample contains a total of 48 private mutations relative to the North American population samples, the North American samples contain only 4 private mutations relative to the ZIM sample (in data deleted of singletons). This is consistent with other data suggesting that non-African variation is generally a subset of African variation in D. simulans (Irvin et al. 1998; Andolfatto 2001; see supplementary Figure 1 at http://www.genetics.org/supplemental/). Hmu, Sr-CI, and Tehao ZnS values from the ZIM population sample are comparable to those from the two nonimmunity genes G6pd and vermilion (Hamblin and Veuille 1999) and provide scant evidence for recent positive selection in these immunity genes in Africa.
DISCUSSION
Previous examples of significantly unusual haplotype configurations from Drosophila population samples, in which data from nearby loci from the same population sample help rule out demographic explanations, have shown one haplotype at intermediate to high frequency along with several low-frequency haplotypes (Hudson et al. 1997; Quesada et al. 2003; Schlenke and Begun 2004). The interpretation of these data has been that they reflect a strong, recent selective event that pushed one haplotype to high frequency, while the remainder of the sample captures a subset of the ancestral variation at the locus. Although the TX D. simulans sample shows such a pattern for Hmu, Sr-CI, and Tehao, the CA sample clearly deviates from these observations in that each gene is essentially composed of two invariant haplotypes. The two divergent haplotypes result in a highly significant excess of LD among the polymorphic sites in the CA sample even when compared to data simulated without recombination. The extraordinarily high levels of LD at Hmu, Sr-CI, and Tehao are not likely the result of demographic effects because these three genes are strong outliers with respect to other genes sampled from the same lines, a pattern that cannot be easily explained by a simple population bottleneck.
Although a long-term balanced polymorphism (e.g., caused by overdominance) could maintain two divergent major allelic classes, intra-allelic variation is expected under such models, and the total amount of variation in the sample relative to divergence should be elevated (Ohta and Kimura 1970; Strobeck 1983; Kaplan et al. 1988). Neither is true of our data. Nevertheless, at Sr-CI/Sr-CIII and Tehao we tested for an excess of heterozygotes compared to Hardy-Weinberg expectations (Parsons and Bodmer 1961), which would be expected under an overdominance model. Assuming that adult flies would already have been subjected to natural selection, we assayed 43 wild-caught D. simulans males for the presence of the two CA1 major alleles using restriction enzymes that distinguished the two alleles. The observed frequencies of heterozygotes are nearly exactly those expected under Hardy-Weinberg equilibrium for both genes (Table 7), providing no evidence for the excess of heterozygotes predicted by an overdominance model.
TABLE 7.
Chi-square test for excess of heterozygotes
|
Sr-CI/Sr-CIII
|
Tehao
|
|||||
|---|---|---|---|---|---|---|
| Homozygote 1 | Heterozygote | Homozygote 2 | Homozygote 1 | Heterozygote | Homozygote 2 | |
| Observed | 14 | 21 | 7 | 32 | 11 | 0 |
| Expected | 14.3 | 20.4 | 7.3 | 32.7 | 9.6 | 0.7 |
| χ2P-value (1 d.f.) = 0.85 | χ2P-value (1 d.f.) = 0.34 | |||||
Two other types of natural selection models are qualitatively consistent with the CA data. First, a strongly selected mutant could recombine onto a second haplotype during its sojourn, dragging two haplotypes through the population to intermediate frequency. This seems unlikely to explain the data at all three loci, since it requires a very specific and presumably rare event—one crossover, rather than zero or two or more crossovers, between the selected site and the sampled regions. Furthermore, we would have to have failed to sample the expected invariant regions closely linked to the selected mutation in each case. Second, two selective sweeps could have driven two different haplotypes to intermediate frequency at each gene. These two sweeps could have occurred independently of each other—e.g., one partial sweep followed by a second partial sweep. Alternatively, negative frequency-dependent selection could have driven one haplotype to high frequency, until one of the few remaining haplotypes became favored and started to overtake the high-frequency haplotype.
Interestingly, the more frequent haplotype at each gene in the pooled CA sample also occurs at intermediate to high frequency in the TX population sample, but is absent or at low frequency in the African sample (see supplementary Figure 1 at http://www.genetics.org/supplemental/). These data suggest that the CA and TX population share some selective history, despite the differences in overall levels of LD between the CA and TX population samples. Although some proportion of the singletons found in Hmu, Sr-CI, and Tehao in the CA2 and TX samples are likely PCR artifacts (see materials and methods), some of them may be novel mutations that have occurred since the inferred selective sweeps associated with these haplotypes. It is also clear that the nature of selection associated with Hmu, Sr-CI, and Tehao in the CA samples, and to a lesser extent in the TX sample, has not occurred in the ZIM sample, as haplotypes from the CA1 sample either do not occur or occur at low frequency in the ZIM sample (see supplementary Figure 1 at http://www.genetics.org/supplemental/). Thus, the selected mutations should be absent or occur at low frequency in the ZIM population, but occur at intermediate to high frequency in the CA1 population. Several mutations, including nonsynonymous mutations in each of the three genes (see supplementary Table 3 at http://www.genetics.org/supplemental/), fit this criterion and are plausible candidates for future immunity phenotype experiments.
The consistent decline of LD with increasing physical distance from Hmu, Sr-CI, Sr-CIII, and Tehao suggests that these genes themselves are the likely targets of natural selection. Although these three loci are implicated in the Drosophila immune response (see Introduction), they are not known to play roles in the two major humoral immune response pathways (Hoffmann 2003). Instead, they may function in the less well-characterized cellular immune response (Lavine and Strand 2002), in interactions between the cellular and humoral responses (Elrod-Erickson et al. 2000), or in localized tissue-specific immune responses (Ferrandon et al. 1998; Tzou et al. 2000). Other data exist to support the idea that positive selection (and, in particular, pathogen-mediated selection) may play an important role in the evolution of these genes. In D. melanogaster, naturally occurring genetic variation within Sr-CIII and, to a lesser extent, within Sr-CI and Tehao predicts success in host clearance of the gram-negative entomopathogen Serratia marcescens (Lazzaro et al. 2004). Tehao also shows a significant excess of nonsynonymous fixations along the D. simulans lineage (Schlenke and Begun 2003). Furthermore, D. simulans Hmu shows one of the highest levels of intraspecific variation in gene expression (relative to interspecific variation) in the species, which was interpreted as evidence that positive selection has influenced Hmu expression (Nuzhdin et al. 2004).
If our hypothesis that the major differences between ZIM and North American (especially CA) populations at Hmu, Sr-CI/Sr-CIII, and Tehao result from selection is correct, our data suggest that Hmu, Sr-CI/Sr-CIII, and Tehao could be important for adaptation of D. simulans to a novel non-African microbial environment. Given that D. simulans and its sister species D. melanogaster are sympatric and have similar demographic histories (Lachaise et al. 1988), we decided to investigate the distribution of polymorphism in Hmu, Sr-CI/Sr-CIII, and Tehao from a California D. melanogaster population sample as well. We collected DNA sequence data from eight highly inbred D. melanogaster lines made from field-caught inseminated females collected in the Wolfskill Orchard, Winters, California (GenBank accession nos. AY864355, AY864356, AY864357, AY864358, AY864359, AY864360, AY864361, AY864362, AY864363, AY864364, AY864365, AY864366, AY864367, AY864368, AY864369, AY864370, AY864371, AY864372, AY864373, AY864374, AY864375, AY864376, AY864377, AY864378 and AY870440, AY870441, AY870442, AY870443, AY870444, AY870445, AY870446, AY870447). Little haplotype structure was observed at Hmu, Sr-CI/Sr-CIII, and Tehao in these lines (see supplementary Figure 3 at http://www.genetics.org/supplemental/), and LD values were nonsignificant (Table 8). Thus, strong evidence for recent selective sweeps at Hmu, Sr-CI/Sr-CIII, and Tehao in California populations of Drosophila is species specific. These and our previously reported results (Schlenke and Begun 2003) support the idea that natural selection has been a more important determinant of recent immune system evolution in D. simulans than in D. melanogaster.
TABLE 8.
LD in CaliforniaD. melanogaster
| Gene | Location | N | Sites | S | ZnS | P-value |
|---|---|---|---|---|---|---|
| Hmu | 97F | 8 | 1906 | 23 | 0.258 | 0.822 |
| Sr-CI | 24D | 8 | 2527 | 55 | 0.289 | 0.749 |
| Tehao | 34B | 8 | 2452 | 47 | 0.422 | 0.372 |
While much recent effort has focused on using regional dips in polymorphism to detect chromosomal regions that underwent recent selective sweeps (Harr et al. 2002; Kim and Stephan 2002), it is interesting to note that this approach would not have singled out the Hmu, Sr-CI/Sr-CIII, and Tehao loci. These loci appear to have retained much of their heterozygosity because two divergent haplotypes at each locus were both recently elevated to intermediate frequencies. LD can be more sensitive than other polymorphism descriptors for localizing recent selective sweeps (Saunders et al. 2002; Schlenke and Begun 2004) and should be incorporated into models designed to scan genomes for such occurrences (Sabeti et al. 2002; Kim and Nielsen 2004).
Acknowledgments
We thank two anonymous reviewers for helpful comments. T.A.S. is supported by a National Institutes of Health postdoctoral fellowship and the Institute of Drosophila Immunomics. D.J.B. is supported by the National Institutes of Health and the National Science Foundation.
References
- Andolfatto, P., 2001. Contrasting patterns of X-linked and autosomal nucleotide variation in Drosophila melanogaster and Drosophila simulans. Mol. Biol. Evol. 18: 279–290. [DOI] [PubMed] [Google Scholar]
- Andolfatto, P., and M. Przeworski, 2000. A genome-wide departure from the standard neutral model in natural populations of Drosophila. Genetics 156: 257–268. [DOI] [PMC free article] [PubMed] [Google Scholar]
- Begun, D. J., and C. F. Aquadro, 1994. Evolutionary inferences from DNA variation at the 6-phosphogluconate dehydrogenase locus in natural populations of Drosophila: selection and geographic differentiation. Genetics 136: 155–171. [DOI] [PMC free article] [PubMed] [Google Scholar]
- Begun, D. J., and C. F. Aquadro, 1995. Molecular variation at the vermilion locus in geographically diverse populations of Drosophila melanogaster and D. simulans. Genetics 140: 1019–1032. [DOI] [PMC free article] [PubMed] [Google Scholar]
- Begun, D. J., and P. Whitley, 2000. Reduced X-linked nucleotide polymorphism in Drosophila simulans. Proc. Natl. Acad. Sci. USA 97: 5960–5965. [DOI] [PMC free article] [PubMed] [Google Scholar]
- Begun, D. J., S. N. Boyer and C. F. Aquadro, 1994. Cut locus variation in natural populations of Drosophila. Mol. Biol. Evol. 11: 806–809. [DOI] [PubMed] [Google Scholar]
- Comeron, J. M., M. Kreitman and M. Aguade, 1999. Natural selection on synonymous sites is correlated with gene length and recombination in Drosophila. Genetics 151: 239–249. [DOI] [PMC free article] [PubMed] [Google Scholar]
- Eanes, W. F., M. Kirchner, J. Yoon, C. H. Biermann, I. N. Wang et al., 1996. Historical selection, amino acid polymorphism and lineage-specific divergence at the G6pd locus in Drosophila melanogaster and D. simulans. Genetics 144: 1027–1041. [DOI] [PMC free article] [PubMed] [Google Scholar]
- Elrod-Erickson, M., S. Mishra and D. Schneider, 2000. Interactions between the cellular and humoral immune responses in Drosophila. Curr. Biol. 10: 781–784. [DOI] [PubMed] [Google Scholar]
- Ferrandon, D., A. C. Jung, M. Criqui, B. Lemaitre, S. Uttenweiler-Joseph et al., 1998. A drosomycin-GFP reporter transgene reveals a local immune response in Drosophila that is not dependent on the Toll pathway. EMBO J. 17: 1217–1227. [DOI] [PMC free article] [PubMed] [Google Scholar]
- Glinka, S., L. Ometto, S. Mousset, W. Stephan and D. De Lorenzo, 2003. Demography and natural selection have shaped genetic variation in Drosophila melanogaster: a multi-locus approach. Genetics 165: 1269–1278. [DOI] [PMC free article] [PubMed] [Google Scholar]
- Hamblin, M. T., and M. Veuille, 1999. Population structure among African and derived populations of Drosophila simulans: evidence for ancient subdivision and recent admixture. Genetics 153: 305–317. [DOI] [PMC free article] [PubMed] [Google Scholar]
- Harr, B., M. Kauer and C. Schlotterer, 2002. Hitchhiking mapping: a population-based fine-mapping strategy for adaptive mutations in Drosophila melanogaster. Proc. Natl. Acad. Sci. USA 99: 12949–12954. [DOI] [PMC free article] [PubMed] [Google Scholar]
- Hasson, E., I. N. Wang, L. W. Zeng, M. Kreitman and W. F. Eanes, 1998. Nucleotide variation in the triosephosphate isomerase (Tpi) locus of Drosophila melanogaster and Drosophila simulans. Mol. Biol. Evol. 15: 756–769. [DOI] [PubMed] [Google Scholar]
- Hoffmann, J. A., 2003. The immune response of Drosophila. Nature 426: 33–38. [DOI] [PubMed] [Google Scholar]
- Hudson, R. R., 2000. A new statistic for detecting genetic differentiation. Genetics 155: 2011–2014. [DOI] [PMC free article] [PubMed] [Google Scholar]
- Hudson, R. R., 2002. Generating samples under a Wright-Fisher neutral model of genetic variation. Bioinformatics 18: 337–338. [DOI] [PubMed] [Google Scholar]
- Hudson, R. R., D. D. Boos and N. L. Kaplan, 1992. A statistical test for detecting geographic subdivision. Mol. Biol. Evol. 9: 138–151. [DOI] [PubMed] [Google Scholar]
- Hudson, R. R., A. G. Saez and F. J. Ayala, 1997. DNA variation at the Sod locus of Drosophila melanogaster: an unfolding story of natural selection. Proc. Natl. Acad. Sci. USA 94: 7725–7729. [DOI] [PMC free article] [PubMed] [Google Scholar]
- Irvin, S. D., K. A. Wetterstrand, C. M. Hutter and C. F. Aquadro, 1998. Genetic variation and differentiation at microsatellite loci in Drosophila simulans. Evidence for founder effects in new world populations. Genetics 150: 777–790. [DOI] [PMC free article] [PubMed] [Google Scholar]
- Kaplan, N. L., T. Darden and R. R. Hudson, 1988. The coalescent process in models with selection. Genetics 120: 819–829. [DOI] [PMC free article] [PubMed] [Google Scholar]
- Kelly, J. K., 1997. A test of neutrality based on interlocus associations. Genetics 146: 1197–1206. [DOI] [PMC free article] [PubMed] [Google Scholar]
- Keohavong, P., and W. G. Thilly, 1989. Fidelity of DNA polymerases in DNA amplification. Proc. Natl. Acad. Sci. USA 86: 9253–9257. [DOI] [PMC free article] [PubMed] [Google Scholar]
- Kim, Y., and R. Nielsen, 2004. Linkage disequilibrium as a signature of selective sweeps. Genetics 167: 1513–1524. [DOI] [PMC free article] [PubMed] [Google Scholar]
- Kim, Y., and W. Stephan, 2002. Detecting a local signature of genetic hitchhiking along a recombining chromosome. Genetics 160: 765–777. [DOI] [PMC free article] [PubMed] [Google Scholar]
- Kimbrell, D. A., and B. Beutler, 2001. The evolution and genetics of innate immunity. Nat. Rev. Genet. 2: 256–267. [DOI] [PubMed] [Google Scholar]
- Labate, J. A., C. H. Biermann and W. F. Eanes, 1999. Nucleotide variation at the runt locus in Drosophila melanogaster and Drosophila simulans. Mol. Biol. Evol. 16: 724–731. [DOI] [PubMed] [Google Scholar]
- Lachaise, D., M. L. Cariou, J. R. David, F. Lemeunier, L. Tsacas et al., 1988. Historical biogeography of the Drosophila melanogaster species subgroup. Evol. Biol. 22: 159–225. [Google Scholar]
- Lavine, M. D., and M. R. Strand, 2002. Insect hemocytes and their role in immunity. Insect Biochem. Mol. Biol. 32: 1295–1309. [DOI] [PubMed] [Google Scholar]
- Lazzaro, B. P., B. K. Sceurman and A. G. Clark, 2004. Genetic basis of natural variation in D. melanogaster antibacterial immunity. Science 303: 1873–1876. [DOI] [PubMed] [Google Scholar]
- Luo, C., B. Shen, J. L. Manley and L. Zheng, 2001. Tehao functions in the Toll pathway in Drosophila melanogaster: possible roles in development and innate immunity. Insect Mol. Biol. 10: 457–464. [DOI] [PubMed] [Google Scholar]
- Nuzhdin, S. V., M. L. Wayne, K. L. Harmon and L. M. McIntyre, 2004. Common pattern of evolution of gene expression level and protein sequence in Drosophila. Mol. Biol. Evol. 21: 1308–1317. [DOI] [PubMed] [Google Scholar]
- Ohashi, J., I. Naka, J. Patarapotikul, H. Hananantachai, G. Brittenham et al., 2004. Extended linkage disequilibrium surrounding the hemoglobin E variant due to malarial selection. Am. J. Hum. Genet. 74: 1198–1208. [DOI] [PMC free article] [PubMed] [Google Scholar]
- Ohnishi, S., and R. A. Voelker, 1979. Comparative studies of allozyme loci in Drosophila simulans and D. melanogaster. 2. Gene arrangement on the 3rd chromosome. Jpn. J. Genet. 54: 203–209. [DOI] [PubMed] [Google Scholar]
- Ohta, T., and M. Kimura, 1970. Development of associative overdominance through linkage disequilibrium in finite populations. Genet. Res. 16: 165–177. [DOI] [PubMed] [Google Scholar]
- Parsons, P. A., and W. F. Bodmer, 1961. The evolution of overdominance: natural selection and heterozygote advantage. Nature 190: 7–12. [DOI] [PubMed] [Google Scholar]
- Pearson, A., A. Lux and M. Krieger, 1995. Expression cloning of dSR-CI, a class C macrophage-specific scavenger receptor from Drosophila melanogaster. Proc. Natl. Acad. Sci. USA 92: 4056–4060. [DOI] [PMC free article] [PubMed] [Google Scholar]
- Przeworski, M., 2002. The signature of positive selection at randomly chosen loci. Genetics 160: 1179–1189. [DOI] [PMC free article] [PubMed] [Google Scholar]
- Przeworski, M., J. D. Wall and P. Andolfatto, 2001. Recombination and the frequency spectrum in Drosophila melanogaster and Drosophila simulans. Mol. Biol. Evol. 18: 291–298. [DOI] [PubMed] [Google Scholar]
- Quesada, H., U. E. Ramirez, J. Rozas and M. Aguade, 2003. Large-scale adaptive hitchhiking upon high recombination in Drosophila simulans. Genetics 165: 895–900. [DOI] [PMC free article] [PubMed] [Google Scholar]
- Ramet, M., A. Pearson, P. Manfruelli, X. Li, H. Koziel et al., 2001. Drosophila scavenger receptor CI is a pattern recognition receptor for bacteria. Immunity 15: 1027–1038. [DOI] [PubMed] [Google Scholar]
- Rozas, J., J. C. Sanchez-DelBarrio, X. Messeguer and R. Rozas, 2003. DnaSP, DNA polymorphism analyses by the coalescent and other methods. Bioinformatics 19: 2496–2497. [DOI] [PubMed] [Google Scholar]
- Sabeti, P. C., D. E. Reich, J. M. Higgins, H. Z. Levine, D. J. Richter et al., 2002. Detecting recent positive selection in the human genome from haplotype structure. Nature 419: 832–837. [DOI] [PubMed] [Google Scholar]
- Saunders, M. A., M. F. Hammer and M. W. Nachman, 2002. Nucleotide variability at G6pd and the signature of malarial selection in humans. Genetics 162: 1849–1861. [DOI] [PMC free article] [PubMed] [Google Scholar]
- Schlenke, T. A., and D. J. Begun, 2003. Natural selection drives Drosophila immune system evolution. Genetics 164: 1471–1480. [DOI] [PMC free article] [PubMed] [Google Scholar]
- Schlenke, T. A., and D. J. Begun, 2004. Strong selective sweep associated with a transposon insertion in Drosophila simulans. Proc. Natl. Acad. Sci. USA 101: 1626–1631. [DOI] [PMC free article] [PubMed] [Google Scholar]
- Strobeck, C., 1983. Expected linkage disequilibrium for a neutral locus linked to a chromosomal arrangement. Genetics 103: 545–555. [DOI] [PMC free article] [PubMed] [Google Scholar]
- Tauszig, S., E. Jouanguy, J. A. Hoffmann and J. L. Imler, 2000. Toll-related receptors and the control of antimicrobial peptide expression in Drosophila. Proc. Natl. Acad. Sci. USA 97: 10520–10525. [DOI] [PMC free article] [PubMed] [Google Scholar]
- Theopold, U., C. Samakovlis, H. Erdjument-Bromage, N. Dillon, B. Axelsson et al., 1996. Helix pomatia lectin, an inducer of Drosophila immune response, binds to hemomucin, a novel surface mucin. J. Biol. Chem. 271: 12708–12715. [DOI] [PubMed] [Google Scholar]
- True, J. R., J. M. Mercer and C. C. Laurie, 1996. Differences in crossover frequency and distribution among three sibling species of Drosophila. Genetics 142: 507–523. [DOI] [PMC free article] [PubMed] [Google Scholar]
- Tzou, P., S. Ohresser, D. Ferrandon, M. Capovilla, J. M. Reichhart et al., 2000. Tissue-specific inducible expression of antimicrobial peptide genes in Drosophila surface epithelia. Immunity 13: 737–748. [DOI] [PubMed] [Google Scholar]
- Wall, J. D., P. Andolfatto and M. Przeworski, 2002. Testing models of selection and demography in Drosophila simulans. Genetics 162: 203–216. [DOI] [PMC free article] [PubMed] [Google Scholar]
- Workman, P. L., and J. D. Niswander, 1970. Population studies on southwestern Indian tribes. II. Local genetic differentiation in the Papago. Am. J. Hum. Genet. 22: 24–49. [PMC free article] [PubMed] [Google Scholar]