

Abstract
Much research has been devoted to understanding the biology of plant-pathogen interactions. The extensive genetic analysis of disease resistance in rice, coupled with the sequenced genome and genomic resources, provides the opportunity to seek convergent evidence implicating specific chromosomal segments and genes in the control of resistance. Published data on quantitative and qualitative disease resistance in rice were synthesized to evaluate the distributions of and associations among resistance loci. Quantitative trait loci (QTL) for resistance to multiple diseases and qualitative resistance loci (R genes) were clustered in the rice genome. R genes and their analogs of the nucleotide binding site–leucine-rich repeat class and genes identified on the basis of differential representation in disease-related EST libraries were significantly associated with QTL. Chromosomal segments associated with broad-spectrum quantitative disease resistance (BS-QDR) were identified. These segments contained numerous positional candidate genes identified on the basis of a range of criteria, and groups of genes belonging to two defense-associated biochemical pathways were found to underlie one BS-QDR region. Genetic dissection of disease QTL confidence intervals is needed to reduce the number of positional candidate genes for further functional analysis. This study provides a framework for future investigations of disease resistance in rice and related crop species.
DESPITE the importance of quantitative disease resistance (QDR) in plants, relatively little is known about the genetic basis of this trait or the mechanism of action of the genes controlling it. Insights into QDR have implications both for understanding host-pathogen interactions and for improving crop production. In recent years, much has been learned about the genes and pathways involved in the plant defense response, and many studies have been done to identify chromosomal regions conditioning QDR (quantitative trait loci for disease, or disease QTL). This information, coupled with the availability of the nearly full genomic sequence of rice, provides an opportunity to make inferences about QDR and to establish testable hypotheses for subsequent analysis. Given the synteny among genomes in the grass family, which includes rice, wheat, barley, maize, sorghum, and the millets, positional candidates identified in rice may have utility in other cereal species.
An examination of the colocalization and distribution of QTL identified from multiple studies on a given disease and from a number of different diseases can shed light on a series of unresolved issues relating to QDR. The association of qualitative resistance (R) genes or major genes, resistance gene analogs (RGAs), and QTL has been widely noted (Wang et al. 1994; Pflieger et al. 1999; Gebhardt and Valkonen 2001; Quint et al. 2003), but the current status of their coincidence in rice has not been systematically analyzed. Furthermore, the significance of their colocalization has not been inspected statistically in any plant genome. Both positive and negative associations would be of potential interest; QTL not associated with R genes or RGAs are likely to be explained by other resistance mechanisms. Another issue is the extent to which a given QTL is detected across studies for a given disease. The extent of repeated QTL detection would reflect both the distribution (frequency in germplasm) and robustness (QTL × environment interactions) of the QTL.
The existence of broad-spectrum resistance (BSR) is another issue for which a QTL summary could be illuminating. The concept of BSR can be used to refer to resistance to multiple strains of a pathogen or to multiple taxa. A number of types of evidence suggest that BSR exists in plants. First, correlated resistances have been documented in some monocot and dicot germplasm (e.g., Tapsoba et al. 1997; Fokunang et al. 2000). Second, in both monocots and dicots, local infection by one pathogen or treatment with certain elicitors results in quantitative resistance to diverse pathogens, a phenomenon known as systemic acquired resistance (SAR; for review, see Sticher et al. 1997). Several investigations have identified genes contributing to SAR, including NPR1, the TGA subclass of basic leucine-zipper transcription factor genes, and certain pathogenesis-related (PR) genes (Cao et al. 1998; Mou et al. 2003). Third, induced mutants and transgenic plants that exhibit enhanced resistance to multiple pathogens have been documented (Yin et al. 2000; Kachroo et al. 2003). With respect to qualitative variation, major genes conditioning resistance to multiple pathotypes of Blumeria graminis f. sp. hordei (mlo, Jørgensen and Mortensen 1977) and Magnoporthe grisea (Pi genes, Liu et al. 2002; Jeon et al. 2003) have been reported. These data suggest that allelic variation in the plant defense machinery can provide BSR. We hypothesized that a synthesis of QTL and genomic data would provide evidence regarding the existence of broad-spectrum quantitative disease resistance (BS-QDR), allow identification of specific genomic regions that can be useful in crop improvement, and permit the identification of genes potentially contributing to BS-QDR.
Cloning of genes controlling quantitative traits is now a major research frontier (reviewed in Glazier et al. 2002) in terms of understanding human disease (e.g., Katzov et al. 2004), livestock productivity (e.g., Grisart et al. 2004), and traits of agronomic importance in crops (e.g., Ishimaru et al. 2004). Once genes conditioning QTL are identified for crop plants, natural variation can be better characterized and exploited. Identification of positional candidate genes is a step toward isolation of the genetic factors controlling quantitative traits (Pflieger et al. 2001; Remington and Purugganan 2003). Much effort has thus been made to identify positional candidates for a number of traits, including QDR (Wang et al. 2001; Ramalingam et al. 2003; Wen et al. 2003). For practical purposes, positional candidates for QDR may be considered as all putative genes underlying a small QTL region, or defense-related genes in a broad QTL region. The current status of most QTL maps requires the latter designation for positional candidates.
A large number of defense-related genes have been identified on the basis of a range of criteria, including expression profiling (e.g., Maleck et al. 2000; Ramonell and Somerville 2002) and analysis of natural and induced variation (Stuiver and Custers 2001). R genes and defense-associated transcription factors are attractive classes of candidate genes for investigation of QDR. RGAs of the nucleotide-binding site–leucine-rich repeat (NBS-LRR) class are putatively involved in pathogen recognition and in relaying a signal that can lead to the onset of the defense response. R genes were hypothesized as candidates conditioning QDR in plants (Lefebvre and Chèvre 1995), and RGAs have been shown in some instances to colocalize with disease QTL (Pflieger et al. 1999; Quint et al. 2003). Doebley (1993) hypothesized a role for transcription factors in conditioning quantitative variation, and transcription factors explaining QTL have been isolated in recent years (for review, see Remington and Purugganan 2003). Furthermore, in both monocots and dicots, certain transcription factors have been shown to function in the plant defense response (e.g., Fan and Dong 2002; Dong et al. 2003), but evidence for their association with QDR is lacking. A property common to both RGAs and defense-associated transcription factors is that they belong to large and complex gene families. A systematic analysis of positional correspondences among R genes, RGAs, and gene families in relation to disease QTL may reveal whether QTL can be ascribed to genic patterns.
Genes implicated in defense often show altered expression in response to pathogen challenge. Systematically relating pathogen-affected expression patterns to mapped transcription units under disease QTL could also provide preliminary sets of candidate genes for QTL. Genes showing differences in transcript abundance among EST libraries derived from noninoculated leaf tissues vs. inoculated compatible, incompatible, and partially resistant leaf tissue were identified and located on an integrated disease-QTL map of rice. This was combined with the other lines of evidence indicated above, in an effort to identify specific chromosomal segments, genes, and gene families associated with plant defense.
MATERIALS AND METHODS
Integrated map of quantitative and qualitative resistance loci and lesion mimic mutant genes:
We summarized the published data for QTL identified in rice for fungal, bacterial, and viral pathogens. Additional rice blast QTL data were provided by B. Liu, S. Zhang, X. Zhu, Q. Yang, S. Wu et al. (unpublished data; H. Leung, personal communication). A total of 16 studies were used, involving progenies from 11 different crosses (Table 1). No more than three publications used progenies derived from any single cross. QTL were detected for four different pathogens: eight studies were of rice blast, caused by Magnaporthe grisea; four studies were of sheath blight, caused by Rhizoctonia solani; two studies were of rice yellow mottle virus (RYMV); one study was of sheath rot, caused by Sarocladium oryzae; and one study was of bacterial leaf blight, caused by Xanthomonas oryzae pv. oryzae.
TABLE 1.
QTL studies used for the development of an integrated disease-QTL map of rice
| Diseasea | Population | No. QTL | Reference |
|---|---|---|---|
| BB | Lemont/Teqing | 11 | Li et al. (1999) |
| Bl | CO39/Moroberekan | 10 | Wang et al. (1994) |
| Bl | CT9993/KDML105 | 4 | Sirithunya et al. (2002) |
| Bl | Kahei/Koshihikari | 3 | Miyamoto et al. (2001) |
| Bl | Lemont/Teqing | 9 | Tabien et al. (2002) |
| Bl | Nipponbare/Owarihatamochi | 4 | Fukuoka and Okuno (2001) |
| Bl | Norin 29/Chubu 32 | 1 | Zenbayashi et al. (2002) |
| Bl | SHZ-2/Lijiangxin-tuan-heigu | 4 | Liu et al.b |
| Bl | Zhenshan 97B/Minghui 63 | 12 | Chen et al. (2003) |
| RYMV | IR64/Azucena | 7 | Albar et al. (1998) |
| RYMV | IR64/Azucena | 1 | Ghesquière et al. (1997) |
| ShB | Jasmine 85/Lemont | 6 | Zou et al. (2000) |
| ShB | Lemont/Teqing | 6 | Li et al. (1995) |
| ShB | Zhenshan 97B/Minghui 63 | 3 | Han et al. (2002) |
| ShB | ZYQ8/JX17 | 4 | Kunihiro et al. (2002) |
| ShR | CO39/Moroberekan | 9 | Srinivasachary et al. (2002) |
Disease abbreviations are BB, bacterial blight; Bl, rice blast; RYMV, rice yellow mottle virus; ShB, sheath blight; and ShR, sheath rot.
B. Liu, S. Zhang, X. Zhu, Q. Yang, S. Wu et al. (unpublished data; H. Leung, personal communication).
Marker data from the above studies were integrated in silico onto the latest version of the high-density molecular linkage map published by the Japanese Rice Genome Project (“JRGP 2000,” Harushima et al. 1998; http://rgp.dna.affrc.go.jp/publicdata/geneticmap2000/index.html). This was possible because the genetic map is linked to the rice physical map. GenomePixelizer (Kozik et al. 2002) was used to visualize QTL and other map-related data, and the output was modified for presentation in QuarkXPress v. 5.0.
To construct the integrated disease-QTL map, available marker sequences were obtained from GenBank. Gapped-BLAST (Altschul et al. 1997) was used to search against all BAC and P1-derived artificial chromosome (PAC) sequences that constituted the rice minimum genome tiling path (as of May 2003) constructed by the International Rice Genome Sequencing Project (IRGSP; http://rgp.dna.affrc.go.jp/cgi-bin/statusdb/irgsp-status.cgi). For most marker sequences, MEGABLAST could be used to find the most significant match. However, for sequences of short length or lower quality or sequences derived from other species or subspecies, BLASTn was used with the default search parameters. For some sequences, information on the location and order of nearby markers reported in the respective publication was used to validate their chromosomal location.
All of the data were integrated onto the JRGP 2000 genetic map, occasionally with difficulty. Some marker sequences were not available from GenBank. In some cases, these had been mapped genetically and their position on the JRGP 2000 genetic map was reported in the Gramene database (Ware et al. 2002). For a very few markers, their location was estimated as the midpoint of the genetic location of the two nearest flanking markers (as identified from other maps available in Gramene). Still, not every identified QTL could be placed onto the JRGP 2000 map.
Identical QTL intervals detected from nonindependent experiments (e.g., one population analyzed in multiple years) were reported as a single QTL. Similarly, colocalizing QTL identified in a single study for different disease parameters were represented as one QTL. QTL detected in a single study and for the same trait that were offset but overlapped by at least one marker were concatenated.
The map locations of genes conditioning qualitative resistance to rice blast and bacterial leaf blight (“major genes” or R genes) were estimated by identifying the nearest marker reported in each publication (Causse et al. 1994; Wang et al. 1994; Li et al. 1999; Liu et al. 2002; Jeon et al. 2003; Sallaud et al. 2003) or were based on the reported position in the Gramene database (October, 2003). For intervals defined in Gramene or elsewhere, the midpoint of the interval was used to estimate gene location. The map locations for loci conditioning lesion mimic phenotypes were also based on those reported in Gramene, except for spl10 and spl11, which were inferred from the studies by Yoshimura et al. (1997) and Zeng et al. (2002), respectively. Because most of these loci were defined by large confidence intervals, a bar rather than the midpoint was used to display their map position.
Resistance gene analogs:
In a separate analysis (Monosi et al. 2004), two in silico search strategies were used to identify NBS-LRR RGAs. In the first approach, tBLASTn searches were performed initially with six distantly related NBS-LRR sequences and later with variants found during the initial search, against the rice genomic sequence assembled by the Rice Genome Project Consortium. In the second approach, a hidden Markov model (HMM) search was performed using the nucleotide binding adaptor shared by APAF-1, certain R proteins, and CED-4 (NB-ARC) Pfam HMM (PF00931) against all predicted rice proteins in the TIGR database. The tBLASTn searches identified BAC or PAC sequences containing NBS-LRR-like sequences, which were analyzed with GENSCAN (Burge and Karlin 1997) and FGENESH (Salamov and Solovyev 2001) to predict open reading frames. Further searches against rice expressed sequence tags (ESTs) in GenBank and the full-length (FL)-cDNAs (Kikuchi et al. 2003) were performed to identify additional resistance gene analogs and to assist in gene prediction. The RGAs identified were grouped into six classes according to the presence/absence and conservation of protein sequence motifs (classes 2–7, data not shown). The RGAs were positioned on the JRGP 2000 genetic map via the physical map.
Candidate gene families:
Rice FL-cDNAs had been previously compared with the catalog of domains in the InterPro database (Kikuchi et al. 2003; Mulder et al. 2003). Two surveys were employed with regard to the number of FL-cDNAs harboring putative domains and residing in the QTL and non-QTL genomic fractions. One survey comprised a select set of candidate gene families, and the other was a post hoc analysis of rice gene families.
We surveyed the defense literature to identify putative regulators of plant defense. The selected genes identified included the following transcription factor gene families: WRKY (Dong et al. 2003), MYB (Vailleau et al. 2002), ethylene response factor (ERF, Oñate-Sanchez and Singh 2002), and basic leucine zipper (bZIP, Jakoby et al. 2002). NPR1 was also identified as an important defense-associated candidate gene (Cao et al. 1998). This is a gene encoding an ankyrin-repeat-containing protein that is a key regulator of systemic acquired resistance. The rice FL-cDNAs harboring domains in the InterPro database corresponding to the above gene families were identified: WRKY (Interpro identification no. IPR003657), bZIP (IPR004827), MYB (IPR001005), AP2 and ERF (IPR001471 and IPR004403), and Ankyrin (IPR002110). Nonredundant FL-cDNA representative members of these gene families were located on the JRGP 2000 genetic map.
The FL-cDNAs had been assigned to clusters by the rice FL-cDNA consortium (Kikuchi et al. 2003). The following analysis was conducted using the nonredundant catalog of FL-cDNAs, represented by the longest (base pairs) cDNA from each cluster (n = 21,446), harboring at least one domain in the InterPro database (n = 17,155). The number of FL-cDNAs carrying a common domain was quantified in the QTL and non-QTL genomic fractions. Positions for the cDNAs were based on the JRGP 2000 centimorgan values assigned to the BAC or PAC accessions associated with each cDNA. In both surveys, the average centimorgan value was used for genetic distances reported as intervals, as was done for the integrated disease-QTL map.
Digital Northern analysis:
In August 2003, a MySQL database was generated for publicly available ESTs (http://www.ncbi.nlm.nih.gov/dbEST/). Because this study is part of a larger comparative effort, the database was designed to include EST sequences derived from domesticated rice, barley, wheat, sorghum, and maize (n ≈ 1.3 million ESTs). A coding system was devised on the basis of the GenBank descriptors, which were extracted using a Perl script. These codes allowed grouping or partitioning of libraries on the basis of an interpretation of their descriptors (e.g., biotic stress, fungal pathogen, leaf tissue, etc.). In this study, comparisons between and among rice EST libraries were performed (Table 2). These libraries were not treated in any way (e.g., normalization) that would affect the random representation of ESTs in the libraries or in GenBank (G. Wang, personal communication).
TABLE 2.
Description ofOryza sativa EST libraries used for digital Northern analysis
| Cultivar | Tissue | Resistance interaction | GenBank accession for representative clone |
Counta |
|---|---|---|---|---|
| Nipponbare | Leaf | Compatible, 6 hr PI | CB641388 | 4177 |
| Nipponbare | Leaf | Compatible, 24 hr PI | CB651859 | 5777 |
| Nipponbare | Leaf | Incompatible, 6 hr PI | CB659757 | 4659 |
| Nipponbare | Leaf | Incompatible, 24 hr PI | CB668914 | 4998 |
| Nipponbare | Leaf | Partial, 24 hr PI | CB678643 | 5451 |
| Nipponbare | Leaf | None | CB686047 | 7172 |
PI, post-inoculation.
The number of unique EST clones representing the EST library.
To identify genes that showed significantly different frequencies across contrasting EST libraries, the following EST libraries were used for comparisons (see also Table 2): (1) a noninfected leaf tissue-derived library from the rice cv. Nipponbare and (2) five libraries derived from leaf tissues from Nipponbare during compatible, incompatible, and partial resistance interactions with M. grisea at 6 and/or 24 hr postinoculation. All of the EST sequences used in this analysis are freely available to the scientific community through the MGOS database (www.mgosdb.org).
Rice FL-cDNAs were used to perform gapped-BLAST searches against the cereal EST database described above. Matches resulting from BLASTn searches having a minimum of 100 bp high-scoring segment pairs with ≥95% identity and matching at least 50% of the length of the EST were used for further analyses. The ESTs in these libraries were represented as both 5′- and 3′-end sequences. Because 5′ and 3′ sequences were not uniformly represented, the numbers of EST clones, rather than the numbers of ESTs representing each clone, were used for the digital Northern analysis performed. These clones are referred to as ESTs throughout the text for simplicity. Gapped-BLAST matches for each FL-cDNA were summarized as the ratio of representative ESTs to the total number of ESTs per library and used to evaluate ratio differences between libraries (statistical methods below). As mentioned above, the entire set of cDNAs had been assigned to unique clusters. To reduce the number of independent tests performed, the BLAST result from the longest (base pairs) representative cDNA for each cDNA cluster, having at least five matching ESTs in any one of the libraries (n = 342), was used for statistical analysis. Rice FL-cDNAs associated with ESTs exhibiting significant differences in frequency were placed on the Nipponbare-derived, integrated disease-QTL map (Figure S1 at http://www.genetics.org/supplemental/). The map locations of these FL-cDNAs were determined in the same way as described for candidate gene families.
It should be noted that the FL-cDNAs represented a fraction (∼40%) of the total number of predicted genes and varied in representation along the rice chromosomes. For example, the range in the proportion of FL-cDNAs to predicted genes was 16–65% in four chromosomal segments examined (Table 3). Still, the latter was not used due to the potential inaccuracies in gene prediction algorithms, which may reduce the frequencies of gene-EST matches and therefore contribute to type II error. Furthermore, all of the ESTs were not represented by a corresponding FL-cDNA under the BLAST parameter criteria described above. Finally, the relationships of genes and EST libraries were evaluated on the basis of their digital Northern patterns using complete linkage hierarchical clustering (Euclidean distance) with the program Genesis (Sturn et al. 2002).
TABLE 3.
Description of selected chromosomal segments containing colocalizing QTL for multiple diseases
| Chr. (interval)a |
QTLb | QTL donor | Phenotypes | No. cDNAs (no. genes) |
Positional candidatesc |
|---|---|---|---|---|---|
| 3 | Bl | Moroberekan | spl3 | 296 | Glyceraldehyde-3-phosphate dehydrogenase |
| (1.1–15.2) | ShB | Teqing | (458) | [J013118G18]d | |
| BB | Lemont | Ubiquitin family protein [J023111G18]d | |||
| Lethal leaf-spot 1 [001-003-D01] | |||||
| Catalase 2 [J013060B21] | |||||
| Peroxidase [002-113-H03, J023075H05] | |||||
| Flavanone 3-hydroxylase [006-204-B12] | |||||
| Plant defensin [J023019E10] | |||||
| 8 | Bl | Moroberekan | Pi33 | 499 | LRR receptor-like protein kinase [J013065M07]e |
| (16.4–58.2) | Bl | Minghui 63 | Pi9(t) | (2143) | Wound-responsive family protein [J023052C20]e |
| Bl | Sanhuangzhan 2 | Pi11(t) | Photosystem II 10-kD polypeptide [J023063I15]e | ||
| ShR | Moroberekan | myb family transcription factor [J033071N16]d | |||
| ShB | Lemont | Uridylyltransferase related [J013155B11]d | |||
| BB | Teqing | Germin-like protein [001-026-B02, 001-108-B05, 006-204-C06, 006-204-G10, 006-205-B04] |
|||
| bZIP, ocs-element binding factor [002-121-A09] | |||||
| CC-NBS-LRR similar to RPM1 [J033077K04, J023106I20] | |||||
| 9 | Bl | Minghui 63 | 555 | AP2 domain protein RAP2.12 [001-038-B05]e | |
| (51.7–91.8) | Bl | Minghui 63 | (1083) | Aldehyde dehydrogenase [002-113-B08]e | |
| Bl | Zhenshan 97 | U2 snRNP auxiliary factor small subunit | |||
| ShB | Jasmine 85 | [J013025G09]e | |||
| ShB | Minghui 63 | Plasma membrane intrinsic protein [006-310-H08]e | |||
| ShB | Minghui 63 | Carbonic anhydrase family protein [J023022G09]d | |||
| BB | Teqing | Cytochrome P450 [J013099E24]d | |||
| RYMV | Azucena | Nodulin family protein [J023012O05]d | |||
| Ankyrin-like protein [J023122L09] WRKY [J013121C08, J013151N12, J013001K23] | |||||
| Putative AVR9 elicitor response protein [J013146K16] | |||||
| Blight-associated protein p12 [001-111-F08] | |||||
| CC-NBS-LRR similar to RPM1 [J033046D04] | |||||
| bZIP [J023043A12, J033108B13, J023110J21] | |||||
| Putative MYB4 [006-203-E04] | |||||
| 12 | Bl | Moroberekan | spl1 | 313 | No match [001-006-F10]e |
| (40.2–64.4) | Bl | Owarihatamochi | lrd21 | (1904) | RuBisCO small subunit [J013149A10]e |
| Bl | Teqing | Pita | Photosystem I reaction center subunit XI | ||
| ShB | Teqing | Pitq6 | [006-203-B01]e | ||
| BB | Teqing | Pi20 | DNAJ heat shock protein [J023062J10]d | ||
| RYMV | Azucena | Pi6(t) | Expressed protein [J013002M10]d | ||
| Pi12(t) | Pathogen-responsive α-dioxygenase [J023106K06]d | ||||
| Pi21(t) | CC-NBS-LRR similar to RPP8 [J023064J22] | ||||
| Pi31(t) Pi32(t) | CC-NBS-LRR similar to RPM1 [J033037L18, J013005L22, J023048O04, J033021G15] |
||||
| CC-NBS similar to RPP13 [J023026M23, 002-164-A12] | |||||
| Heat-shock protein 70 [J033107J07] Wound-induced basic protein [001-042-B08, J013098D06] Glutathione S-transferase [J033043B09] |
The chromosomal interval according to the JRGP 2000 centimorgan values.
QTL for disease resistance to BB, bacterial blight; Bl, rice blast; RYMV, rice yellow mottle virus; ShB, sheath blight; and ShR, sheath rot.
A subset of the numerous positional candidates to exemplify the diverse range of putative functions.
Positional candidates having a 5% false discovery rate of significant differential representation.
Positional candidates exhibiting significant differential representation after correcting for multiple tests by the Bonferroni procedure (α = 0.05).
Statistical analyses:
To assess the spatial distribution of QTL, R genes, and the two together, the JRGP 2000 genetic map was binned into 108 intervals of ∼14 cM, the average reported QTL length, and the QTL or R gene frequency data were calculated by bin. A QTL or R gene was assigned to a bin if its midpoint was in the bin or if the entire bin was covered by the locus. These data were used to perform the chi-square goodness-of-fit and Poisson dispersion tests (Grafen and Hails 2002). The former test was calculated using the following formula:
- H0: rice disease QTL data follow a Poisson distribution with an unspecified mean,
where ni is the number of observations in the ith category and Ei is the expected number of observations in the ith category, on the basis of a Poisson distribution. The Poisson dispersion test was calculated using the following formula:
- H0: rice disease QTL data follow a Poisson distribution, where the mean and variance are equal,
where n is the number of observations, S2 is the sample variance, and  is the sample mean.
The coefficient of dispersion (CD) was used to detect a type of spatial dispersion. A CD < 1 is indicative of an underdispersed (uniform) spatial distribution and a CD > 1 indicates an overdispersed (clumped) spatial distribution (Grafen and Hails 2002):
 |
Fisher's exact test was used to test for overrepresentation in the QTL genomic fraction of rice genes, R genes, RGAs, gene families, and “differentially expressed” genes. An expected distribution based on the total number of nonredundant FL-cDNAs or TIGR predicted genes in the QTL and non-QTL genomic fractions was used, except in the case when all rice genes were tested. In that case, the expected distribution was based on the assumption that if genes were randomly distributed, 54% of them would colocalize with disease QTL, as that was the percentage of genome coverage by QTL. The data were arranged as 2 × 2 contingency tables and Fisher's exact test was applied in Matlab v6.5.1 using the continex function developed by R. Strauss (http://www.biol.ttu.edu/Strauss/Matlab/Matlab.htm).
To determine the significance of differences in EST frequencies across multiple libraries, the general chi-square test was used to compare the ratio of representative ESTs for each gene in each library (Romualdi et al. 2001). The formula was applied using the program IDEG6 (Romualdi et al. 2003), correcting for multiple tests by the Bonferroni (α = 0.05) and false discovery rate (q* = 0.05; Benjamini and Hochberg 1995) methods.
RESULTS
Distribution of disease-resistance loci in the rice genome:
The distribution of chromosomal segments conditioning disease resistance in rice was analyzed, considering those identified as QTL, those recognized as major or qualitative genes (R genes), and both classes together. Rice disease QTL (n = 94) were found on each of the 12 chromosomes, covering ∼54% of the genetically defined genome, with an average QTL length of ∼14 cM (Figure 1). While neither QTL nor R genes were restricted to particular chromosomal regions, telomeric QTL were located on 8 of the 12 rice chromosomes. Peri- or trans-centromeric QTL were also found on 8 of the chromosomes.
Figure 1.—
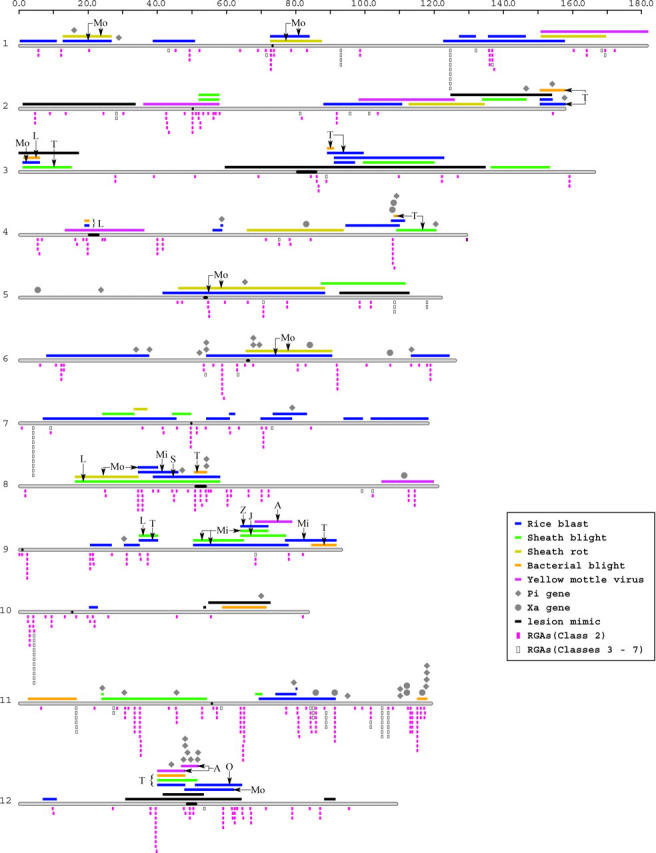
Integrated disease QTL map of rice. The scale at the top represents centimorgan values from the JRGP 2000 genetic map. Rice chromosomes are represented as gray bars and labeled 1–12, with the centromeres colored black within the chromosomes. Disease QTL and lesion mimic loci are shown as bars and R genes are represented by shapes above the chromosomes. Letter designations for QTL indicate the parental alleles associated with resistance at the corresponding loci (L, Lemont; T, Teqing; Mo, Moroberekan; Mi, Minghui 63; Z, Zhenshan 97B; S, SHZ-2; A, Azucena; J, Jasmine 85; O, Owarihatamochi). Resistance gene analogs (RGAs) of the NBS-LRR class are shown below the chromosomes.
We tested the null hypothesis that the QTL data were randomly distributed using two separate tests, the chi-square goodness-of-fit and the Poisson dispersion. For the QTL sample data, the results of the two tests were inconsistent. When applying the chi-square goodness-of-fit test, it was necessary to consider genomic bins with more than three QTL as a single category to achieve expected values greater than one (Cochran 1954). At α = 0.05, we failed to reject the null hypothesis that the cell counts arose from a Poisson with an unspecified mean (P ≈ 0.1).
The bin size used for this analysis can affect the conclusions drawn. Although a significant result was obtained using a 1-cM bin size for the chi-square test, we felt it was inappropriate because such a small bin size gives large QTL more weight than small QTL in the analysis. Thus, we chose to use the average QTL size as the bin size. Even using the average QTL size as the bin size, evidence for a nonrandom QTL distribution was obtained using the Poisson dispersion test. The null hypothesis of a Poisson distribution was rejected (P = 0.0076), irrespective of the bin size used for the analysis. It is not unusual for these tests to present contrasting results, apparently because the dispersion test has more power, owing to the specific alternative hypothesis that the distribution is not Poisson (Rice 1988). Furthermore, the coefficient of dispersion, a frequently used measure of clustering, suggested the sample data were overdispersed or clumped (CD > 1).
As with the QTL data, it was necessary to consider genomic bins with more than two R genes as a single category to achieve expected values greater than one when using the chi-square test to assess the genomic distribution of R genes. The hypothesis that these genes were randomly distributed was rejected with each of the applied tests (χ2, P = 0.002; Poisson dispersion, P ≈ 0; CD > 1). When R genes denoted as tentative (those presumed to be pending allelism tests) were removed from the data set, the R gene distribution could not be tested with the chi-square test, due to lack of sufficient data. The Poisson dispersion test can be used in such instances (Rice 1988). The R gene set did not fit a Poisson distribution according to the Poisson dispersion test (P ≈ 0). When both R genes and QTL were included in the analysis, the null hypothesis of a random distribution was rejected on the basis of the chi-square test (P = 0.017). The Poisson dispersion test remained significant, and the CD was >1. These analyses indicate clustering of QTL, R genes, and the two taken together, but did not address the extent to which they associate with each other.
Colocalizing QTL condition resistance to multiple diseases:
For two diseases, rice blast and sheath blight, the availability of multiple published studies allowed us to evaluate the distribution of QTL for a given disease (Table 1). Relatively few colocalizing QTL were found across studies for a given disease. For the eight rice blast studies, 30 of the 108 genomic bins contained a single QTL (1-hit bins), while 11 bins had more than one QTL. That is, a comparatively high proportion of QTL were identified in only one study, and unique QTL were identified in six of the eight studies. For sheath blight, 15 1-hit bins were observed and 2 bins contained two QTL (Figure 1). All four of the sheath blight studies identified at least one unique QTL.
Among the 27 bins with more than one QTL, 22 (82%) had QTL for more than one disease. Five bins were associated with resistance to at least three diseases. Thus, several genomic regions appeared to condition BS-QDR, as indicated by the abundance of heterogeneous bins. In some cases, chromosomal segments from a single resistance donor conditioned resistance to multiple diseases (Figure 1). This could be determined from three sets of studies in which a QTL analysis was performed using the same mapping population (Table 1). For example, four segments on chromosomes 1, 5, and 6 from cv. Moroberekan were associated with resistance to both rice blast and sheath rot (Wang et al. 1994; Srinivasachary et al. 2002). The pericentric QTL cluster on chromosome 12 conditioned QDR to four pathogens. These QTL were identified using three different mapping populations, but overlapping QTL were detected in cv. Teqing for rice blast, sheath blight, and bacterial blight using the same mapping population (Figure 1; Li et al. 1995, 1999; Tabien et al. 2002). In total, 11 chromosomal segments were associated with BS-QDR conditioned by alleles from the same donor.
In eight instances, a cluster of QTL was derived from more than one source of resistance. This was observed when QTL detected in studies using different mapping populations colocalized. Occasionally, colocalizing QTL were detected for two diseases with the same mapping population, where the resistance donor for one disease was not the donor for the other disease. Rice blast, bacterial blight, and sheath blight QTL were detected in three studies using a Lemont/Teqing mapping population (Li et al. 1995, 1999; Tabien et al. 2002). A telomeric section of chromosome 3 was associated with resistance to sheath blight, conditioned by an allele from Teqing, while the colocalizing bacterial blight QTL was attributed to Lemont (Figure 1). Again, on chromosome 8, a bacterial blight QTL from Teqing colocalized with a sheath blight QTL contributed by Lemont. Similarly, QTL analysis of rice blast and sheath blight was performed with a Zhenshan 97/Minghui 63 mapping population (Han et al. 2002; Chen et al. 2003). In the genomic interval on chromosome 9 from ∼64 to 72 cM, quantitative resistance to sheath blight was derived from Minghui 63, whereas resistance to rice blast was contributed by Zhenshan 97.
Location of genes, R genes, RGAs, and gene families with respect to QTL:
In Figure 1, the estimated map locations of reported R genes for rice blast (Pi genes) and bacterial blight (Xa genes) and RGAs are summarized with respect to disease QTL. Many of the QTL appeared to colocalize with R genes and/or RGAs, while others were found in regions of the genome where no R gene and/or RGA had been located. Using Fisher's exact test, we evaluated whether all rice genes, major genes, or RGAs were enriched in the QTL fraction of the genome (significantly more frequent in the QTL fraction than expected on the basis of a null hypothesis of independence).
Fifty-four percent of the genetically defined rice genome was associated with reported QTL for disease resistance. If genes were randomly distributed with respect to QTL, we would expect 54% of the total number of genes to reside in the QTL genomic fraction. There was a significant enrichment of rice FL-cDNAs (59%; P ≈ 0) and predicted genes (60%; P ≈ 0) in the QTL fraction of the genome, indicating that QTL were present in relatively gene-dense regions.
To test for overrepresentation in the QTL fraction of R genes, RGAs, and gene families, an expected gene number was established on the basis of the distribution of all FL-cDNAs or TIGR predicted genes. There was enrichment in the proportion of major genes colocalizing with the QTL fraction of the genome (81%, P = 0.0002) relative to the proportion of all FL-cDNAs (59%) or all TIGR predicted genes (60%). Rice RGAs belonging to the NBS-LRR class have been categorized into six separate classes (classes 2–7, n = 583 genes) on the basis of the presence/absence and conservation of sequence motifs (Monosi et al. 2004). After correcting for multiple tests, the percentage of RGAs colocalizing with the QTL genomic fraction (63%) did not exceed the expected proportion when all classes were considered together. Only the class 2 (non-toll/interleukin-1 receptor NBS-LRR) genes have been associated with resistance and no phenotypes have yet been associated with the other classes. When the class 2 RGAs (n = 489) were tested, a significant enrichment was observed (71%, P = 4.8 × 10⁻⁷).
A subset of the Pi and Xa genes was not associated with rice blast and bacterial blight QTL, respectively, but instead colocalized with QTL for different diseases. This was observed on chromosomes 2, 4, 6, 8, 10, and 11 (Figure 1). For instance, xa13 was located at 111.2 cM on chromosome 8 (Sanchez et al. 1999), and colocalized with a QTL for rice yellow mottle virus resistance. Similarly, on chromosome 11, three Pi genes [Pia and Pi30(t), Sallaud et al. 2003; Pise1, Gramene, March 2004] colocalized with sheath blight QTL within the interval 24.1–54.3 cM.
Different chromosomal segments could be characterized by their distinct resistance-associated features, including QTL, lesion mimic genes, R genes, and RGAs. For instance, in the pericentric section of chromosome 12, all classes of resistance-associated features colocalized. In contrast, overlapping QTL conditioning resistance to rice blast, sheath blight, and bacterial blight were identified in the telomeric section of chromosome 3, along with a lesion mimic gene, in a region devoid of major genes and RGAs. For a number of QTL regions there was no colocalizing major gene, in spite of the significant association between major genes and QTL (Figure 1).
Several specific candidate gene families, namely genes encoding the transcription factors WRKY, ERF, MYB, and bZIP and genes encoding proteins with ankyrin repeats, were examined for possible overrepresentation in the QTL genomic fraction. None of these candidate gene families showed significant enrichment, although each family, except for ERF, was slightly more abundant in the QTL genomic fraction (>59%) relative to all nonredundant FL-cDNAs. Among the gene families tested, the FL-cDNA representative members of the ERF gene family were the least represented in the QTL genomic fraction (57%), while the WRKY gene family was most associated with QTL (68%).
Correspondences between QTL and FL-cDNAs were surveyed for those FL-cDNAs harboring InterPro domains. Gene families were defined as genes sharing a protein domain characterized in the InterPro database. There were 675 distinct FL-cDNA representative gene families with <14 members, for which 100% of the members colocalized with disease QTL. These mostly comprised families with <4 members. Among the 145 gene families with at least 20 members, 62 had a greater representation in the QTL genomic fraction than the total number of nonredundant FL-cDNAs (Figure 2).
Figure 2.—

Percentage of FL-cDNA representative gene families with a minimum of 20 members, residing in the disease QTL genomic fraction. Each gene family was defined as the set of FL-cDNAs harboring an individual InterPro domain. The solid line at 59% indicates the percentage of the entire catalog of nonredundant FL-cDNAs (n = 21,446) that were located in the QTL genomic fraction, or the mean value. The false discovery rate (FDR) for the most significant gene families is shown.
The percentage distribution of positive QTL-gene family correspondences did not fit a normal distribution and was skewed above the mean percentage (Figure 2, tests of normality not shown). Extreme outliers above the mean of the given distribution were examined after ranking the calculated P-values from Fisher's test. The four families defined by five domains that had the lowest P-values among the 145 families tested corresponded to FL-cDNAs harboring the following five domains: (1) mitochondrial transcription termination factor (n = 20, 95% QTL); (2) glutathione S-transferase, C terminus (n = 39, 87.2% QTL); (3) glutathione S-transferase, N terminus (n = 41, 85.4% QTL); (4) UDP-glucosyltransferase (n = 45; 80.4% QTL); and (5) peptidase S8 and S53, subtilisin, kexin, and sedolisin (n = 21; 90.5% QTL). For each of these families (except the peptidase S8 gene family), there was a false discovery rate (FDR) of 2% that they were nonrandomly associated with QTL. For the peptidase S8 gene family, there was a 6% FDR. The next best-ranked gene family had a 35% FDR for a nonrandom association.
Digital Northern analysis of rice blast interactions:
If some of the genes controlling disease QTL are regulated in response to pathogen infection, libraries made from pathogen-infected tissue might be a good source of candidate genes. To infer pathogen-affected changes in gene expression, the BLAST algorithm was used to quantify and compare the frequencies of EST matches for a given gene in selected EST libraries (Table 2). Of the 29,914 ESTs, a total of 20,098 matched an FL-cDNA under the BLAST parameter criteria applied. Hence, a match was not identified for 32.8% of the ESTs in the database. Matches among the 20,098 ESTs were found for 6024 nonredundant FL-cDNAs, reflecting the number of contigs comprised of these ESTs. While performing a digital Northern analysis, a reduction in the number of independent tests was achieved by limiting the statistical analysis to those FL-cDNAs having a minimum of five EST matches in any one of the six libraries. Among the 342 independent tests performed, 74 nonredundant FL-cDNAs were associated with significantly different EST frequencies among the libraries (α = 0.05, with Bonferroni correction). At a 5% FDR, 199 FL-cDNAs were associated with significantly different EST frequencies. These cDNAs were integrated with the genetic map along with the QTL summary data (Figure S1 at http://www.genetics.org/supplemental/). There were 4 cDNAs in the Bonferroni-corrected data set and 13 in the FDR-corrected data set that could not be located on the genetic map.
Cluster analysis was used to group genes (Sturn et al. 2002) on the basis of their digital Northern profiles. Similarly, libraries were grouped according to their constituent gene complements (Figure 3). The inferred library relationships were the same when the differentially expressed genes (n = 74, Bonferroni-corrected data set) or all of the FL-cDNA digital Northern profiles (n = 6024) were used. However, using different distance measures for hierarchical clustering altered the inferred relationships of genes and libraries (data not shown). Several groups of genes could be identified in Figure 3, each of which was variably represented among the pathogen-induced libraries only. Furthermore, relative to the control, a group of “downregulated” genes in the pathogen-induced libraries was observed. Gene clades dominantly associated with specific EST libraries were also resolved. A more detailed analysis of library-specific gene sets is in progress elsewhere (G. Wang, personal communication).
Figure 3.—
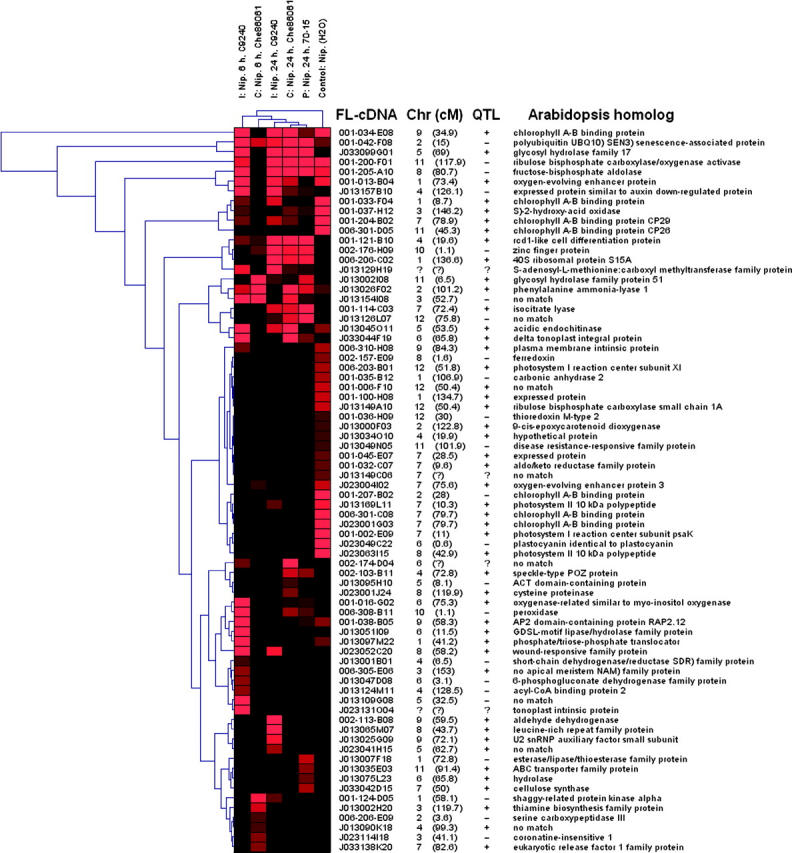
Cluster analysis of genes with significantly different EST abundances detected in a digital Northern analysis (Bonferroni correction, α = 0.05). The EST libraries described in Table 2 are indicated at the top horizontal axis. The following abbreviations were used to indicate the type of plant-pathogen interaction: (1) I, incompatible; (2) C, compatible; and (3) P, partial. Genes are represented by branches along the left vertical axis. The FL-cDNA clone name corresponds to the longest (in base pairs) cDNA for a given FL-cDNA cluster. The centimorgan values correspond to the rice JRGP 2000 high-density genetic map (unknown map locations are symbolized by a question mark). The symbols in the QTL column indicate whether the FL-cDNA colocalized with a QTL (+) or did not colocalize (−) or that the map position was unknown (?). Arabidopsis homologs were identified by BLASTp searches and match with an E-value ≤e−18. The relative abundance of ESTs across libraries is indicated by the intensity of the color red.
We tested whether the pathogen-affected cDNAs were enriched in the QTL fraction of the genome. Of the genes found to be differentially represented using the Bonferroni method for multiple-test correction, 67% of the FL-cDNAs colocalized with all disease QTL and 53% colocalized with rice blast QTL. A significantly higher proportion of differentially represented genes colocalized with rice blast QTL (P = 0.007) but not with all disease QTL, relative to the expected number based on the distribution of all nonredundant FL-cDNAs. The data set corrected by the FDR method was randomly associated with the all disease QTL and rice blast QTL genomic fractions, perhaps due to a larger proportion of false positives.
Annotations of the set of genes with significant differences in EST abundance are provided in Figure 3 and Table S4 (supplementary data at http://www.genetics.org/supplemental/) and through links to the KOME database (http://cdna01.dna.affrc.go.jp/cDNA/) in Figure S1 (supplementary data). These annotations represent a broad range of functions and include genes classically associated with plant defense (e.g., PR genes).
Positional candidate genes apparent from inspection of existing annotation:
We inspected the gene annotations derived from BLAST searches against Arabidopsis proteins performed by Kikuchi et al. (2003) for the rice FL-cDNAs in selected chromosomal segments associated with QTL for multiple diseases. There were 296 FL-cDNAs in the telomeric region on the short arm of chromosome 3, which contains a lesion mimic gene and QTL to three pathogens. A BLASTp match (E-value <e−10) against an Arabidopsis protein was found for 81% of these translated FL-cDNAs. At least 40 cDNAs (∼17%) could be associated with the plant defense literature, on the basis of annotation alone. While no NBS-LRR-like genes were annotated in this region, other classes of putative R genes were present, including several protein kinases, an LRR-transmembrane protein kinase, and a homolog of the barley Mlo gene. Several other classes of genes (e.g., transcription factors and PR genes) implicated in the defense response literature were also found.
Inspection of the annotation of cDNAs mapped in a segment on chromosome 9, which included eight QTL for four diseases, also revealed many candidate defense genes. In this segment, 78% (n = 431) of the translated FL-cDNAs each matched an Arabidopsis protein, and on the basis of the annotation ∼22% of these could be associated with the plant defense literature. Members of defense-associated transcription factor families including WRKY, ERF, bZIP (n = 3 of each), and MYB (n = 2) genes were annotated in the region. An array of other defense-associated gene annotations were also observed in this region, including an elicitor response protein, a glutathione S-transferase, a synaptosome-associated protein receptor, pathogenesis-related proteins, RGAs, phosphatases, cell-wall associated kinases, an LRR-transmembrane kinase, calcium-dependent kinases, serine-threonine dependent kinases, and other protein kinases.
In addition, several defense-associated genes that belong to common biosynthetic pathways were found in this chromosomal segment. Five genes associated with KEGG pathway 00940 (i.e., flavanoid, stilbene, and lignin biosynthesis) and 14 genes associated with ubiquitin-mediated proteolysis (includes ubiquitin biosynthesis, n = 2 genes) were identified. Of the ubiquitin proteolysis-associated sequences, 13 were unrelated by sequence identity (BLASTn analysis, E-value ≤e−10). Inspecting this ∼40-cM segment in 5-cM windows, these genes occurred three times in groups of 2, one time as a group of 3 genes, and once as a group of 5 genes. This colocalization of potentially functionally related genes is unlikely to occur by chance, on the basis of the numbers of paralogs for each gene and given that colocalization did not occur elsewhere in the genome. For each of the 13 sequences, the number of putative paralogs in the entire set of nonredundant FL-cDNAs ranged from zero to seven. Using the chromosome map tool at the Arabidopsis Information Resource (http://www.arabidopsis.org/), we visualized the genomic locations of the Arabidopsis homologs. The ubiquitin-associated genes were not similarly clustered in the Arabidopsis genome (i.e., they were distributed on all linkage groups; data not shown).
The pericentric section of chromosome 12 contained seven QTL conditioning resistance to four diseases, eight Pi genes (R genes for rice blast resistance), and two lesion mimic genes. Of the 184 annotated cDNAs present in this region, ∼18% were associated with the plant defense literature. These annotations included 14 RGAs (NBS-LRR class), several different kinases, a cytochrome P450, wound-induced basic proteins, a glutathione S-transferase, an ABC transporter, and a senescence-associated protein. In this pericentric region, the number of FL-cDNAs represents 16% of the putative total number of genes (Table 3), which is the smallest proportional representation of the regions examined. Therefore, many other potentially defense-related genes are likely to reside in this segment.
DISCUSSION
Evidence for BS-QDR emerged from a synthesis of previously published QTL data. For the rice cultivars Moroberekan, Teqing, Lemont, and Minghui 63, several chromosomal segments were associated with quantitative resistance to two or three diseases. Integrating the QTL data onto a single map-based format allowed us to characterize the QTL genomic fraction. By investigating the genes and pathways underlying the QTL fraction of the genome in general and underlying the regions of QTL clusters in particular, genes potentially contributing to BS-QDR were identified. The number of candidate gene-QTL associations was large, demonstrating the need to narrow QTL confidence intervals. This study offers guidance for phenotypic or marker-assisted breeding efforts, germplasm utilization, and directions for future research on quantitative and broad-spectrum disease resistance.
About half of the genetically defined rice genome was implicated in QDR on the basis of the summary of published studies. For multiple studies of the same disease, a given QTL was rarely identified repeatedly; many QTL were discovered in only one study. There are two general interpretations for this observation: different germplasm draws on distinct QTL, or, alternatively, the QTL results are essentially irreproducible, and the observed associations between markers and phenotypes occurred by chance. In relation to a phylogeny of rice genotypes, the crosses analyzed represent a small but diverse sample of the temperate and tropical japonica and indica germplasm (A. Garris, personal communication, data not shown). Therefore, the low proportion of overlapping QTL identified for a given disease across multiple studies is consistent with the hypothesis that a high number of potential QTL exist in the rice germplasm, such that each cross represents a different subsample of QTL. While the replicability of QTL analysis is problematic, we note that an average of ∼80% of the QTL was observed repeatedly within a given study performed over multiple years and/or environments (although such experimental replications were reported in only 5 of the 16 studies). Inconsistent detection of QTL has been discussed, and several sources of variability in QTL analysis that would explain nonequivalence across multiple studies are recognized (e.g., Bubeck et al. 1993; Remington and Purugganan 2003).
Most colocalizing QTL conditioned resistance to multiple diseases. The majority of colocalizing resistance QTL for different diseases were detected using the same mapping population and were conditioned by one parent. This confirmed and extended the observation of Li et al. (1999) for the Lemont/Teqing mapping population. In other instances, chromosomal segments containing QTL for multiple diseases were detected using the same mapping population, but were conditioned by the different parents. The remaining genomic sections associated with BS-QDR contained QTL that were detected in different mapping populations. These observations could be explained by single-gene effects or by the effects of clusters of genes. Other authors have noted the colocalization of resistance loci for multiple diseases in plant genomes (Mcmullen and Simcox 1995; Gebhardt and Valkonen 2001; Kover and Caicedo 2001; Tabien et al. 2002; Ramalingam et al. 2003). Together, these observations indicate that BS-QDR exists in the rice germplasm, at the level of chromosomal segments.
On the basis of a visual inspection of the QTL distribution, it was apparent that some QTL clusters exist against a backdrop of dispersed QTL. This impression is reflected in the ambiguous results of the two statistical tests. While the Poisson dispersion test detected evidence for clustering, the chi-square test failed to show evidence for a nonrandom distribution. This was likely due to a lack of power of the chi-square test, as a result of having to pool categories to achieve expectation values greater than one (Cochran 1954). R genes tested alone were found to be nonrandomly distributed. And when both R genes and QTL were included in the analysis, it could be concluded that resistance loci were clustered in the rice genome. Similarly, using the chi-square test, Mcmullen and Simcox (1995) found that disease- and pest-resistance QTL and R genes were clustered in the maize genome. We have also found the published maize disease QTL to be nonrandomly distributed (data not shown). These findings suggest that linked allelic variation associated with qualitative and/or quantitative resistance to multiple diseases has been selected in both inbreeding and outcrossing plant species.
Several authors have noted the coincidence of R genes or RGAs and QTL for disease (e.g., Wang et al. 1994; Pflieger et al. 1999; Gebhardt and Valkonen 2001; Quint et al. 2003). We addressed this tendency across all available studies and found that their associations were significant. Our analysis of RGAs included sequences containing NBS- and LRR-like motifs, which are recognized as the most abundant class of R genes explaining qualitative resistance phenotypes. However, other known classes of R genes exist (Bent 1996) and were not systematically located in this study. The significant colocalization of RGAs and QTL arose when class 2 RGAs were considered alone; this is the class that most closely resembles previously cloned NBS-LRR R genes. While this may imply a role for R genes in conditioning quantitative resistance, this also calls into question the function of the remaining five NBS-LRR classes. This further suggests that with a thorough understanding of gene family structures and phylogenies, patterns may emerge that were once inconspicuous. Even with the significant relationship between QTL, R genes, and RGAs, their associations were intriguingly diverse: for some QTL regions, R genes and RGAs were abundantly colocalized, whereas other QTL were not associated with known R genes or RGAs. This may provide contrasting case studies for the further analysis of the noted relationship between R genes and QTL.
At present, the apparent clustering of R genes and QTL could be accounted for by either of two hypotheses: first, that R genes and/or QTL are allelic [e.g., that R genes function as QTL, and/or overlapping QTL are conditioned by the same gene(s)]; and second, that functional gene clusters exist, which include genes conditioning qualitative and quantitative resistance. It has been posited that qualitative traits may be conditioned by extreme alleles of loci capable of conferring quantitative variation (Robertson 1984). Lefebvre and Chèvre (1995) hypothesized that genes conditioning resistance QTL may be R gene homologs, and Gebhardt and Valkonen (2001) proposed that monogenic- and polygenic-resistance loci are likely conditioned by the existing recognized classes of R genes. Furthermore, some rice R genes have been associated with or shown to condition partial resistance (Wang et al. 1998; Z. K. Li et al. 2001). Similarly, some maize Rp1 haplotypes that confer high levels of race-specific rust resistance also confer quantitative levels of adult-plant, nonspecific resistance (Hu et al. 1997). R genes exhibit race specificity and QTL have been generally assumed to be race nonspecific. In a recent study, Talukder et al. (2004) performed QTL analyses of independent inoculation experiments using three pathogen isolates and found that most rice blast QTL also exhibit race specificity. The significant association of QTL with R genes and RGAs, the residual phenotypic effects of R genes on virulent isolates, and the race specificity of QTL are consistent with the hypothesis that R genes contribute to quantitative resistance.
On the other hand, analyses of gene and trait loci distributions in eukaryotic genomes have provided evidence for linkage of functionally related genes (Mcmullen and Simcox 1995; Khavkin and Coe 1997; Cai and Morishima 2002; Lee and Sonnhammer 2003), potentially shaped through selection of advantageous gene arrangements. The identification of linked genes conditioning quantitative variation is rare, however, possibly due to analytical hurdles as well as to the likely complexity of some QTL (Darvasi and Pisante-Shalom 2002). Considering the nonrandom distribution of QTL and R genes, the significant colocalization of R genes and RGAs with QTL, and the numerous additional positional candidate genes identified, it seems reasonable to further hypothesize that allelic variation at linked loci may explain some resistance QTL or QTL clusters.
Many genes and gene families have been implicated as playing important roles in plant defense on the basis of various types of evidence, including altered expression in response to infection. The association of selected candidate genes with the QTL fraction of the genome was systematically analyzed for several transcription factor families and genes encoding proteins with ankyrin repeats. Although significant associations with the QTL genomic fraction were not detected, there was a trend toward enrichment for all but the ERF family. For instance, the WRKY gene family had the largest percentage of members that colocalized with rice disease QTL, which paralleled the proportion of RGA-QTL associations, but with a smaller sample size a significant association could not be detected. Given the potentially diverse functions of transcription factors, it may not be surprising that significant associations were not found. Furthermore, a general caveat of our analysis of rice FL-cDNAs was that they likely represent a fraction of the family members.
An open-ended survey of QTL-gene family associations revealed a few families that could be considered extreme with respect to the number of positive QTL-family member correspondences. These included the glutathione S-transferase (GST) and UDP-glucosyltransferase gene families, whose members are known to play an important role in plant defense and stress responses (Marrs 1996; Y. Li et al. 2001). Interestingly, members of these separate gene families mediate the same step in the detoxification of electrophilic compounds (Marrs 1996). The significant QTL-GST relationship could be deceptive; several members were arranged in tandem arrays, and one such array colocalized with a single bacterial blight QTL. However, GST genes were located in two of the BS-QDR regions examined. A somewhat similar gene arrangement was identified for the mitochondrial transcription termination factor gene family, whose function is not well understood. Genes harboring common protein domains exhibit a potentially broad range of functions, and ascribing QTL to genes sharing functional motifs requires a further understanding of the actions of individual family members. The result of this analysis does not clearly implicate any single gene family; the range of disease QTL surveyed in this study is potentially conditioned by diverse genes.
One potential cause of variation in quantitative phenotypes is differences in the levels of gene expression. Genes putatively responding to pathogen infection were identified through differences in representation in available EST libraries and located on the disease-QTL map. This approach has been used in studies conducted in both animal and plant systems (Ewing et al. 1999; Mégy et al. 2002; Ventelon-Debout et al. 2003). In this study, a set of genes showing differential representation in rice blast disease-related libraries was identified using the Bonferroni method for multiple test correction. These genes exhibited a nonrandom association with rice blast QTL but not all disease QTL, indicating their trait-specific relationship. The annotation of these genes implies a diverse range of functions, some of which are recognizable as potentially playing a role in plant defense on the basis of previous studies. These genes may be logical targets for further validation and functional analysis. The present analysis should, however, be viewed with caution because of several weaknesses in the data set utilized. The number of ESTs available for analysis was limited, so that genes expressed at low levels may not be detected. To mitigate the risk of type I error, a high threshold of significance had to be applied, such that large differences in representation were required to declare disease responsiveness (e.g., twofold difference in expression might be important, but would not register as significant). Ideally, this analysis would be conducted on genotype(s) expressing broad-spectrum, quantitative resistance, but most data were from the susceptible genotype Nipponbare.
To avoid an excessive bias based on EST frequency analysis, we examined the gene annotations derived from BLASTp searches against Arabidopsis proteins for selected chromosomal segments. Several noteworthy positional candidate genes were identified through inspection of the genes underlying disease-implicated chromosomal segments, considering both gene annotation and the results of EST frequencies in disease-related libraries. Intriguing candidates associated with the telomeric segment of chromosome 3, which was associated with resistance to three diseases and a lesion mimic phenotype, included the homolog of the maize lethal leaf spot-1 (lls1) gene and a homolog of the barley Mlo gene. The lls1 gene was recently identified and determined to condition cell death in response to biotic and abiotic stress (Gray et al. 2002). This gene is a logical candidate to condition spl3, a lesion mimic mutant mapped to this region. Other lesion mimic genes colocalized with disease QTL, making them potentially useful for further analysis in correlating mutant phenotypes with quantitative variation and testing the hypothesis of Robertson (1984). The mlo major gene confers durable resistance in barley to powdery mildew. While Mlo belongs to a multigene family (Devoto et al. 2003), the rice Mlo homolog located in this section of chromosome 3 was shown by transformation to partially complement the mlo phenotype in barley (Elliott et al. 2002). Also present in this region were genes resembling other classes of putative R genes (i.e., protein kinases and an LRR transmembrane protein kinase), indicating the presence of other R gene classes in QTL regions devoid of sequences resembling the NBS-LRR class.
Physical clustering of genes involved in common biosynthetic pathways has been described in eukaryotic genomes (Lee and Sonnhammer 2003; Qi et al. 2004). Multiple linked genes required for a complete phenotype have been described in yeast, lending support to a more complex genetic explanation for some QTL (Steinmetz et al. 2002). In a BS-QDR-associated segment on rice chromosome 9, putative clusters of pathway-related genes were observed. While clustering of homologous defense-related genes has been attributed to the evolutionary processes by which variation at these genes is generated, this explanation does not seem to apply to clustering of nonhomologous defense-related genes. Clustering of nonhomologous genes contributing to a trait, such as genes contributing to a given pathway, may be advantageous because linkage would favor the maintenance of positive epistatic interactions. Further analysis is required to determine whether the disease QTL examined in this study are controlled by single genes, groups of genes with additive effects, or sets of genes with epistatic effects.
A large number of genes associated with plant defense were found in both the QTL and non-QTL genomic fractions. Whether or not defense-related genes can be validated as candidate genes for QDR, two alternative hypotheses can be considered regarding the number of genes associated with this trait: (1) that functional allelic variation is restricted to a subset of genes (the oligogenic or finite model for QDR) or (2) that there are a large number of genes potentially contributing to QDR and functional allelic variation has been detected for only a subset because of the limited germplasm sampled (the polygenic or infinite model for QDR). The large number of candidate genes identified, together with the fact that new QTL were found in each additional study, suggests that the number of QTL could be large.
Combining different forms of resistance (i.e., qualitative and quantitative) may improve both the spectrum and durability of resistance. A disease QTL summary highlights certain opportunities and challenges in breeding via marker-assisted selection (MAS) for BSR. Chromosomal segments associated with resistance to multiple diseases have been “tagged,” providing an opportunity to validate and transfer potential BS-QDR into locally adapted rice varieties using MAS. Because the genomic segments associated with BS-QDR detected in different mapping populations are unlinked, it should be possible to combine these loci from different germplasms into individual genotypes. Due to the potential of loci carrying favorable alleles in repulsion and the many colocalizing QTL associated with different parental alleles for some genomic regions, it will be necessary to narrow QTL confidence intervals prior to gene pyramiding. Furthermore, a broader perspective including QTL data on agronomic traits would assist in developing a molecular-based pyramiding scheme. Ishimaru et al. (2001) constructed a rice “function map” of QTL data associated with physiological and agronomic characters. The QTL locations reported in their study can be easily compared with our integrated disease-QTL map, since the data are anchored onto the same genetic map. Such comprehensive data sets will provide a basis toward the development of genotypes containing desirable alleles for multiple traits in coupling (Peleman and van der Voort 2003).
In this study, preexisting resources were used to make inferences regarding QDR, thus establishing directions for future research. An analytical synthesis of genetic maps of quantitative and qualitative resistance allowed visualization of a range of data types in a map-based format. Evidence for BS-QDR emerged from this analysis. Further evidence supporting the hypothesis that R genes contribute to QDR was identified. The gene content of chromosomal segments conditioning quantitative resistance to multiple pathogens was inspected. On the basis of the range of criteria applied, a large number of defense-related genes were identified as credible positional candidates. Caution is required, at this stage, and chromosomal segments associated with BSR must be systematically dissected through detailed genetic and phenotypic analysis before the genes conditioning quantitative, potentially broad-spectrum resistance can be narrowed to a number that will permit experimental validation through inactivation and/or complementation. Our long-range approach does not depend on candidates only, as hypotheses emerging from this phase of research will be tested by genetic dissection of putative QDR regions of interest.
Acknowledgments
The authors acknowledge Ying Wei for contributing to the QTL summary. We thank Amanda Garris for providing genotype data of rice cultivars and insightful discussions on rice population structure. We also thank Simona Despa and Rasmus Nielsen for statistical advice. We are grateful to Sharon Mitchell and other members of the Institute for Genomic Diversity laboratory for their advice and discussions. This work was supported by grants from The Rockefeller Foundation and The McKnight Foundation and a fellowship from Pioneer Hi-Bred International.
References
- Albar, L., M. Lorieux, N. Ahmadi, I. Rimbault, A. Pinel et al., 1998. Genetic basis and mapping of the resistance to rice yellow mottle virus. I. QTLs identification and relationship between resistance and plant morphology. Theor. Appl. Genet. 97: 1145–1154. [Google Scholar]
- Altschul, S. F., T. L. Madden, A. A. Schaffer, J. Zhang, Z. Zhang et al., 1997. Gapped BLAST and PSI-BLAST: a new generation of protein database search programs. Nucleic Acids Res. 25: 3389–3402. [DOI] [PMC free article] [PubMed] [Google Scholar]
- Benjamini, Y., and Y. Hochberg, 1995. Controlling the false discovery rate: a practical and powerful approach to multiple testing. J. R. Stat. Soc. B 57: 289–300. [Google Scholar]
- Bent, A. F., 1996. Plant disease resistance genes: function meets structure. Plant Cell 8: 1757–1771. [DOI] [PMC free article] [PubMed] [Google Scholar]
- Bubeck, D. M., M. M. Goodman, W. D. Beavis and D. Grant, 1993. Quantitative trait loci controlling resistance to gray leaf spot in maize. Crop Sci. 33: 838–847. [Google Scholar]
- Burge, C., and S. Karlin, 1997. Prediction of complete gene structures in human genomic DNA. J. Mol. Biol. 268: 78–94. [DOI] [PubMed] [Google Scholar]
- Cai, W., and H. Morishima, 2002. QTL clusters reflect character associations in wild and cultivated rice. Theor. Appl. Genet. 104: 1217–1228. [DOI] [PubMed] [Google Scholar]
- Cao, H., X. Li and X. Dong, 1998. Generation of broad-spectrum disease resistance by overexpression of an essential regulatory gene in systemic acquired resistance. Proc. Natl. Acad. Sci. USA 95: 6531–6536. [DOI] [PMC free article] [PubMed] [Google Scholar]
- Causse, M. A., T. M. Fulton, Y. G. Cho, S. N. Ahn, J. Chunwongse et al., 1994. Saturated molecular map of the rice genome based on an interspecific backcross population. Genetics 138: 1251–1274. [DOI] [PMC free article] [PubMed] [Google Scholar]
- Chen, H., S. Wang, Y. Xing, C. Xu, P. M. Hayes et al., 2003. Comparative analyses of genomic locations and race specificities of loci for quantitative resistance to Pyricularia grisea in rice and barley. Proc. Natl. Acad. Sci. USA 100: 2544–2549. [DOI] [PMC free article] [PubMed] [Google Scholar]
- Cochran, W. G., 1954. Some methods for strengthening the common χ2 tests. Biometrics 10: 417–451. [Google Scholar]
- Darvasi, A., and A. Pisante-Shalom, 2002. Complexities in the genetic dissection of quantitative trait loci. Trends Genet. 18: 489–491. [DOI] [PubMed] [Google Scholar]
- Devoto, A., H. A. Hartmann, P. Piffanelli, C. Elliott, C. Simmons et al., 2003. Molecular phylogeny and evolution of the plant-specific seven-transmembrane MLO family. J. Mol. Evol. 56: 77–78. [DOI] [PubMed] [Google Scholar]
- Doebley, J., 1993. Genetics, development and plant evolution. Curr. Opin. Genet. Dev. 3: 865–872. [DOI] [PubMed] [Google Scholar]
- Dong, J., C. Chen and Z. Chen, 2003. Expression profiles of the Arabidopsis WRKY gene superfamily during plant defense response. Plant Mol. Biol. 51: 21–37. [DOI] [PubMed] [Google Scholar]
- Elliott, C., F. Zhou, W. Spielmeyer, R. Panstruga and P. Schulze-Lefert, 2002. Functional conservation of wheat and rice Mlo orthologs in defense modulation to the powdery mildew fungus. Mol. Plant-Microbe Interact. 15: 1069–1077. [DOI] [PubMed] [Google Scholar]
- Ewing, R. M., A. B. Kahla, O. Poirot, F. Lopez, S. Audic et al., 1999. Large-scale statistical analyses of rice ESTs reveal correlated patterns of gene expression. Genome Res. 9: 950–959. [DOI] [PMC free article] [PubMed] [Google Scholar]
- Fan, W., and X. Dong, 2002. In vivo interaction between NPR1 and transcription factor TGA2 leads to salicylic acid-mediated gene activation in Arabidopsis. Plant Cell 14: 1377–1389. [DOI] [PMC free article] [PubMed] [Google Scholar]
- Fokunang, C. N., T. Ikotun, A. G. O. Dixon and C. N. Akem, 2000. Field reaction of cassava genotypes to anthracnose, bacterial blight, cassava mosaic disease and their effects on yield. Afr. Crop Sci. J. 8: 179–186. [Google Scholar]
- Fukuoka, S., and K. Okuno, 2001. QTL analysis and mapping of pi21, a recessive gene for field resistance to rice blast in Japanese upland rice. Theor. Appl. Genet. 103: 185–190. [Google Scholar]
- Gebhardt, C., and J. P. Valkonen, 2001. Organization of genes controlling disease resistance in the potato genome. Annu. Rev. Phytopathol. 39: 79–102. [DOI] [PubMed] [Google Scholar]
- Ghesquière, A., L. Albar, M. Lorieux, N. Ahmadi, D. Fragette et al., 1997. A major quantitative trait locus for rice yellow mottle virus resistance maps to a cluster of blast resistance genes on chromosome 12. Phytopathology 87: 1243–1249. [DOI] [PubMed] [Google Scholar]
- Glazier, A. M., J. H. Nadeau and T. J. Aitman, 2002. Finding genes that underlie complex traits. Science 298: 2345–2349. [DOI] [PubMed] [Google Scholar]
- Grafen, A., and R. Hails, 2002 Modern Statistics for the Life Sciences, pp. 258–265. Oxford University Press, New York.
- Gray, J., D. Janick-Buckner, B. Buckner, P. S. Close and G. S. Johal, 2002. Light-dependent death of maize lls1 cells is mediated by mature chloroplasts. Plant Physiol. 130: 1894–1907. [DOI] [PMC free article] [PubMed] [Google Scholar]
- Grisart, B., F. Farnir, L. Karim, N. Cambisano, J. J. Kim et al., 2004. Genetic and functional confirmation of the causality of the DGAT1 K232A quantitative trait nucleotide in affecting milk yield and composition. Proc. Natl. Acad. Sci. USA 101: 2398–2403. [DOI] [PMC free article] [PubMed] [Google Scholar]
- Han, Y. P., Y. Z. Xing, Z. X. Chen, S. L. Gu, X. B. Pan et al., 2002. Mapping QTLs for horizontal resistance to sheath blight in an elite rice restorer line, Minghui 63. Acta Genet. Sin. 29: 622–626. [PubMed] [Google Scholar]
- Harushima, Y., M. Yano, A. Shomura, M. Sato, T. Shimano et al., 1998. A high-density rice genetic linkage map with 2275 markers using a single F2 population. Genetics 148: 479–494. [DOI] [PMC free article] [PubMed] [Google Scholar]
- Hu, G., C. A. Webb and S. H. Hulbert, 1997. Adult-plant phenotype of the Rp1-DJ compound rust resistance gene in maize. Phytopathology 87: 236–241. [DOI] [PubMed] [Google Scholar]
- Ishimaru, K., M. Yano, N. Aoki, K. Ono, T. Hirose et al., 2001. Toward the mapping of physiological and agronomic characters on a rice function map: QTL analysis and comparison between QTLs and expressed sequence tags. Theor. Appl. Genet. 102: 793–800. [Google Scholar]
- Ishimaru, K., K. Ono and T. Kashiwagi, 2004. Identification of a new gene controlling plant height in rice using the candidate-gene strategy. Planta 218: 388–395. [DOI] [PubMed] [Google Scholar]
- Jakoby, M., B. Weisshaar, W. Dröge-Laser, J. Vicente-Carbajosa, J. Tiedemann et al., 2002. bZIP transcription factors in Arabidopsis. Trends Plant Sci. 7: 106–111. [DOI] [PubMed] [Google Scholar]
- Jeon, J.-S., D. Chen, G.-H. Yi, G. L. Wang and P. C. Ronald, 2003. Genetic and physical mapping of Pi5(t), a locus associated with broad-spectrum resistance to rice blast. Mol. Gen. Genomics 269: 280–289. [DOI] [PubMed] [Google Scholar]
- Jørgensen, J. H., and K. Mortensen, 1977. Primary infection by Erysiphe graminis f. sp. hordei of barley mutants with resistance genes in the ml-o locus. Phytopathology 67: 678–685. [Google Scholar]
- Kachroo, A., Z. He, R. Patkar, Q. Zhu, J. Zhong et al., 2003. Induction of H2O2 in transgenic rice leads to cell death and enhanced resistance to both bacterial and fungal pathogens. Trans. Res. 12: 577–586. [DOI] [PubMed] [Google Scholar]
- Katzov, H., K. Chalmers, J. Palmgren, N. Andreasen, B. Johansson et al., 2004. Genetic variants of ABCA1 modify Alzheimer disease risk and quantitative traits related to beta-amyloid metabolism. Hum. Mutat. 23: 358–367. [DOI] [PubMed] [Google Scholar]
- Khavkin, E., and E. H. Coe, 1997. Mapped genomic locations for developmental functions and QTLs reflect concerted groups in maize (Zea mays L.). Theor. Appl. Genet. 95: 343–352. [Google Scholar]
- Kikuchi, S., K. Satoh, T. Nagata, N. Kawagashira, K. Doi et al., 2003. Collection, mapping, and annotation of over 28,000 cDNA clones from japonica rice. Science 301: 376–379. [DOI] [PubMed] [Google Scholar]
- Kover, P. X., and A. L. Caicedo, 2001. The genetic architecture of disease resistance in plants and the maintenance of recombination by parasites. Mol. Ecol. 10: 1–16. [DOI] [PubMed] [Google Scholar]
- Kozik, A., E. Kochetkova and R. Michelmore, 2002. GenomePixelizer—a visualization program for comparative genomics within and between species. Bioinformatics 18: 335–336. [DOI] [PubMed] [Google Scholar]
- Kunihiro, Y., Q. Qian, H. Sato, S. Teng, D. L. Zeng et al., 2002. QTL analysis of sheath blight resistance in rice (Oryza sativa L.). Acta Genet. Sin. 29: 50–55. [PubMed] [Google Scholar]
- Lee, J. M., and E. L. Sonnhammer, 2003. Genomic gene clustering analysis of pathways in eukaryotes. Genome Res. 13: 875–882. [DOI] [PMC free article] [PubMed] [Google Scholar]
- Lefebvre, V., and A.-M. Chèvre, 1995. Tools for marking plant disease and resistance genes: a review. Agronomie 15: 3–19. [Google Scholar]
- Li, Y., S. Baldauf, E.-K. Lim and D. J. Bowles, 2001. Phylogenetic analysis of the UDP-glycosyltransferase multigene family of Arabidopsis thaliana. J. Biol. Chem. 276: 4338–4343. [DOI] [PubMed] [Google Scholar]
- Li, Z. K., S. R. M. Pinson, M. A. Marchetti, J. W. Stansel and W. D. Park, 1995. Characterization of quantitative trait loci (QTL) in cultivated rice contributing to field resistance to sheath blight (Rhizoctonia solani). Theor. Appl. Genet. 91: 382–388. [DOI] [PubMed] [Google Scholar]
- Li, Z. K., L. J. Luo, H. W. Mei, A. H. Paterson, X. H. Zhao et al., 1999. A “defeated” rice resistance gene acts as a QTL against a virulent strain of Xanthomonas oryzae pv. oryzae. Mol. Gen. Genet. 261: 58–63. [DOI] [PubMed] [Google Scholar]
- Li, Z. K., A. Sanchez, E. Angeles, S. Singh, J. Domingo et al., 2001. Are the dominant and recessive plant disease resistance genes similar?: a case study of rice R genes and Xanthomonas oryzae pv. oryzae races. Genetics 159: 757–765. [DOI] [PMC free article] [PubMed] [Google Scholar]
- Liu, G., G. Lu, L. Zeng and G.-L. Wang, 2002. Two broad-spectrum blast resistance genes, Pi9(t) and Pi2(t), are physically linked on rice chromosome 6. Mol. Gen. Genomics 267: 472–480. [DOI] [PubMed] [Google Scholar]
- Maleck, K., A. Levine, T. Eulgem, A. Morgan, J. Schmid et al., 2000. The transcriptome of Arabidopsis thaliana during systemic acquired resistance. Nat. Genet. 26: 403–410. [DOI] [PubMed] [Google Scholar]
- Marrs, K. A., 1996. The functions and regulation of glutathione S-transferases in plants. Annu. Rev. Plant Physiol. Plant Mol. Biol. 47: 127–158. [DOI] [PubMed] [Google Scholar]
- Mcmullen, M. D., and K. D. Simcox, 1995. Genomic organization of disease and insect resistance genes in maize. Mol. Plant-Microbe Interact. 8: 811–815. [Google Scholar]
- Mégy, K., S. Audic and J.-M. Claverie, 2002. Heart-specific genes revealed by expressed sequence tag (EST) sampling. Genome Biol. 3: 0074.1–0074.11. [DOI] [PMC free article] [PubMed] [Google Scholar]
- Miyamoto, M., M. Yano and H. Hirasawa, 2001. Mapping of quantitative trait loci conferring blast field resistance in the Japanese upland rice variety Kahei. Breed. Sci. 51: 257–261. [Google Scholar]
- Monosi, B., R. J. Wisser, L. Pennill and S. H. Hulbert, 2004. Full-genome analysis of resistance gene homologues in rice. Theor. Appl. Genet. 109: 1434–1447. [DOI] [PubMed] [Google Scholar]
- Mou, Z., W. Fan and X. Dong, 2003. Inducers of plant systemic acquired resistance regulate NPR1 function through redox changes. Cell 113: 935–944. [DOI] [PubMed] [Google Scholar]
- Mulder, N. J., R. Apweiler, T. K. Attwood, A. Bairoch, D. Barrell et al., 2003. The InterPro Database, 2003 brings increased coverage and new features. Nucleic Acids Res. 31: 315–318. [DOI] [PMC free article] [PubMed] [Google Scholar]
- Oñate-Sanchez, L., and K. B. Singh, 2002. Identification of Arabidopsis ethylene-responsive element binding factors with distinct induction kinetics after pathogen infection. Plant Physiol. 128: 1313–1322. [DOI] [PMC free article] [PubMed] [Google Scholar]
- Peleman, J. D., and J. R. van der Voort, 2003. Breeding by design. Trends Plant Sci. 8: 330–334. [DOI] [PubMed] [Google Scholar]
- Pflieger, S., V. Lefebvre, C. Caranta, A. Blattes, B. Goffinet et al., 1999. Disease resistance gene analogs as candidates for QTLs involved in pepper-pathogen interactions. Genome 42: 1100–1110. [PubMed] [Google Scholar]
- Pflieger, S., V. Lefebvre and M. Causse, 2001. The candidate gene approach in plant genetics: a review. Mol. Breed. 7: 275–291. [Google Scholar]
- Qi, X., S. Bakht, M. Leggett, C. Maxwell, R. Melton et al., 2004. A gene cluster for secondary metabolism in oat: implications for the evolution of metabolic diversity in plants. Proc. Natl. Acad. Sci. USA 101: 8233–8238. [DOI] [PMC free article] [PubMed] [Google Scholar]
- Quint, M., C. M. Dußle, A. E. Melchinger and T. Lubberstedt, 2003. Identification of genetically linked RGAs by BAC screening in maize and implications for gene cloning, mapping and MAS. Theor. Appl. Genet. 106: 1171–1177. [DOI] [PubMed] [Google Scholar]
- Ramalingam, J., C. M. Vera Cruz, K. Kukreja, J. M. Chittoor, J. L. Wu et al., 2003. Candidate defense genes from rice, barley, and maize and their association with qualitative and quantitative resistance in rice. Mol. Plant-Microbe Interact. 16: 14–24. [DOI] [PubMed] [Google Scholar]
- Ramonell, K. M., and S. Somerville, 2002. The genomics parade of defense responses: to infinity and beyond. Curr. Opin. Plant Biol. 5: 1–4. [DOI] [PubMed] [Google Scholar]
- Remington, D. L., and M. D. Purugganan, 2003. Candidate genes, quantitative trait loci, and functional trait evolution in plants. Int. J. Plant Sci. 164: S7–S20. [Google Scholar]
- Rice, J. A., 1988 Mathematical Statistics and Data Analysis. Wadsworth, Belmont, CA.
- Robertson, D. S., 1984. A possible technique for isolating genic DNA for quantitative traits. Maize Newsl. 58: 10–11. [Google Scholar]
- Romualdi, C., S. Bortoluzzi and G. A. Danieli, 2001. Detecting differentially expressed genes in multiple tag sampling experiments: comparative evaluation of statistical tests. Hum. Mol. Genet. 10: 2133–2141. [DOI] [PubMed] [Google Scholar]
- Romualdi, C., S. Bortoluzzi, F. D'Alessi and G. A. Danieli, 2003. IDEG6: a web tool for detection of differentially expressed genes in multiple tag sampling experiments. Physiol. Genomics 12: 159–162. [DOI] [PubMed] [Google Scholar]
- Salamov, A., and V. Solovyev, 2001. Ab initio gene finding in Drosophila genomic DNA. Genome Res. 10: 516–522. [DOI] [PMC free article] [PubMed] [Google Scholar]
- Sallaud, C., M. Lorieux, E. Roumen, D. Tharreau, R. Berruyer et al., 2003. Identification of five new blast resistance genes in the highly blast-resistant rice variety IR64 using a QTL mapping strategy. Theor. Appl. Genet. 106: 794–803. [DOI] [PubMed] [Google Scholar]
- Sanchez, A. C., L. L. Ilag, D. Yang, D. S. Brar, F. Ausubel et al., 1999. Genetic and physical mapping of xa13, a recessive bacterial blight resistance gene in rice. Theor. Appl. Genet. 98: 1022–1028. [Google Scholar]
- Sirithunya, P., S. Tragoonrung, A. Vanavichit, N. Pa-In, C. Vongsaprom et al., 2002. Quantitative trait loci associated with leaf and neck blast resistance in recombinant inbred line population of rice (Oryza sativa). DNA Res. 9: 79–88. [DOI] [PubMed] [Google Scholar]
- Srinivasachary, S. Hittalmani, K. Girish Kumar, H. E. Shashidhar and M. G. Vaishali, 2002. Identification of quantitative trait loci associated with sheath rot resistance (Sarocladium oryzae) and panicle exsertion in rice (Oryza sativa L.). Curr. Sci. 82: 133. [Google Scholar]
- Steinmetz, L. M., H. Sinha, D. R. Richards, J. I. Spiegelman, P. J. Oefner et al., 2002. Dissecting the architecture of a quantitative trait locus in yeast. Nature 416: 326–330. [DOI] [PubMed] [Google Scholar]
- Sticher, L., B. Mauch-Mani and A. J. Metraux, 1997. Systemic acquired resistance. Annu. Rev. Phytopathol. 35: 235–270. [DOI] [PubMed] [Google Scholar]
- Stuiver, M. H., and J. H. H. V. Custers, 2001. Engineering disease resistance in plants. Nature 411: 865–868. [DOI] [PubMed] [Google Scholar]
- Sturn, A., J. Quackenbush and Z. Trajanoski, 2002. Genesis: cluster analysis of microarray data. Bioinformatics 18: 207–208. [DOI] [PubMed] [Google Scholar]
- Tabien, R. E., Z. Li, A. H. Paterson, M. A. Marchetti, J. W. Stansel et al., 2002. Mapping QTLs for field resistance to the rice blast pathogen and evaluating their individual and combined utility in improved varieties. Theor. Appl. Genet. 105: 313–324. [DOI] [PubMed] [Google Scholar]
- Talukder, Z. I., D. Tharreau and A. H. Price, 2004. Quantitative trait loci analysis suggests that partial resistance to rice blast is mostly determined by race-specific interactions. New Phytol. 162: 197–209. [Google Scholar]
- Tapsoba, H., J. P. Wilson and W. W. Hanna, 1997. Improvement of resistance to rust through recurrent selection in pearl millet. Crop Sci. 37: 365–369. [Google Scholar]
- Vailleau, F., X. Daniel, M. Tronchet, J. L. Montillet, C. Triantaphylides et al., 2002. A R2R3-MYB gene, AtMYB30, acts as a positive regulator of the hypersensitive cell death program in plants in response to pathogen attack. Proc. Natl. Acad. Sci. USA 99: 10179–10184. [DOI] [PMC free article] [PubMed] [Google Scholar]
- Ventelon-Debout, M., T. T. Nguyen, A. Wissocq, C. Berger, M. Laudie et al., 2003. Analysis of the transcriptional response to Rice Yellow Mottle Virus infection in Oryza sativa indica and japonica cultivars. Mol. Gen. Genomics 270: 253–262. [DOI] [PubMed] [Google Scholar]
- Wang, G. L., D. J. Mackill, M. Bonman, S. R. Mccouch, M. C. Champoux et al., 1994. RFLP mapping of genes conferring complete and partial resistance to blast in a durably resistant rice cultivar. Genetics 136: 1421–1434. [DOI] [PMC free article] [PubMed] [Google Scholar]
- Wang, G. L., D. L. Ruan, W. Y. Song, S. Sideris, L. Chen et al., 1998. Xa21D encodes a receptor-like molecule with a leucine-rich repeat domain that determines race-specific recognition and is subject to adaptive evolution. Plant Cell 10: 765–779. [DOI] [PMC free article] [PubMed] [Google Scholar]
- Wang, Z., G. Taramino, D. Yang, G. Liu, S. V. Tingey et al., 2001. Rice ESTs with disease-resistance gene- or defense-response gene-like sequences mapped to regions containing major resistance genes or QTLs. Mol. Genet. Genomics 265: 302–310. [DOI] [PubMed] [Google Scholar]
- Ware, D. H., P. Jaiswal, J. Ni, I. V. Yap, X. Pan et al., 2002. Gramene, a tool for grass genomics. Plant Physiol. 130: 1606–1613. [DOI] [PMC free article] [PubMed] [Google Scholar]
- Wen, N., Z. Chu and S. Wang, 2003. Three types of defense-responsive genes are involved in resistance to bacterial blight and fungal blast disease in rice. Mol. Gen. Genomics 269: 331–339. [DOI] [PubMed] [Google Scholar]
- Yin, Z., J. Chen, L. Zeng, M. Goh, H. Leung et al., 2000. Characterizing rice lesion mimic mutants and identifying a mutant with broad-spectrum resistance to rice blast and bacterial blight. Mol. Plant-Microbe Interact. 13: 869–876. [DOI] [PubMed] [Google Scholar]
- Yoshimura, A, O. Ideta and N. Iwata, 1997. Linkage map of phenotype and RFLP markers in rice. Plant Mol. Biol. 35: 49–60. [PubMed] [Google Scholar]
- Zenbayashi, K., T. Ashizawa, T. Tani and S. Koizumi, 2002. Mapping of the QTL (quantitative trait locus) conferring partial resistance to leaf blast in rice cultivar Chubu 32. Theor. Appl. Genet. 104: 547–552. [DOI] [PubMed] [Google Scholar]
- Zeng, L., Z. Yin, J. Chen, H. Leung and G. L. Wang, 2002. Fine genetic mapping and physical delimitation of the lesion mimic gene Spl11 to a 160-kb DNA segment of the rice genome. Mol. Genet. Genomics 268: 253–261. [DOI] [PubMed] [Google Scholar]
- Zou, J. H., X. B. Pan, Z. X. Chen, J. Y. Xu, J. F. Lu et al., 2000. Mapping quantitative trait loci controlling sheath blight resistance in two rice cultivars (Oryza sativa L.). Theor. Appl. Genet. 101: 569–573. [Google Scholar]