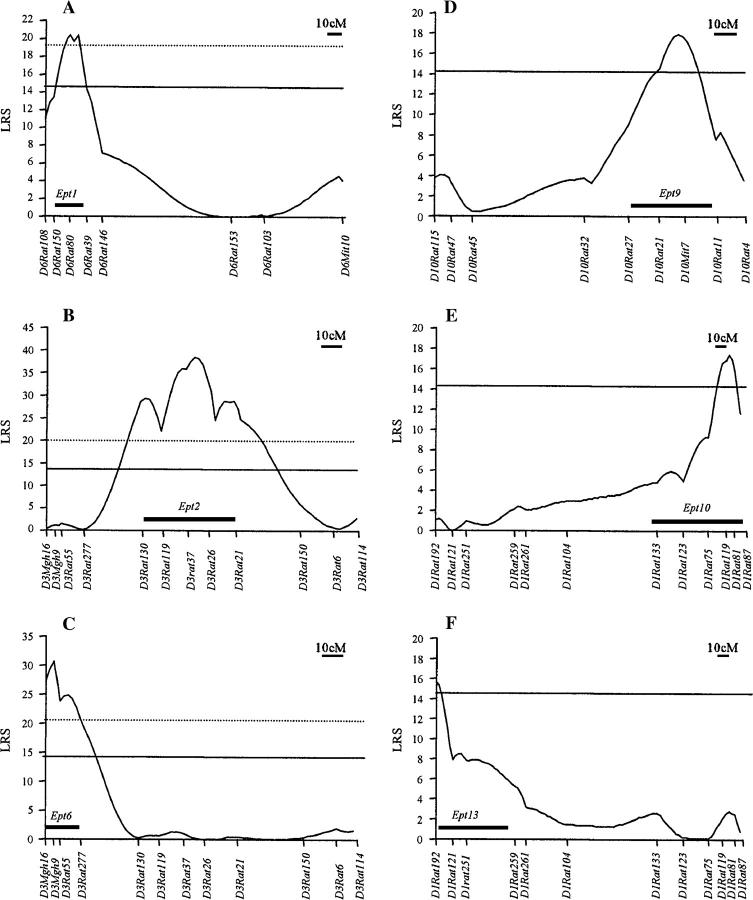
Figure 2.—
Six quantitative trait loci determine sensitivity to DES-induced pituitary growth in F2 progeny from reciprocal crosses between the ACI and COP rat stains. Genotypes were determined at the indicated polymorphic SSLP markers for a total of 264 phenotypically defined F2 progeny from reciprocal crosses between the ACI and COP strains. Each horizontal axis represents the genetic map of the indicated rat chromosome in Haldane centimorgans and the markers at which genotypes were determined. Each vertical axis represents the LRS value for the correlation between log10-transformed pituitary mass and genotype along each chromosomal interval as determined by CIM. Each solid box represents the bootstrapping-derived confidence interval. (A) Ept1 is defined by an LRS peak of 20.4 at D6Rat80 and a confidence interval of ∼15 cM extending from D6Rat150 to D6Rat39. Permutation-derived thresholds for significant (14.3; solid line) and highly significant (19.6; dotted line) evidence of a QTL are shown. (B) Ept2 is defined by an LRS peak of 38.4 between D3Rat37 and D3Rat26 and a confidence interval of ∼48 cM from D3Rat130 to D3Rat21. Permutation-derived thresholds for significant (13.7; solid line) and highly significant (20.0; dotted line) evidence of a QTL are shown. (C) Ept6 is defined by an LRS peak of 30.6 at D3Mgh9 and a confidence interval of ∼17 cM from D3Mgh16 to D3Rat277. Permutation-derived thresholds for significant (14.0; solid line) and highly significant (20.5; dotted line) evidence of a QTL are shown. (D) Ept9 is defined by an LRS peak of 17.9 between D10Rat21 and D10Mit7 and a confidence interval of ∼35 cM from D10Rat27 to D10Rat11. The permutation-derived threshold (14.1) for significant evidence of a QTL is shown. (E) Ept10 is defined by an LRS peak of 17.4 between D1Rat119 and D1Rat81 and a confidence interval of ∼60 cM from D1Rat133 to D1Rat81. The permutation-derived threshold (14.2) for significant evidence of a QTL is shown. (F) Ept13 is defined by an LRS peak of 15.6 at D1Rat192 and a confidence interval of ∼57 cM from D1Rat192 to D1Rat259. The permutation-derived threshold for significant (14.5) evidence of a QTL is shown.

