Abstract
We report an electrochemical method for the sequence-specific detection of unpurified amplification products of the gyrB gene of Salmonella typhimurium. Using an asymmetric PCR and the electrochemical E-DNA detection scheme, single-stranded amplicons were produced from as few as 90 gene copies and, without subsequent purification, rapidly identified. The detection is specific; the sensor does not respond when challenged with control oligonucleotides based on the gyrB genes of either Escherichia coli or various Shigella species. In contrast to existing sequence-specific optical- and capillary electrophoresis-based detection methods, the E-DNA sensor is fully electronic and requires neither cumbersome, expensive optics nor high voltage power supplies. Given these advantages, E-DNA sensors appear well suited for implementation in portable PCR microdevices directed at, for example, the rapid detection of pathogens.
Keywords: E, DNA, methylene blue, Salmonella gyrB, polymerase chain reaction
The species-specific identification of pathogenic bacteria poses a pressing problem with impacts ranging from food safety to the detection of biowarfare agents. For example, it has been shown that the early identification of bacterial pathogens can significantly reduce the breadth and severity of outbreaks of food-borne diseases (1), outbreaks that are responsible for ≈76 million illnesses, 325,000 hospitalizations, and 5,000 deaths per year in the United States alone (2). Current methods for the detection and identification of bacteria, however, are complex and slow; because the minimum infectious doses of food-borne pathogens such as Escherichia coli, Listeria monocytogenes, and Salmonella are very low (3, 4), the detection of clinically relevant levels of contamination generally requires amplification of the infectious organism via laboratory culturing over the course of 1 to several days (5, 6).
The PCR-based amplification of pathogen-specific DNA, rather than the pathogens themselves, offers a potentially promising means of avoiding cumbersome, time-consuming culturing steps and achieving the rapid and reliable identification of microbes. Unfortunately, however, the methods traditionally used for the detection of PCR-amplified DNA, which include Southern blots and capillary electrophoresis (CE), are rather unwieldy, and, thus, PCR-based assays are typically limited to laboratory settings. In response to this problem, a number of more convenient, field-portable PCR detection schemes have been described in recent years (7, 8). In particular, because microfluidic techniques allow the miniaturization of PCR reactions to single-chip dimensions, there has been much interest in the development of a PCR-amplification/detection platform integrated onto a single integrated microdevice (9). The first such approach used the optical detection of PCR products via intercalating dyes that report on the presence of double-stranded DNA (10, 11). PCR, however, is often promiscuous, producing spurious amplification products (12, 13) that produce false positives unless sequence-specific detection is used. Follow-on approaches solved this problem by employing optical molecular beacons for detection (e.g., the TaqMan assay; ref. 14) that, because of their sequence specificity, largely avoid false positives associated with nonspecific amplification products. Nevertheless, although such fluorescence-based methods are sufficiently sensitive and specific for PCR product detection under realistic field conditions, they generally require power-intensive laser light sources and high numerical aperture optics (15) that preclude their use in truly miniaturized devices. Similarly, although PCR has been integrated with size-specific CE detection on single-chip microfluidic platforms (16, 17), CE systems generally operate at relatively high voltages (1–10 kV), rendering the approach less than ideal as a portable detection scheme (18, 19).
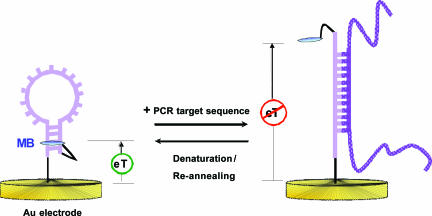
In previous work we (20) and others (21–23) have developed a reagentless, electrochemical biosensor termed E-DNA wherein a redox-labeled DNA stem-loop covalently attached to an interrogating electrode produces an electrochemical signal when hybridized to its target sequence (Fig. 1). In this work, we report the sequence-specific electrochemical detection of PCR products by using the E-DNA sensor, which may open the path toward effective, field-portable sample-to-answer pathogen identification.
Fig. 1.
An E-DNA-based PCR sensor fabricated by self-assembly of a MB-labeled DNA probe on a gold electrode surface. In the absence of a target, the stem-loop structure holds the MB tag in proximity to the electrode surface, thus enabling efficient electron transfer. Upon hybridization with the target PCR amplicon, a large change in the reduction peak current of MB is observed. A room temperature distilled water wash is sufficient to disrupt hybridization and reset this reagentless, electrochemical sensor.
Results
We selected the detection of PCR amplicons from the gyrB gene of Salmonellatyphimurium as a model system. This gene, which encodes the B subunit of DNA gyrase, is present in all bacterial species and, because it exhibits a relatively high rate of molecular evolution, enables the differentiation of even closely related species. In support of this claim, the 17-base sequence we are monitoring in this study, 5′-AACAAGAATAAAACGCC-3′, is unique to Salmonella (24), thus lending itself to the specific identification of Salmonella among similar enteric bacterial species.
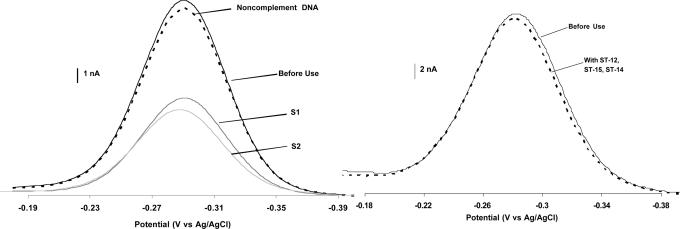
The E-DNA sensor retains its initially reported sensitivity and specificity when used directly in PCR buffer for the detection of the gyrB amplicon. In absence of gyrB DNA, a defined methylene blue (MB) reduction peak is observed from the modified electrode at −0.29 V vs. Ag/AgCl (Fig. 2). This potential is ≈50 mV more negative than the standard reduction potential (Eo) of MB obtained in a neutral buffer, presumably due to the slightly alkaline pH used here (25). As expected, in the presence of 400 nM of synthetic analogs of the gyrB PCR products, we observe robust, 48–55% decreases in E-DNA signal (Fig. 2Left). Previous studies indicate that the E-DNA sensor is highly sequence specific, a claim that is critical for its performance as a PCR detection technique. Consistent with this claim, we find that both 2 μM of an unrelated control sequence (Fig. 2Left) and 200 nM of each of three control sequences derived from the equivalent sections of the E. coli, Shigella flexneri, and Shigella sonnei gyrB genes (Fig. 2Right) produce inconsequential decreases in E-DNA signal, indicating our sensor is sufficiently specific to readily discriminate between these species. Lastly, the stability of the E-DNA sensor in PCR buffer is comparable to that observed in previous studies; we do not observe any significant probe degradation over 5 h before target interrogation (data not shown).
Fig. 2.
The E-DNA sensor is sensitive, reusable, and highly sequence-specific. (Left) Shown are baseline-subtracted AC voltammograms for the E-DNA sensor before hybridization, after incubation with 2 μM of a low-identity target DNA, and after challenge with 400 nM of two synthetic DNAs (S1 and S2) equivalent to the Salmonella-specific gyrB PCR amplicons we are investigating here. (Right) The sequence specificity of E-DNA is sufficient for species-specific detection. Shown are baseline-subtracted AC voltammograms for the E-DNA sensor before and after incubation with 200 nM (each) of target DNA comprised of sequences from the gyrB genes of S. flexneri, S. sonnei, and E. coli. Hybridization time was fixed at 30 min for all experiments.
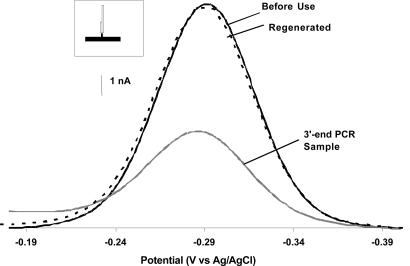
Using the PCR/E-DNA assay to monitor a 3′ terminal target sequence (in a 100-base amplicon), we can detect the equivalent of as few as 90 Salmonella cells (Fig. 3). Starting from 500 fg of Salmonella genomic DNA (corresponding to 90 cell equivalents), we obtain ≈250–300 nM of the appropriate amplification product. With a sample volume of 94 μl, this concentration corresponds to ≈25 pmol of PCR products. After ex situ hybridization (45 min) of the E-DNA sensor with this PCR sample, we observe a ≈61% drop in the MB reduction current, which is indicative of the presence of the expected target. To ensure that the decrease in current is not originating from electrode fouling or degradation of the probe DNA, sensor regeneration is crucial with signal-off devices such as used here. Using a short deionized water rinse (23), we successfully recover close to 100% of the original sensor signal, indicating the observed signal drop arises because of hybridization with the PCR amplicons. Of note, the E-DNA sensor is thus reusable and can be challenged with synthetic PCR target more than eight consecutive times without exhibiting unacceptable (>10%) sensor degradation (data not shown).
Fig. 3.
E-DNA: A reagentless, reusable means for the electrochemical detection of unpurified PCR amplicons. Shown are baseline-subtracted AC voltammograms from the E-DNA sensor before use, after incubation with PCR products containing the relevant 17-base recognition element at their 3′-end (illustrated in Inset), and after regeneration via a simple, room temperature rinse with distilled water. Of note, these data were collected directly in the PCR buffer without any purification of the PCR products.
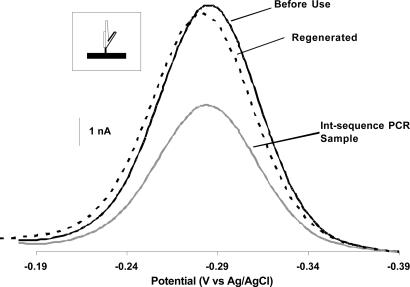
In the above study, we minimized steric effects that might reduce hybridization to the electrode-bound primer by employing the compliment of one of the PCR primers as a target sequence. This approach places the target at the 3′ termini of the 100-base PCR amplicon, which may improve hybridization and, thus, sensitivity. Because the fidelity of PCR is rarely perfect, however, inappropriately amplified contaminants containing the primer sequence (and, thus, the complimentary target sequence) are sometimes present at high levels in PCR products. To avoid this potentially important source of false positives, we designed a second set of primers that generate a 99-base PCR amplicon (termed the int-PCR amplicon) containing the binding sequence displaced 48 bases from the 3′ end of the product. Using the int-PCR/E-DNA assay, we can detect as few as 180 Salmonella cells (Fig. 4); starting from 1 pg of Salmonella genomic DNA, we obtain ≈60–90 nM (≈7 pmol) of the appropriate, single-stranded amplification product. After incubation (90 min) with this material, we observe a 41% drop in the MB reduction signal, which is indicative of the presence of the expected target sequence. Similar to the 3′ end system, close to 95% of the depressed signal was recovered via a short deionized water rinse.
Fig. 4.
The E-DNA sensor readily detects unpurified PCR products by targeting an internal 17-base recognition element (illustrated in Inset). Shown are baseline-subtracted AC voltammograms for the E-DNA sensor before use, after incubation with PCR products in which the 17-base recognition element is 48 bases from the 3′ end, and after regeneration.
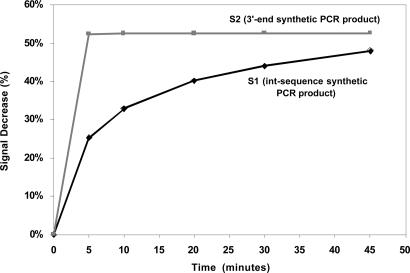
The E-DNA-based detection of PCR products is fairly rapid relative to the tens of minutes generally required for PCR itself. We find that synthetic oligonucleotides (used for the ease with which they can be quantified) equivalent to the int-PRC and 3′ end PCR amplicons produce similarly large, readily measurable signal changes after a fixed incubation time of 30 min (Fig. 2Left). However, although the final change in the MB reduction current is similar for both systems, their detailed hybridization kinetics differ significantly; whereas the sensor signal saturates in <5 min for the 3′ end target, the int-PCR target sequence target requires >45 min to attain maximum signal (Fig. 5). Given the complexity of the E-DNA detection mechanism, it entails competitive inter- and intramolecular hybridization on a heterogeneous electrode surface, it is difficult to ascertain with certainty the origins of this discrepancy. Nevertheless, it seems likely that steric occlusion arising from the 48-base overhang of the int-PCR target renders hybridization less kinetically accessible for this construct.
Fig. 5.
The E-DNA sensor response time is rapid when compared to the tens of minutes typically required for PCR amplification. The slower hybridization observed for the int-PCR target may be due to steric hindrance arising from the 48 bases overhang at this target’s 3′ end.
Discussion
E-DNA allows for the rapid, sequence-specific identification of unpurified PCR products without light sources, optics, or high voltage power supplies. The E-DNA sensor responds well to target sequences located either internally or at the termini of PCR amplicons and can be used directly in PCR-compatible buffers. The sensor is also electronic, label-free, and largely reusable, attributes that will likely render E-DNA/PCR still more useful for the rapid, specific detection of pathogens in field applications such as point-of-care diagnostics.
E-DNA compares very favorably to other electrochemical methods for the on-chip detection of PCR amplicons. For example, recent advances in electrochemical PCR sensors involving the use of intercalating dyes require posthybridization surface manipulation, rendering the approach a multiple-step process (26). An alternative, label-free electrochemical detection technique based on guanine oxidation (27–29) will suffer high background if there is nonspecific adsorption of guanine-containing sequences to the sensor surface. In contrast, all of the E-DNA components are covalently attached to the electrode surface, rendering the approach reagentless and single step. And because E-DNA signaling occurs via a specific, binding-induced conformational change, the approach is extremely insensitive to nonspecific binding (the sensor works even when placed directly in blood serum, soil samples, and foodstuffs; A. A. Lubin, R.Y.L., A.J.H., and K.W.P., unpublished data).
In addition to the above described advantages associated with the E-DNA-based detection of PCR amplicons, electrochemical DNA sensors are, in general, highly parallelizable, thus providing a ready means for the simultaneous monitoring of multiple targets. Recently, for example, we have demonstrated the selective modification of individual elements of microfabricated electrode arrays with multiple-probe DNAs (30). Because the preparation of the E-DNA sensor is quite straightforward, the entire setup can conveniently be prepared and generalized to be consistent with chip-based sensors. The reagentless detection described here thus appears well suited for the on-chip detection of PCR products for diagnostic and defense-related applications.
Materials and Methods
The probe sequence, a thiol- and amine-modified oligonucleotide containing both the compliment to the SalmonellagyrB gene and stem-forming termini, was obtained from BioSource International (Foster City, CA). We have replaced the organo-metallic ferrocene label originally used with MB, a fully organic redox reporter. Unlike ferrocene, MB is stable to nucleophilic attack and readily used at even high levels of chloride. In addition, MB is a known DNA intercalator and, thus, inserts into the stem double helix (31). This intercalation limits the diffusion of the label and thereby improves the electrochemical performance. Thus, in our current probe design, a MB reporter group was conjugated to the 3′ end of the amino- and thiol-modified stem-loop oligonucleotide through succinimide ester coupling (MB-NHS, EMP Biotech, Berlin) producing the probe sequence: 5′-HS-(CH2)6-GCAGTAACAAGAATAAAACGCCACTGC-(CH2)7-NH2-MB-3′.
To accurately calibrate the response of the E-DNA sensor, we used synthetic PCR targets and control sequences (Sigma-Genosys, The Woodlands, TX). Their base sequences are as follows (target sequence underlined). Int-PCR sequence (S1): 5′-TTCGGTGGAGAAATAGAAGATATTCGGGTGGATCGGCGTTTTATTCTTGTTCAGATATTCAACAAACGCCTTGATGCCGCCTCTGTAGTGGAAATGATC-3′; 3′-end PCR sequence (S2): 5′-GGAAACCATCGTTCCACTGCAGCGCTACTTCCACGCCGATACCGTCTTTTTCGGTGGAGAAATAGAAGATATTCGGGTGGATCGGCGTTTTATTCTTGTT-3′; noncomplimentary control sequence (ST-1): 5′- ACTGGCCGTCGTTTTAC-3′.
Control sequences derived from gyrB genes of E. coli, S. flexneri and S. sonnei. ST-12 (S. flexneri and E. coli): 5′- CACTTCAACGCCAAT-3′; ST-15 (E. coli): 5′- AACGCCGATACCG-3′; ST-14 (S. sonnei): 5′- TCTTTTTCAGTGGAGAA-3′.
Reagents and Instrumentation.
Reagent grade chemicals, including 6-mercapto-1-hexanol (C6-OH), hydrogen peroxide (30%), sulfuric acid, and magnesium chloride (all from Aldrich), potassium phosphate monobasic, dibasic, and sodium chloride (Fisher Scientific) were used without further purification. TaqDNA polymerase and its buffer components were also obtained from Fisher Scientific.
All electrochemical measurements were performed at room temperature by using a CHI 730B Electrochemical Workstation (CH Instruments, Austin, TX). Alternating current voltammograms were recorded from −0.16 V to −0.41 V vs. Ag/AgCl (3 M KCl) with a 10 Hz, 25 mV AC potential. The reported voltammograms are baseline-subtracted such that the absolute current is set to zero.
The electrolyte we used contains 1× PCR buffer [10 mM Tris·HCl, pH 9.0/50 mM KCl/51.2 mM MgCl2/200 μM each dNTP/5 units TaqDNA polymerase (PCR-B)]. The gold working electrodes (0.88 mm2) used in this study were fabricated on a glass plate by using standard microfabrication techniques (R.Y.L., S.-H.L., H.T.S., K.W.P., and A.J.H., unpublished data). The patterned electrodes were cleaned by immersing in piranha (3:1 H2SO4:H2O2) for 5 min and then thoroughly rinsed in deionized water. A platinum wire (6 mm2) was used as the counter electrode. All electrode potentials are reported versus a Ag/AgCl (3 M KCl) reference electrode.
E-DNA Sensor Preparation and Hybridization.
MB-DNA was dissolved in 10 mM phosphate buffer (pH 7)/5 mM MgCl2/100 mM NaCl solution to a final oligonucleotide concentration of 0.5 μM. The piranha-cleaned electrode was immersed in this aqueous solution for ≈15 min to allow the oligonucleotides to chemisorb on the surface. The electrode was subsequently immersed in a 2 mM C6-OH in 1 M NaCl/10 mM phosphate buffer (pH 7) for ≈2.5 h to displace nonspecifically bound oligonucleotides. Before interrogation with target oligonucleotides, the electrodes were incubated in the electrolyte in which the voltammograms were collected for ≈1 h. To minimize possible secondary structures in the PCR amplicons, all samples were incubated in a boiling water bath for 5 min, and amplicon strand reannealing was retarded by cooling the sample in an ice bath for 5 min before hybridization experiments. The hybridization was performed at room temperature by dipping the MB-DNA-modified electrode into the unpurified PCR product with added MgCl2 (50 mM) for the desired time (45 min or 90 min for 3′ end and internal PCR products, respectively). The electrode was rinsed sequentially with PCR buffer before being transferred to the fresh PCR buffer for electrochemical analysis.
Asymmetric PCR Protocol.
To improve the sensitivity and reproducibility of our assay, we used asymmetric PCR technique to generate an excess of single-stranded DNA targets (32–34). Because PCR amplicons are invariably longer than the 17-base probe sequence, PCR primers were designed so that the recognition element is placed either at the 3′ end of the PCR product or 48 bases from the 3′ end (termed int-PCR). SAL3′-F and SAL3′-R were the primers for the 3′ product, whereas SAL1-F and SAL1-R were the primers for the internal, 48-base overhang product (Table 1, which is published as supporting information on the PNAS web site). These primers were designed by using primer design software (35) and obtained from Integrated DNA Technologies (Coralville, IA). Purified S.typhimurium LT2 genomic DNA was obtained from the American Type Culture Collection (Manassas, VA).
Products from primers SAL3′-F and SAL3′-R were generated from a 100-μl PCR mixture consisting of 1× PCR buffer (10 mM Tris·HCl, pH 9.0/50 mM KCl)/1.2 mM MgCl2/80 nM forward primer/400 nM reverse primer/200 μM each dNTP/500 fg of purified genomic template DNA/5 units TaqDNA polymerase. Reactions were performed by using 42 cycles of PCR in a standard thermal cycler. The amplification protocol consisted of 2 min at 95°C followed by 3 cycles of 95°C for 1 min, 50°C for 1 min, and 72°C for 1 min, followed by 39 cycles of 95°C for 30 sec, 50°C for 30 sec, and 72°C for 30 sec. The reaction finished with a 7-min incubation at 72°C to extend any incomplete products.
Products from primers SAL1-F and SAL1-R were generated from a 100-ml mixture containing 1× PCR buffer, 106.7 nM SAL1-F primer, 800 nM SAL1-R primer, 1.2 mM MgCl2, 200 μM each dNTP, 1 pg of purified genomic template DNA, and 5 units TaqDNA polymerase. Reactions were performed by using 48 cycles of PCR in a standard thermal cycler. The amplification protocol consisted of 2 min at 95°C followed by 3 cycles of 95°C for 1 min, 48°C for 1 min, and 72°C for 1 min, followed by 45 cycles of 95°C for 30 sec, 48°C for 30 sec, and 72°C for 30 sec. The reaction finished with a 7-min incubation at 72°C to extend any incomplete products. Asymmetric PCR assays traditionally employ forward and reverse primers in a 1:100 ratio (36). This process leads to rapid depletion of the limiting primer during the exponential amplification, followed by linear amplification of the strand extended from the excess primer. In our study, in contrast, we set the forward to reverse primer ratio below 1:10 to increase the efficiency of the asymmetric reaction. With this primer ratio, we obtain ssDNA yields of 60–300 nM (for the 3′ end and internal products, respectively; see, which are published as supporting information on the PNAS web site), which is rather high for asymmetric PCR systems.
To quantify our yield of single-stranded products, we separated 6-μl aliquots on a 2% agarose gel containing 1× GelStar nucleic acid stain (Cambrex, East Rutherford, NJ) followed by fluorescence detection with a scanning fluorescence imaging system (Storm 840, Amersham Pharmacia). A serial dilution of the synthetic single-stranded oligonucleotide with the same sequence was used to define the linear (r2 > 0.98 for both targets) calibration curves used to quantify the production of single-stranded PCR product. The amplicon sequences were confirmed by DNA sequencing (University of California, Berkeley Sequencing Facility, Berkeley, CA).
Supplementary Material
Acknowledgments
This research was supported by Center for Nanoscience Innovation for Defense Grant DMEA90-02-2-0215 and the Institute for Collaborative Biotechnologies Grant DAAD19-03-D-0004.
Abbreviation
- MB
methylene blue
Footnotes
Conflict of interest statement: No conflicts declared.
References
- 1.Tappero J. W., Schuchat A., Deaver K. A., Mascola L., Wenger J. D. J. Am. Med. Soc. 1995;273:1118–1122. doi: 10.1001/jama.1995.03520380054035. [DOI] [PubMed] [Google Scholar]
- 2.Mead P. S., Slutsker L., Dietz V., McCaig L. F., Bresee J. S., Shapiro C., Griffin P. M., Tauxe R. V. Food-Related Illness and Death in the United States. Atlanta: Centers Dis. Control Prevent.; 1999. [DOI] [PMC free article] [PubMed] [Google Scholar]
- 3.Bopp C. A., Brenner F. W., Fields P. I., Wells J. G., Strockbine N. A. In: Manual of Clinical Microbiology. Murray P. R., Braron E. J., Jorgensen J. H., Pfaller M. A., Yolken R. H., editors. Washington, DC: Am. Soc. Microbiol.; 2003. pp. 654–671. [Google Scholar]
- 4.Boyce T. G., Swerdlow D. L., Griffin P. M. N. Engl. J. Med. 1995;333:364–368. doi: 10.1056/NEJM199508103330608. [DOI] [PubMed] [Google Scholar]
- 5.United States Department of Agriculture Animal and Plant Health Inspection Services . The national poultry improvement plan. Subasesart B. Bacteriological examination procedure 147–11. Laboratory procedure recommended for the bacteriological examination of Salmonella. Washington, DC: U.S. Depart. Agric.; 1996. pp. 14–19. [Google Scholar]
- 6.Ferretti R., Mannazu I., Cocolin L., Comi G., Clementi F. Appl. Environ. Microbiol. 2001;69:977–978. doi: 10.1128/AEM.67.2.977-978.2001. [DOI] [PMC free article] [PubMed] [Google Scholar]
- 7.Tani H., Noda N., Yamada K., Kurata S., Tsuneda S., Hirata A., Kanagawa T. J. Agric. Food Chem. 2005;53:2535–2540. doi: 10.1021/jf048031r. [DOI] [PubMed] [Google Scholar]
- 8.Carcia-Canas V., Cifuentes A., Gonzalez R. Anal. Chem. 2004;76:2306–2313. doi: 10.1021/ac035481u. [DOI] [PubMed] [Google Scholar]
- 9.Ferrari M., Cremonesi L., Bonini P., Sternirri S., Foglieni B. Expert Rev. Mol. Diagn. 2005;5:183–192. doi: 10.1586/14737159.5.2.183. [DOI] [PubMed] [Google Scholar]
- 10.Li H., Xue G., Yeung E. S. Anal. Chem. 2001;73:1537–1543. doi: 10.1021/ac001125p. [DOI] [PubMed] [Google Scholar]
- 11.Garcia-Canas V., Gonzalez R., Cifuentes A. J. Agric. Food Chem. 2002;50:4497–4502. doi: 10.1021/jf025585q. [DOI] [PubMed] [Google Scholar]
- 12.Krawczak M., Reiss J., Schmidtke J., Rosler U. Nucleic Acids Res. 1989;17:2197–2201. doi: 10.1093/nar/17.6.2197. [DOI] [PMC free article] [PubMed] [Google Scholar]
- 13.Akbari M., Hansen M. D., Halgunset J., Skopen F., Krokan H. E. J. Mol. Diagn. 2005;7:36–39. doi: 10.1016/s1525-1578(10)60006-2. [DOI] [PMC free article] [PubMed] [Google Scholar]
- 14.Matsubara V., Kerman H., Kobayashi M., Yamamura S., Morita V., Takamura Y., Tamiya E. Anal. Chem. 2004;76:6434–6439. doi: 10.1021/ac0497149. [DOI] [PubMed] [Google Scholar]
- 15.Bordini R., Germini A., Mezzelani A., Marchelli R., De Bellis G. J. Agric. Food Chem. 2005;53:912–918. doi: 10.1021/jf0486949. [DOI] [PubMed] [Google Scholar]
- 16.Kelly R. T., Woolley A. T. Anal. Chem. 2005;77:96A–102A. doi: 10.1021/ac0501083. [DOI] [PubMed] [Google Scholar]
- 17.Lagally E. T., Medintz I., Mathies R. A. Anal. Chem. 2001;73:565–570. doi: 10.1021/ac001026b. [DOI] [PubMed] [Google Scholar]
- 18.Koh C. G., Tan W., Zhao M-Q., Ricco A. J., Fan Z. H. Anal. Chem. 2003;75:4591–4598. doi: 10.1021/ac0343836. [DOI] [PubMed] [Google Scholar]
- 19.Zabzdyr J. L., Lillard S. J. Anal. Chem. 2001;73:5771–5775. doi: 10.1021/ac0155714. [DOI] [PubMed] [Google Scholar]
- 20.Fan C., Plaxco K. W., Heeger A. J. Proc. Natl. Acad. Sci. USA. 2003;100:9134–9137. doi: 10.1073/pnas.1633515100. [DOI] [PMC free article] [PubMed] [Google Scholar]
- 21.Immoos C. E., Lee S. J., Grinstaff M. W. J. Am. Chem. Soc. 2004;126:10814–10815. doi: 10.1021/ja046634d. [DOI] [PubMed] [Google Scholar]
- 22.Immoos C. E., Lee S. J., Grinstaff M. W. Chembiochem. 2004;5:1100–1104. doi: 10.1002/cbic.200400045. [DOI] [PubMed] [Google Scholar]
- 23.Mao T., Luo C., Ouyang Q. Nucleic Acids Res. 2003;31:108–172. doi: 10.1093/nar/gng108. [DOI] [PMC free article] [PubMed] [Google Scholar]
- 24.Kakimura K., Fukushima M., Kawaguchi R. Biotechnol. Bioeng. 2003;83:721–726. doi: 10.1002/bit.10709. [DOI] [PubMed] [Google Scholar]
- 25.Kelly S. O., Barton J. K., Jackson N. M., Hill M. G. Bioconjugate Chem. 1997;8:31–37. doi: 10.1021/bc960070o. [DOI] [PubMed] [Google Scholar]
- 26.Lee T. M. H., Hsing I.-M. Anal. Chem. 2002;74:5057–5062. doi: 10.1021/ac020068s. [DOI] [PubMed] [Google Scholar]
- 27.Ariksoysal D. O., Karadeniz H., Erdem A., Sengonul A., Sayiner A. A., Ozsoz M. Anal. Chem. 2005;77:4908–4917. doi: 10.1021/ac050022+. [DOI] [PubMed] [Google Scholar]
- 28.Ozkan D., Erdem A., Kara P., Kerman K., Meric B., Hassmann J., Ozsoz M. Anal. Chem. 2002;74:5931–5936. doi: 10.1021/ac0257905. [DOI] [PubMed] [Google Scholar]
- 29.Holmberg R. C., Thorp H. H. Inorg. Chem. 2004;43:5080–5085. doi: 10.1021/ic049895x. [DOI] [PubMed] [Google Scholar]
- 30.Lai R. Y., Lee S.-H., Soh H. T., Plaxco K. W., Heeger A. J. Langmuir. 2006;22:1932–1936. doi: 10.1021/la052132h. [DOI] [PubMed] [Google Scholar]
- 31.Boon E. M., Jackson N. M., Wightman M. D., Kelly S. O., Hill M. G., Barton J. K. J. Phys. Chem. B. 2003;107:11805–11812. [Google Scholar]
- 32.Wei Q., Liu S. Z., Huang J. F., Mao X. Y., Chu X. H., Wang Y., Qiu M. Y., Mao Y. M., Xie Y., Li Y. J. Biochem. Mol. Biol. 2004;37:439–444. doi: 10.5483/bmbrep.2004.37.4.439. [DOI] [PubMed] [Google Scholar]
- 33.Szilvasi A., Andrikovics H., Kalmar L., Bors A., Tordai A. Clin. Biochem. 2005;38:727–730. doi: 10.1016/j.clinbiochem.2005.04.015. [DOI] [PubMed] [Google Scholar]
- 34.Poddar S. K. Mol. Cell. Probes. 2000;14:25–32. doi: 10.1006/mcpr.1999.0278. [DOI] [PubMed] [Google Scholar]
- 35.Rosen S., Skaletsky H. J. In: Bioinformatics Methods and Protocols: Methods in Molecular Biology. Misener S., Kravetz S. A., editors. Totowa, NJ: Humana; 2000. pp. 365–386. [Google Scholar]
- 36.Gyllensten U. B., Erlich H. A. Proc. Natl. Acad. Sci. USA. 1988;85:7652–7656. doi: 10.1073/pnas.85.20.7652. [DOI] [PMC free article] [PubMed] [Google Scholar]
Associated Data
This section collects any data citations, data availability statements, or supplementary materials included in this article.


