Abstract
Controversy continues both as to which wavelengths of sunlight cause melanoma and the mechanisms by which these different wavelengths act. Direct absorption of UVB by DNA is central in albino animal models, but melanin-pigmented models have shown major contributions by wavelengths longer than UVB that are thought to be mediated by photosensitized oxidant production. The only model for which the action spectrum of melanoma causation is known is a genetically melanoma-susceptible specific cross of Xiphophorus fish. We used electron paramagnetic resonance to quantitatively detect the UV induction of reactive melanin radicals in situ in the melanin-containing cells in the skin of this model and derived the action spectrum for melanin-photosensitized oxidant production (Φox). This action spectrum was identical to that for melanoma induction (Φmel). These results confirm the hypothesis that melanin-photosensitized radical production is the major causative step of melanoma in this model and demonstrate that the wavelengths and mechanisms of melanoma causation in different models are dependent on the presence of melanin. This approach should be applicable to humans, thus providing an accurate surrogate for Φmel for prevention studies.
Keywords: action spectrum, free radical
Cutaneous malignant melanoma incidence continues to increase (1), yet prevention strategies are hindered by a lack of knowledge of which wavelengths of sunlight cause melanoma, and the mechanisms by which these different wavelengths cause melanoma are not understood. Although nonmelanoma skin cancers are predominantly caused by UVB wavelengths, melanoma causation has efficiently been observed by wavelengths longer than UVB, such as UVA, with this observation supported by both experimental animal (2–4) and human epidemiological evidence (5–7). However, the role of UVA in melanoma causation still remains controversial (8, 9). Similarly, there is controversy over the mechanisms by which these different wavelengths act. The prevailing view is that UVA leads to DNA photooxidation, with melanin thought to be the important photosensitizer when present, whereas UVB leads to pyrimidine dimer formation through direct absorption by DNA (6, 10). The relative importance of UVB and UVA in these processes is, however, currently under scrutiny, because some have found that UVA appears able to produce pyrimidine dimers in cultured cells (11, 12), whereas melanin can act as an efficient UVB sensitizer in vivo (13), and so these questions need further investigation.
The question of which wavelengths cause a biological effect, in this case melanoma, is best evaluated through measuring the wavelength dependence of that effect to generate its action spectrum (14). Although melanoma has been observed in many species (15), there is only one model in which the action spectrum of melanoma causation has been determined, namely select interspecies crosses of Xiphophorus fish (4, 16). Despite the phylogenetic distance between Xiphophorus and humans, and the differences in skin structures that may modify penetration of different wavelengths of UV light, the potential importance of this action spectrum (4) is great. Convolution of this action spectrum with typical solar terrestrial irradiance spectra suggests that an overwhelming preponderance of melanomas may be caused by UVA (4) with contributions by even wavelengths as long as 547 nm perhaps being important (17). The search for what makes wavelengths longer than UVB relatively more effective in causing melanoma than other skin cancers has focused on differences between melanocytes and keratinocytes, especially the role of melanin as an endogenous photosensitizer of melanocytes. The insoluble polymer melanin contains stable free radicals, and characterization of these radicals by EPR spectroscopy is a method of choice for its study (18, 19). Central to its role in melanoma causation, however, is that in vitro illumination of melanin by UV and blue light generates further metastable reactive melanin radicals (that might react directly with biological molecules) and that also release reactive oxidants such as superoxide (and hence hydrogen peroxide and potentially hydroxyl radicals) with identical action spectra (20–23) (shown in Reaction 1)
 |
These light-induced melanin radicals are therefore an appropriate surrogate measurement for oxidant release by melanin into melanocytes in situ and have been observed by EPR in UV-irradiated pigmented rabbit skin (24).
We report here the action spectrum of reactive melanin radical formation in situ in the melanin-containing cells of Xiphophorus skin. The correlation between this action spectrum, and that of melanoma causation (4), was excellent, suggesting that oxidants formed in melanocytes by the action of light on melanin play the central role in melanoma causation, at least in this Xiphophorus model. Moreover, the ability of this action spectrum to replicate that of melanoma causation could, on appropriate validation, lead to the use of this technique to provide mechanistically derived surrogates in species (such as humans) in which acquisition of the “real” action spectrum of melanoma causation is not possible. Finally, the ability to measure the effects of sunscreens on this action spectrum could provide a badly needed measure (14) of their ability to screen out melanoma-causing wavelengths.
Results and Discussion
Measurement of Metastable Reactive Melanin Radicals in Xiphophorus.
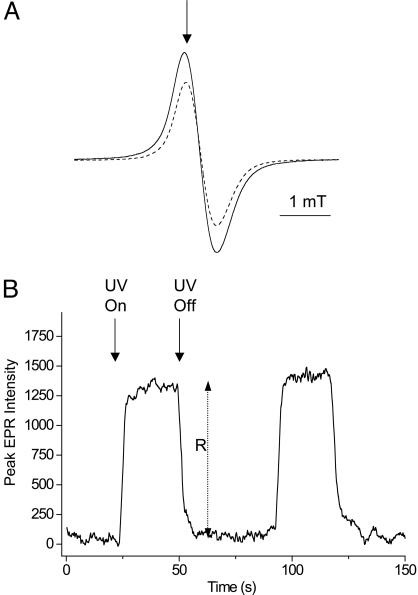
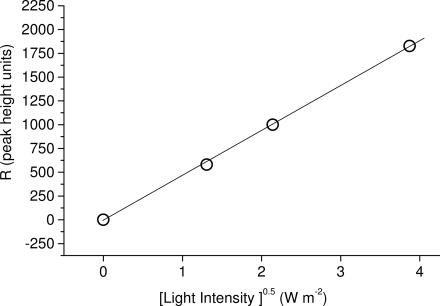
For the derivation of action spectra, the melanin radical was first observed by EPR spectroscopy, as shown in Fig. 1A (dashed line). It was then verified that UV resulted in an increase in the signal, as shown in Fig. 1A (solid line). In nonpigmented fish, the melanin EPR signal was not present, either at baseline or under UV irradiation. The magnetic field then was fixed to the first derivative maxima of the melanin radical (as shown by the arrow in Fig. 1A), the sample was exposed by opening a shutter until the signal reached a steady state, and the increase in signal height R (shown in Fig. 1B) was measured (20). The shutter then was closed for at least three times the period it took for the additional signal, R, to decay to preexposure levels and then reexposed. A segment of a representative trace in shown in Fig. 1B. Each sample was measured three times at each wavelength. The interference filters were changed according to a randomized protocol on each sample, although neither bleaching nor activation was observed in repeated cycles (data not shown). In nonpigmented fish, the melanin EPR signal was not present, either at baseline or under UV irradiation. The data were analyzed according to the theoretical backgrounds of Sarna and coworkers (21, 22, 25). Briefly, it was first confirmed that the magnitude of the UV-induced increase in metastable melanin radical signal, R, was proportional to the square root of light intensity for blue light, UVA and UVB wavelengths (representative data for 365 nm shown in Fig. 2). Decay of the signal upon ceasing illumination exhibited second-order kinetics, as reported in refs. 21, 22, and 25. The light-induced increase in metastable melanin radical, R, was then converted to the relative flux of oxidants per photon of specific waveband, Φox, by Eq. 1 (21)
where I is photon flux (photons·sec−1·m−2), 2k is a constant related to the rate of decay of the radical, and R is the steady-state increase in melanin radical intensity. Φox was normalized to 1 for the most efficient wavelength for each sample of adult or juvenile tissues, and the means of four samples were calculated.
Fig. 1.
EPR signals of melanin radicals with or without UV. (A) EPR spectrum of the melanin radical in situ in adult Xiphophorus. Dashed line, without UVA irradiation; solid line, during UV (365-nm waveband) irradiation. The arrow signifies the static magnetic field chosen to perform time-sweep experiments shown in B. (B) Irradiation dependences of metastable reactive melanin radical EPR signal intensity, measured at the field position shown in A, showing measurement of the steady-state increase in melanin radical intensity, R, as a function of modulating UV (in this case 365-nm) irradiation with time.
Fig. 2.
UV-induced increase in metastable reactive melanin radical EPR signal intensity (R) plotted against the square root of light intensity for 365-nm waveband.
Action Spectra for Φox in Adult and Juvenile Xiphophorus.
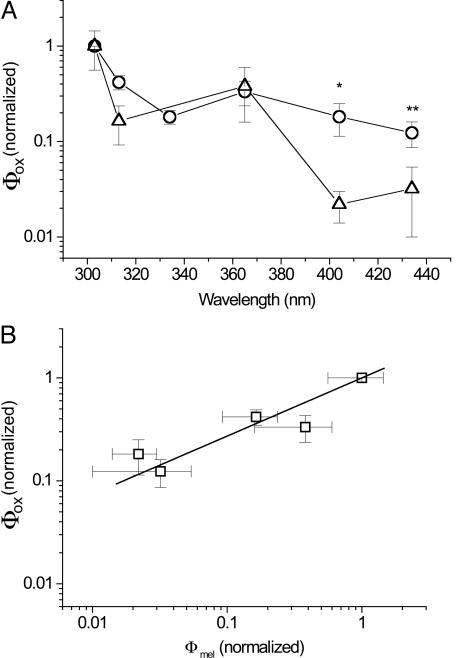
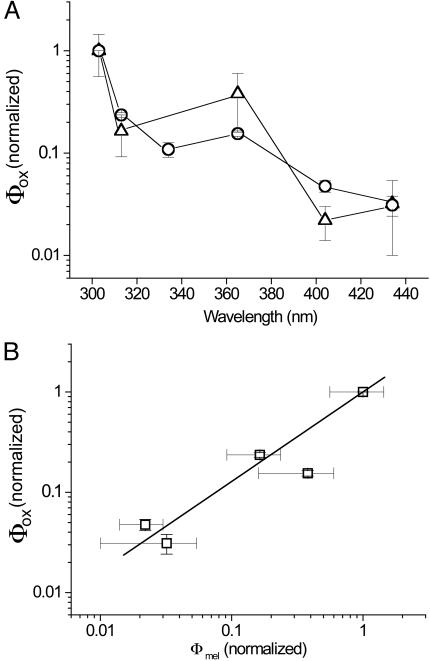
Fig. 3A shows the action spectra of Φox as measured in adult (9-month-old) Xiphophorus together with the action spectrum of melanoma causation Φmel derived by Setlow et al. (4) in the same fish model. Both are normalized at 1.0 at 303 nm. It can be seen that there is a very high degree of similarity between the two action spectra, with maxima at 303 nm, a dip near the UVB/UVA transition, a second smaller peak at 365 nm, and lowered but discernable activity in the violet blue spectrum at 404 and 436 nm. However, there are significant differences between the values of Φox and Φmel at 404 and 436 nm, (P < 0.001 and P = 0.1, respectively) with the value of Φox being greater than Φmel. This result would mean that Φox values in these regions might not accurately represent real values of melanoma causation and hence raise doubt as to the validity of using Φox as a surrogate for Φmel. However, the action spectrum of Φox in Fig. 3A was derived from adult fish, whereas that of Φmel was derived from irradiation of 6-day-old juvenile fish (4).
Fig. 3.
Wavelength dependence of radical formation, Φox, and melanoma causation in adult fish. (A) Action spectra of Φox as measured in adult (9-month-old) Xiphophorus (open circles) together with the action spectrum of melanoma causation Φmel derived in ref. 4 for the same (but juvenile) fish (open triangles) (4). Both are normalized at 1.0 in the 303-nm waveband and shown ± SE. ∗, significant difference at P < 0.001; ∗∗, nonsignificant difference at P = 0.1. (B) Linear regression analysis of the values of each pair of Φox and Φmel data plotted against each other, producing values of Φox = 0.13 + 0.87. Φmel′ correlation coefficient 0.995; P = 0.0005.
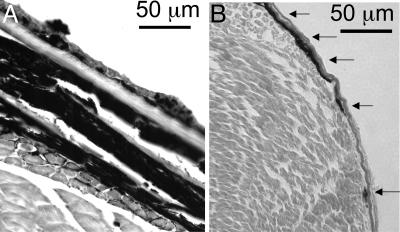
As noted by Setlow et al. (4), “until ≈10 days (age) the fishes’ skin has no distinct layers, but prominent melanin-containing cells lie on the surface of the myotomes.” In contrast, the melanin-containing cells in the adults (melanocytes and melanophores) are primarily dermal (16), or intertwined with and underneath several layers of epidermis and scales. Transverse sections of adult and juvenile fish are shown in Fig. 4, showing this marked difference, with the overall depth of melanotic cells in the juveniles being <10 μm, whereas the total depth of all melanotic cells in adult fish was in the range of 100–150 μm. Because both light scattering and absorption by melanin increase at shorter wavelengths, we therefore believe that the epidermis and scales of the adults might selectively absorb more incident UVB light (in comparison with more penetrating UVA light) before it can reach all of the melanin-containing cells, as opposed to the 6-day-old fish in which the screening of UVB will be lower. Because the action spectrum in Fig. 3A is normalized at UVB wavelengths, this selective screening of UVB in the adults would result in lower values at the short wavelengths and hence lead to an apparent increase in effectiveness at longer wavelengths.
Fig. 4.
Transverse sections of Xiphophorus showing position and thickness of melanotic cells. (A) Adult fish (hematoxylin and eosin stained). (B) Juvenile fish, with melanin visualization enhanced with Fontanna–Masson staining. Superficial melanotic cells in the juvenile fish are shown with arrows.
The experiment therefore was repeated using 6-day-old fish. Again, nonpigmented fish exhibited no melanin EPR spectrum, either at baseline or under UVA irradiation. However, pigmented 6-day-old fish exhibited melanin EPR spectra, the magnitude of which was increased by UVA irradiation in a similar fashion to the adult fish. The action spectrum of Φox therefore was obtained in an identical manner and is presented in Fig. 5A, again with that of melanoma causation, Φmel (4). Again, the general forms of the two spectra are very similar but with a much-improved correlation at 404 and 436 nm. Statistical analysis showed no significant difference between any individual wavelength values of the action spectra of Φmel and Φox in the juvenile fish. When the values of Φmel and Φox at individual wavelengths were plotted against each other and fitted by linear regression, correlation coefficients of 0.995 (P = 0.0005) and 0.996 (P = 0.003) were obtained for the juvenile and adult data, respectively (Figs. 5B and 3B, respectively). However, for the linear regression equation Φox = A + B·Φmel, for the adult A = 0.13 and B = 0.87, whereas for the juveniles A = −0.01 and B = 1.001. Thus, the juvenile data for Φox represents a much better correlate with Φmel than the adult Φox data. Because the action spectrum of Φox reproduces that of Φmel, it can be inferred that UV causation of melanoma in this Xiphophorus model is dominated by melanin photosensitized oxidant production.
Fig. 5.
Wavelength dependence of radical formation, Φox, and melanoma causation in juvenile fish. (A) Action spectra of Φox as measured in juvenile (6-day-old) Xiphophorus (open circles) together with the action spectrum of melanoma causation Φmel derived in the same fish (open triangles) (4). Both are normalized at 1.0 in the 303-nm waveband and shown ± SE. (B) Linear regression analysis of the values of each pair of Φox and Φmel data plotted against each other, producing values of Φox = −0.01 + 1.001. Φmel′ correlation coefficient 0.993; P = 0.003.
The greater importance of longer wavelengths (404 and 436 nm) deriving from selective screening by the thicker layers of melanotic cells in adult fish suggests that these longer wavelengths also may be proportionately more important in melanoma causation in human tissues with a similar distribution of melanocytes, such as melanocytic nevi. These nevi are precursors to melanoma in a significant proportion of human melanomas reported, with estimates ranging from about one-third (26) to two-thirds (27). Such melanotic nevi will provide self-screening of shorter wavelengths, in contrast to the relatively superficial location of most human melanocytes at the epidermal–dermal junction, so that UVA and visible light can penetrate more extensively into the nevus to exert effects on a much greater proportion of nevus cells and therefore have proportionately greater effects in overall malignant transformation of these lesions.
The sensitivity of this highly pigmented fish model to UV causation of melanoma is in contrast to the relative resistance against UV induction of melanomas afforded by darker skin in humans. This finding primarily results from the Xiphophorus model requiring a single mutagenic event (4, 16), whereas human melanoma is a multistage process requiring multiple steps of initiation, promotion, and progression over a period, and so it intrinsically requires much more UV over extended periods. However, contributions from melanin being produced and stored and leading to tumors in different melanocytic cell types in fish (melanophores and macromelanophores) (4, 16) or from differences in skin structure or lowered DNA repair compared with humans also may be important, so direct comparison between the two cases is difficult. The relative resistance of darker-skinned humans to UV induction of melanoma compared with lighter-skinned humans is also complex but likely involves contributions from increases in melanosome size leading to lower fluxes of oxidants from larger melanin aggregates in darker skins (28), increased melanosome/melanin levels in upper epidermal layers protecting underlying melanocytes (29, 30), and the lack of pheomelanin, which is a more powerful photosensitizer than eumelanin (31).
Relevance of the Action Spectrum for Φox to Melanoma Causation in Other Species.
Much evidence suggests that melanin is a major photosensitizer involved in the causation of melanoma by sunlight in pigmented species. In vitro studies of isolated melanin show that it is an efficient photosensitizer, producing a range of oxidizing species (21, 23, 32) that are capable of exerting biological effects such as causing DNA damage (33) and forming lesions such as 8-hydroxydeoxyguanosine that are mutagenic (34, 35). This potential for photosensitization by melanin was supported in this Xiphophorus model, with previous data (n > 600 fish) showing that unpigmented fish did not show melanoma causation on UV irradiation (16). These experimental data are supported by melanoma incidence rates in albinos, a naturally occurring human “melanin-knockout” population: melanoma is very rare in Caucasian albinos (36) with only 27 case reports worldwide up to 2000 (37). Moreover, many of these reported melanomas are in sites not associated with sun induction of melanoma in normal populations (38–41), and so are similarly unlikely to have been caused by solar exposure. Further evidence is found in studies of albino black populations in Africa, who as expected are much more sensitive to UVB-mediated events such as sunburn and skin carcinomas (42) because of the lack of melanin pigment photoprotection in high solar fluxes. However, the incidence of melanoma in this population is exceptionally low (42, 43), supporting the conclusion that melanin is normally the central photosensitizer in melanocytes that is responsible for melanoma causation in humans (44).
Therefore, we propose the action spectra of Φox as a powerful, mechanistically based surrogate for Φmel in melanin-containing species other than Xiphophorus. Importantly, Φox could be measured in human skin, by X-band EPR for excised samples, or in situ and in vivo using low-frequency L-band EPR with surface coils developed for biomedical uses (45–47). Our current efforts are focused on establishing the relationship between Φmel and Φox in the mammal Monodelphis domestica, a pigmented melanoma model in which UVA has been implicated in causation of both melanoma and its precursor lesions (2, 48): a strong positive correlation between Φmel and Φox, similar to that observed here in Xiphophorus, would support the use of action spectra of Φox as surrogates of Φmel in other mammals such as humans. The corollary of these data are that studies of UV causation of melanoma in nonpigmented albino models may better model melanoma causation in albino humans, but not that in pigmented humans. Furthermore, melanoma prevention strategies based on preventing or ameliorating melanocyte oxidative stress may prove more useful than those based on pyrimidine dimer prevention or repair in nonalbino humans (49).
Materials and Methods
Xiphophorus Strains and Usage.
All fish were obtained from the Xiphophorus Genetic Stock Center (www.xiphophorus.org). Experiments using pigmented adults were performed with 9-month-old interspecies hybrids (F1 hybrids) from the cross, X. maculatus Jp 163 B × X. couchianus. This cross results in a dramatic enhancement of the X. maculatus Jp 163 B derived Sp (spotted side) pigment pattern such that F1 hybrids exhibit solid melanization from the pectoral fins posterior to the tail on the flank of the animal. Animals from this interspecies cross were used in studies of UV-wavelength-specific melanoma induction (4). As a control for these pigmented interspecies hybrid fish, adult albino X. helleri (50) were used. For experiments involving juvenile fish, pigmented or unpigmented segregants of first-generation interspecies backcross hybrids (BC1 hybrids) produced from the cross, X. andersi × (X. maculatus Jp 163 B × X. andersi) were used. Melanization of the pigmented BC1 hybrids from this cross phenotypically resemble those of the cross described above. All fish were maintained as pedigreed lines according to standard Xiphophorus Genetic Stock Center protocols. Adult animals were killed, and full-thickness skin then was carefully removed with a fresh razor blade and dissecting tweezers in a filleting motion from the junction of the tail to close to the abdominal cavity, and a portion (≈3 × 5 mm) of this skin was placed in the sample holder (see below), epidermis up. For pigmented fish, the skin was selected from pigmented areas; for nonpigmented fish, skin from the corresponding area was chosen. Six-day-old animals were similarly killed, but because of their small size preventing easy dissection, and the fact that the EPR cavity tuning was not adversely affected, they were simply bisected with a fresh razor blade, and the rearmost third of this section, containing the pigmented areas, was mounted in the sample holder. Transverse sections of formalin-fixed, paraffin-embedded fish were made using conventional techniques, but because melanin visualization was less obvious in juveniles, it was enhanced with Fontanna–Masson staining (51).
UV Irradiation.
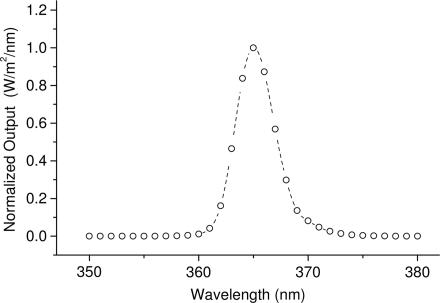
UV light from a 500-W XeHg arc lamp (Oriel, Stamford, CT) was filtered with a dichroic mirror and water filter to remove infrared. Specific Hg line wavebands were isolated by using UV interference filters (Oriel). All wavebands other than UVB (302 and 313 nm) also were filtered with a WG320 filter to remove UVB. A typical example is shown in Fig. 6. Light beams were attenuated by using wire mesh neutral density filters [neutral density was confirmed by using the calibrated scanning spectroradiometer (Model 742, Optronics International, Chelmsford, MA)] (2) to allow dose rate control in some experiments. The filtered light was delivered to the EPR cavity using a liquid light guide, with a custom-built mount to interface the beam collimator with the irradiation grid of the EPR cavity. The spectral emission profile of the light beam for each filter combination with the light guide assembly was determined by using a calibrated scanning spectroradiometer (Optronics Model 742) (2).
Fig. 6.
Spectral profile of the 365-nm irradiation waveband.
EPR Spectroscopy.
The sample was mounted in a specially constructed polytetrafluoroethylene sample cell with a silica UV-transparent window (52) containing a small pad of water-saturated filter paper (10 μl) to prevent any sample desiccation. The sample was placed in the high-sensitivity resonator X-band EPR cavity with an Elexsys E540 EPR spectrometer (Bruker Biospin, Billerica, MA). EPR spectroscopy was performed at X-band (9 GHz) frequencies, using nonsaturating microwave powers and 100-kHz modulation; other parameters are detailed in the figure legends. EPR spectra were recorded by sweeping the magnetic field through resonance (Fig. 1A), whereas action spectrum experiments were performed by fixing the magnetic field at the spectral maximum and recording the signal as a function of UV irradiation (Fig. 1B).
Statistical Analysis.
Student’s t test was performed by using sigma stat 3.0 software (SPSS, Chicago), with means, n, and standard errors from this work and that of Setlow et al. (4). Linear regression was performed by using origin 5.0 software (Microcal, Amherst, MA).
Acknowledgments
We thank Prof. Manfred Schartl (Wurzburg, Germany) for provision of the X. helleri albino stock. EPR instrumentation at the University of New Mexico Health Sciences Center is supported in part by National Institutes of Health Center of Biomedical Research Excellence Grant NCRR P20-RR-15636. UV exposure facilities are supported by National Institute on Environmental Health Sciences Grant P30 ES-012072. This work was supported by American Cancer Society Grant ACSIRG-192 and National Cancer Institute Grant U01 CA 83180. The Brookhaven National Laboratory is operated by Brookhaven Science Associates under contract with the U.S. Department of Energy. Support for the Xiphophorus Genetic Stock Center is provided by National Institutes of Health Grant P40-RR-17072.
Footnotes
Conflict of interest statement: No conflicts declared.
References
- 1.Ries L. A. G., Eisner M. P., Kosary C. L., Hankey B. F., Miller B. A., Clegg L., Mariotto A., Feuer E. J., Edwards B. K. SEER Cancer Statistics Review, 1975–2002. Bethesda: National Cancer Institute; 2004. Available at http://seer.cancer.gov/csr/1975_2002. [Google Scholar]
- 2.Ley R. D. Cancer Res. 1997;57:3682–3684. [PubMed] [Google Scholar]
- 3.Ley R. D. Photochem. Photobiol. 2001;73:20–23. doi: 10.1562/0031-8655(2001)073<0020:drfura>2.0.co;2. [DOI] [PubMed] [Google Scholar]
- 4.Setlow R. B., Grist E., Thompson K., Woodhead A. D. Proc. Natl. Acad. Sci. USA. 1993;90:6666–6670. doi: 10.1073/pnas.90.14.6666. [DOI] [PMC free article] [PubMed] [Google Scholar]
- 5.Moan J., Dahlback A., Setlow R. B. Photochem. Photobiol. 1999;70:243–247. [PubMed] [Google Scholar]
- 6.Wang S., Setlow R., Berwick M., Polsky D., Marghoob A., Kopf A., Bart R. J. Am. Acad. Dermatol. 2001;44:837–846. doi: 10.1067/mjd.2001.114594. [DOI] [PubMed] [Google Scholar]
- 7.Garland C., Garland F., Gorham E. Ann. Epidemiol. 2003;13:395–404. doi: 10.1016/s1047-2797(02)00461-1. [DOI] [PubMed] [Google Scholar]
- 8.Robinson E., Hill R., Kripke M., Setlow R. Photochem. Photobiol. 2000;71:743–746. doi: 10.1562/0031-8655(2000)071<0743:tmmmir>2.0.co;2. [DOI] [PubMed] [Google Scholar]
- 9.De Fabo E. C., Noonan F. P., Fears T., Merlino G. Cancer Res. 2004;64:6372–6376. doi: 10.1158/0008-5472.CAN-04-1454. [DOI] [PubMed] [Google Scholar]
- 10.Black H. S., deGruijl F. R., Forbes P. D., Cleaver J. E., Ananthaswamy H. N., deFabo E. C., Ullrich S. E., Tyrrell R. M. J. Photochem. Photobiol. B. 1997;40:29–47. doi: 10.1016/s1011-1344(97)00021-3. [DOI] [PubMed] [Google Scholar]
- 11.Douki T., Reynaud-Angelin A., Cadet J., Sage E. Biochemistry. 2003;42:9221–9226. doi: 10.1021/bi034593c. [DOI] [PubMed] [Google Scholar]
- 12.Courdavault S., Baudouin C., Charveron M., Favier A., Cadet J., Douki T. Mutat. Res. 2004;556:135–142. doi: 10.1016/j.mrfmmm.2004.07.011. [DOI] [PubMed] [Google Scholar]
- 13.Takeuchi S., Zhang W., Wakamatsu K., Ito S., Hearing V. J., Kraemer K. H., Brash D. E. Proc. Natl. Acad. Sci. USA. 2004;101:15076–15081. doi: 10.1073/pnas.0403994101. [DOI] [PMC free article] [PubMed] [Google Scholar]
- 14.Gasparro F. P. Environ. Health Perspect. Suppl. 2000;108:71–78. doi: 10.1289/ehp.00108s171. [DOI] [PMC free article] [PubMed] [Google Scholar]
- 15.Ley R. Front. Biosci. 2002;7:D1531–D1534. doi: 10.2741/A857. [DOI] [PubMed] [Google Scholar]
- 16.Setlow R. B., Woodhead A. D., Grist E. Proc. Natl. Acad. Sci. USA. 1989;86:8922–8926. doi: 10.1073/pnas.86.22.8922. [DOI] [PMC free article] [PubMed] [Google Scholar]
- 17.Setlow R. B. J. Invest. Dermatol. Symp. Proc; 1999. pp. 46–49. [DOI] [PubMed] [Google Scholar]
- 18.Enochs W., Nilges M., Swartz H. M. Pigm. Cell Res. 1993;6:91–99. doi: 10.1111/j.1600-0749.1993.tb00587.x. [DOI] [PubMed] [Google Scholar]
- 19.Sarna T., Swartz H. Folia Histochem. Cytochem. 1978;16:275–286. [PubMed] [Google Scholar]
- 20.Sarna T., Menon I. A., Sealy R. C. Photochem. Photobiol. 1984;39:805–809. doi: 10.1111/j.1751-1097.1984.tb08863.x. [DOI] [PubMed] [Google Scholar]
- 21.Sarna T., Sealy R. C. Arch. Biochem. Biophys. 1984;232:574–578. doi: 10.1016/0003-9861(84)90575-7. [DOI] [PubMed] [Google Scholar]
- 22.Sealy R. C., Sarna T., Wanner E. J., Reszka K. Photochem. Photobiol. 1984;40:453–459. doi: 10.1111/j.1751-1097.1984.tb04617.x. [DOI] [PubMed] [Google Scholar]
- 23.Korytowski W., Pilas B., Sarna T., Kalyanaraman B. Photochem. Photobiol. 1987;45:185–190. doi: 10.1111/j.1751-1097.1987.tb05362.x. [DOI] [PubMed] [Google Scholar]
- 24.Collins B., Poehler T. O., Bryden W. A. Photochem. Photobiol. 1995;62:557–560. doi: 10.1111/j.1751-1097.1995.tb02384.x. [DOI] [PubMed] [Google Scholar]
- 25.Sarna T., Sealy R. C. Photochem. Photobiol. 1984;39:69–74. doi: 10.1111/j.1751-1097.1984.tb03406.x. [DOI] [PubMed] [Google Scholar]
- 26.Bevona C., Goggins W., Quinn T., Fullerton J., Tsao H. Arch. Dermatol. 2003;139:1620–1624. doi: 10.1001/archderm.139.12.1620. [DOI] [PubMed] [Google Scholar]
- 27.Elder D. E., Greene M. H., Bondi E. E., Clark W. H. In: Pathology of Malignant Melanoma. Ackerman A. B., editor. New York: Masson; 1981. pp. 185–215. [Google Scholar]
- 28.Liu Y., Simon J. D. Pigm. Cell Res. 2003;16:606–618. doi: 10.1046/j.1600-0749.2003.00098.x. [DOI] [PubMed] [Google Scholar]
- 29.Alaluf S., Atkins D., Barrett K., Blount M., Carter N., Heath A. Pigm. Cell Res. 2002;15:119–126. doi: 10.1034/j.1600-0749.2002.1o072.x. [DOI] [PubMed] [Google Scholar]
- 30.Thong H. Y., Jee S. H., Sun C. C., Boissy R. E. Br. J. Dermatol. 2003;149:498–505. doi: 10.1046/j.1365-2133.2003.05473.x. [DOI] [PubMed] [Google Scholar]
- 31.Samokhvalov A., Hong L., Liu Y., Garguilo J., Nemanich R. J., Edwards G. S., Simon J. D. Photochem. Photobiol. 2005;81:145–148. doi: 10.1562/2004-07-23-RC-245. [DOI] [PubMed] [Google Scholar]
- 32.Felix C. C., Hyde J. S., Sarna T., Sealy R. C. Biochem. Biophys. Res. Commun. 1978;84:335–341. doi: 10.1016/0006-291x(78)90175-4. [DOI] [PubMed] [Google Scholar]
- 33.Wenczl E., Van der Schans G. P., Roza L., Kolb R. M., Timmerman A. J., Smit N. P., Pavel S., Schothorst A. A. J. Invest. Dermatol. 1998;111:678–682. doi: 10.1046/j.1523-1747.1998.00357.x. [DOI] [PubMed] [Google Scholar]
- 34.Kuchino Y., Mori F., Kasai H., Inoue H., Iwai S., Miura K., Ohtsuka E., Nishimura S. Nature. 1987;327:77–79. doi: 10.1038/327077a0. [DOI] [PubMed] [Google Scholar]
- 35.Moriya M., Grollman A. P. Mol. Gen. Genet. 1993;239:72–76. doi: 10.1007/BF00281603. [DOI] [PubMed] [Google Scholar]
- 36.Willaert F., Lowy M., Baras L., Delmarmol V., Heenen M. Eur. J. Dermatol. 1994;5:365–367. [Google Scholar]
- 37.Streutker C. J., McCready D., Jimbow K., From L. J. Cutan. Med. Surg. 2000;4:149–152. doi: 10.1177/120347540000400307. [DOI] [PubMed] [Google Scholar]
- 38.Casswell A. G., McCartney A. C., Hungerford J. L. Br. J. Ophthalmol. 1989;73:840–845. doi: 10.1136/bjo.73.10.840. [DOI] [PMC free article] [PubMed] [Google Scholar]
- 39.Ihn H., Nakamura K., Abe M., Furue M., Takehara K., Nakagawa H., Ishibashi Y. J. Am. Acad. Dermatol. 1993;28:895–900. doi: 10.1016/0190-9622(93)70128-g. [DOI] [PubMed] [Google Scholar]
- 40.Ozdemir N., Cangir A. K., Kutlay H., Yavuzer S. T. Eur. J. Cardiothorac. Surg. 2001;20:864–867. doi: 10.1016/s1010-7940(01)00853-3. [DOI] [PubMed] [Google Scholar]
- 41.Malaguarnera M., Romano M., Pistone G. Clin. Oncol. (R. Coll. Radiol.) 1998 doi: 10.1016/s0936-6555(98)80043-5. [DOI] [PubMed] [Google Scholar]
- 42.Lookingbill D. P., Lookingbill G. L., Leppard B. L. J. Am. Acad. Dermatol. 1995;32:653–658. doi: 10.1016/0190-9622(95)90352-6. [DOI] [PubMed] [Google Scholar]
- 43.Luande J., Henschke C. I., Mohammed N. Cancer. 1985;55:1823–1828. doi: 10.1002/1097-0142(19850415)55:8<1823::aid-cncr2820550830>3.0.co;2-x. [DOI] [PubMed] [Google Scholar]
- 44.Diffey B. L., Healy E., Thody A. J., Rees J. L. Lancet. 1995;346:1713–1714. doi: 10.1016/s0140-6736(95)92882-0. [DOI] [PubMed] [Google Scholar]
- 45.Liu S., Shi H., Liu W., Furuichi T., Timmins G. S., Liu K. J. J. Cereb. Blood Flow Metab. 2004;24:343–349. doi: 10.1097/01.WCB.0000110047.43905.01. [DOI] [PubMed] [Google Scholar]
- 46.Liu K. J., Gast P., Moussavi M., Norby S. W., Vahidi N., Walczak T., Wu M., Swartz H. M. Proc. Natl. Acad. Sci. USA. 1993;90:5438–5442. doi: 10.1073/pnas.90.12.5438. [DOI] [PMC free article] [PubMed] [Google Scholar]
- 47.Salikhov I., Hirata H., Walczak T., Swartz H. M. J. Magn. Reson. 2003;164:54–59. doi: 10.1016/s1090-7807(03)00175-7. [DOI] [PubMed] [Google Scholar]
- 48.Ley R. D., Applegate L. A., Padilla R. S., Stuart T. D. Photochem. Photobiol. 1989;50:1–5. doi: 10.1111/j.1751-1097.1989.tb04123.x. [DOI] [PubMed] [Google Scholar]
- 49.Jans J., Schul W., Sert Y. G., Rijksen Y., Rebel H., Eker A. P., Nakajima S., van Steeg H., de Gruijl F. R., Yasui A., et al. Curr. Biol. 2005;15:105–115. doi: 10.1016/j.cub.2005.01.001. [DOI] [PubMed] [Google Scholar]
- 50.Schartl M., Schmidt C. R., Anders A., Barnekow A. Int. J. Cancer. 1985;36:199–207. doi: 10.1002/ijc.2910360212. [DOI] [PubMed] [Google Scholar]
- 51.Jones M. J. Histotech. 2003;26:233–237. [Google Scholar]
- 52.Timmins G. S., Davies M. J. Carcinogenesis. 1993;14:1499–1503. doi: 10.1093/carcin/14.8.1499. [DOI] [PubMed] [Google Scholar]


