

Abstract
We constructed a second-generation linkage map of tilapia from the F2 progeny of an interspecific cross between Oreochromis niloticus and Oreochromis aureus. The map reported here contains 525 microsatellite and 21 gene-based markers. It spans 1311 cM in 24 linkage groups, for an average marker spacing of 2.4 cM. We detected associations of sex and red color with markers on linkage group 3. This map will enable mapping and selective breeding of quantitative traits important to the economic culture of tilapia as a food fish and will contribute to the study of closely related cichlids that have undergone explosive adaptive radiation in the lakes of East Africa.
BONY fishes have been spectacularly successful over the past 200 million years. The 23,000 species of teleosts make up almost half of all living vertebrates (Helfman et al. 1997). The largest order of vertebrates (∼9300 species) are the perciform fishes, which includes >1300 species in the family Cichlidae (Nelson 1994). Cichlid fishes are native to tropical areas of the Americas, Africa, and Asia and have undergone spectacular adaptive radiations in the lakes of East Africa (Fryer and Iles 1972).
The family Cichlidae also includes the tilapias, a group of 40–50 nominal species that are important food fishes in their native habitats in Africa and the Middle East. Several species of tilapia have been introduced to tropical and subtropical countries around the world as a means of increasing supplies of animal protein. Tilapias have become one of the most important groups of food fish, with worldwide production of ∼ 2 million metric tons in 2002. About 75% of this production is from aquaculture (FAO 1999). The most important species in aquaculture is the Nile tilapia, Oreochromis niloticus. Tilapias are also an important model for studies of fish physiology (Wright and Land 1998) and endocrinology (Melamed et al. 1998; Seale et al. 2002).
We are developing genetic and physical maps of tilapia to support the isolation of genes controlling economically important traits in these species. Our previous map of the tilapia genome (Kocher et al. 1998) documented the segregation of 62 microsatellite and 112 AFLP markers in 41 haploid embryos derived from a single female O. niloticus. We identified 30 linkage groups spanning 704 cM and estimated a total map length of ∼1200 cM. In this report we present a significantly improved map based on an F2 intercross between O. niloticus and its sister species, the blue tilapia, O. aureus.
MATERIALS AND METHODS
Mapping population:
Breeding was performed by GH at the Volcani Center. We crossed a red O. niloticus male derived from the University of Stirling stock (McAndrew and Majumdar 1983) with a normally colored O. aureus female. Fingerlings were shipped to the University of New Hampshire (UNH), where they were raised to sexual maturity (mean weight of 149 g). The F2 family consisted of 156 offspring, but for most loci we focused our genotyping on a subset of 70 individuals.
Microsatellite markers:
At GenoMar, a small insert genomic library was constructed from O. niloticus DNA in pBluescriptKS vector and screened with a (CA)10 probe. A total of >1500 clones were sequenced, and primer sets were designed for 1319 putative loci. At UNH, an enriched library was prepared from O. niloticus DNA using a magnetic bead-enrichment protocol (Carleton et al. 2002). A total of 240 clones were sequenced, and primer sets were designed for 165 putative loci using the Primer3 software (Rozen and Skaletsky 2000).
Genotyping:
PCR amplification was carried out in 20-μl reaction volumes containing 1× PCR buffer (10 mm Tris, 50 mm KCl, 0.1% TritonX, pH 9.0), 2.0 mm MgCl2, 200 μM of each dNTP (Promega, Madison, WI), 0.5 units Taq enzyme, 4 pmol each of forward and reverse primer (Operon), and 30–50 ng genomic DNA. Forward primers were labeled with a fluorescent dye (6-FAM, HEX, or TET). PCR amplification was performed in a Perkin-Elmer (Norwalk, CT) 9600 or 9700 using the following conditions: one cycle of 2 min at 94°, 28 cycles at 94° for 30 sec, 50–55° for 30 sec, 72° for 1 min, and one cycle at 72° for 7 min. PCR products for 2–3 loci were combined with a mixture of ABI Genescan-500 TAMRA size standard, gel-loading buffer, and deionized formamide. Sizing of the PCR products was accomplished by electrophoresis in 6 or 4% denaturing polyacrylamide gels on an ABI373 or ABI377 automated DNA sequencer for 8 or 2.5 hr, respectively. All allele sizes were analyzed with ABI Genescan (Version 3.1) program and genotypes saved in a FileMaker database (Microsoft Corp., Redmond, WA) for further analysis.
Type I markers:
Polymorphisms in known genes were identified by one of two general approaches. Some loci already deposited in GenBank contained simple-sequence motifs that were polymorphic in our cross [c-ski class 1 (AJ012011); RasGRF2 (Streelman et al. 1998); Clc 5 (AF182216); TH/Igf2 (AH006117); Insulin (AF038123); UVopsin (Carleton et al. 2000); Blue opsin (Carleton and Kocher 2001); Prolactin (Lee and Kocher 1998)]. For Bmp4, Dlx2, Dmo, Dmrt1, Mhc, Otx2, Pax9, Pmch, Pomc, Tf, Trp1, and WT1_1, degenerate primers were used to amplify genomic DNA or pooled cDNAs derived from tilapia embryos. Resulting amplicons were cloned, sequenced, and verified by BLAST. Gene-specific primers were designed and single-nucleotide polymorphisms (SNPs) distinguishing O. niloticus and O. aureus were identified. PCR-RFLP was then used to genotype the F2. Partial sequences of these genes in O. aureus and O. niloticus have been deposited in GenBank (Table 1).
TABLE 1.
Type I markers
| Gene | Human linkage |
GenBank accession no. |
Forward primer | Reverse primer | Polymorphism | Reference PMID |
|---|---|---|---|---|---|---|
| bmp4 | 14q22 | AF534534/5 | cctggtaatcgaatgctgatg | ccacaatccagtcrttccagc | HpyCH4V | 12704237 |
| clcn5 | Xp11 | AF182216 | agggtgaaggatccaggagt | aggacagcgctgcatagttc | (CA)n | 10082675 |
| cski I | Xq21.3 | AJ012011 | gtcagtcacattcctggctg | ttctatgctcctgcggtttt | (CT)n | 12919484 |
| dlx2 | 2q32 | AF534538/9 | gggtcaccgtttggacag | caggctactttgtggatcgg | SacI | — |
| dmo | 9p21.2 | AF203490 | tcctctgagcgatggaaaac | acagaggtcgacccatgaat | AluI | 10860811 |
| dmrt1 | 9p24.3 | AF534540/1 | gctgctgagcgagatgaaac | acattatgttttacctttgaccctg | SfaNI | — |
| igf2/th | 11p15 | AH006117 | gggtacagcccagacaacat | tggtggtgaagcgacagtaa | (CT)n | — |
| insulin | 11p15 | AF038123 | gatcagatcatgtcggctca | acagccctgtgaagagatgg | (CA)n | 9972302 |
| mhc-1 | 6p21.3 | AF038529 | tgtccygagtgggtgaagaagtat | ggragwcttctgraggagagaca | Length | 14510682 |
| myostatin | 2q32 | AF197193 | ttcctccagtgaaatcttagcc | tataaacggacggcatgttg | (CA)n | 11250920 |
| blue/red opsin | Xq28 | AF247120 | tgcatgcaagattgaaggat | tgcaatgatattggcaccag | (AAG)n | 11470845 |
| UV opsin | 7q32 | AF191221 | agctgctgggtgctctga | ctgcaacctgcagaggaaac | (TCAA)n | 10720660 |
| otx2 | 14q21 | AF534546/7 | cagaggcgagaacggactac | ccgggattcaggtagattga | RsaI | — |
| pax9 | 14q12 | AF534548/9 | tccgaaacaagattgggaat | gagtgggcactttggacg | MnlI | — |
| pmch | 12q23 | AF534542/3 | actcatccacgcaaaccaac | tgtcctacacctcccagcat | ApaLI | — |
| pomc | 2p23.3 | AF534544/5 | cccagaactggaaacaagga | accaaagccacacagacaca | RsaI | — |
| prolactin | 6p22 | X92380 | gttaacattttccaccttcac | cttgcctccattttatagttcctt | (GT)n | 9682461 |
| rasgrf2 | 5q13 | U63663 | cttgatcaccccaccaaaac | tgggtctccaaacattcaca | (CA)n | 10766579 |
| transferrin | 3q21 | AJ312311 | ccattaggtggtgtgctgtg | gaaccagaccacactttccag | Length | 11849146 |
| trp1 | 9p23 | AY623101/2 | agaggtgggtctgtcctcct | gcacagatgacctgatggag | BanI | — |
| wt1_1 | 11p13 | AF534550/1 | cagtgccgtctttaaagttttg | cacacacattcagcacgagtt | NlaIII | — |
Linkage analysis:
The Kosambi mapping function was used for all analyses. We initially used Crimap version 2.4 (Lander and Green 1987) hosted at the UK Human Genome Mapping Project Resource Center (http://www.hgmp.mrc.ac.uk/Bioinformatics/) for linkage analysis and map construction. Later, we used JoinMap 3.0 (van Ooijen and Voorrips 2001), performing an initial clustering of markers using a LOD threshold >1.00 and a recombination limit of <0.40. The final analysis was performed on clusters joined with a LOD >4.0, and the order of adjacent triplets of markers was repeatedly tested to optimize the marker order. The results of the Crimap and JoinMap analyses are largely consistent, and here we present only the latest analysis performed with JoinMap.
Phenotypic traits:
The sex of each F2 animal was identified by dissection and gross examination of the gonads. Sex linkage was analyzed using the nonparametric Kruskal-Wallis rank sum test in MapQTL 4.0 (van Ooijen et al. 2002). The family also segregated for the red color mutation inherited from the O. niloticus parent. Each fish was classified as either red or black, and linkage was analyzed using the Kruskal-Wallis statistic.
RESULTS
Marker polymorphism:
Of the 165 new UNH markers tested, 145 successfully amplified genomic DNA. One hundred eight of these were informative, while 11 were not variable in this family. The other 26 markers produced amplification patterns that were judged too complex to score (Carleton et al. 2002). Of the 1319 GM markers tested, at least 355 produced informative genotypes for linkage analysis. An additional 82 microsatellite markers were selected from our prior maps of tilapia and Lake Malawi cichlids (Kocher et al. 1998; Albertson et al. 2003).
Genotype data on a total of 565 markers were passed forward into linkage analysis. Thirteen of these markers were discarded because they exhibited unusual patterns of segregation suggestive of technical problems in scoring the polymorphism. For the final set of 552 markers, genotypes were obtained for an average of 65.29 individuals per marker (range 27–140).
Linkage map:
We identified linkages among 525 microsatellite and 20 type I (gene) markers. Only 7 markers were not linked to another marker in this analysis. The proportion of linked markers is, therefore, 98.7%. The markers fell into 22 large and 2 small linkage groups (Figure 1). The number of markers per linkage group (LG) ranges from 4 to 51 (Table 2). Despite repeated efforts, we were not able to join the markers into 22 linkage groups corresponding to the 22 chromosomes expected from the karyotype (Majumdar and McAndrew 1986). We expect that the two small linkage groups (8 and 24) will eventually coalesce with other linkage groups to resolve the discrepancy.
Figure 1.—
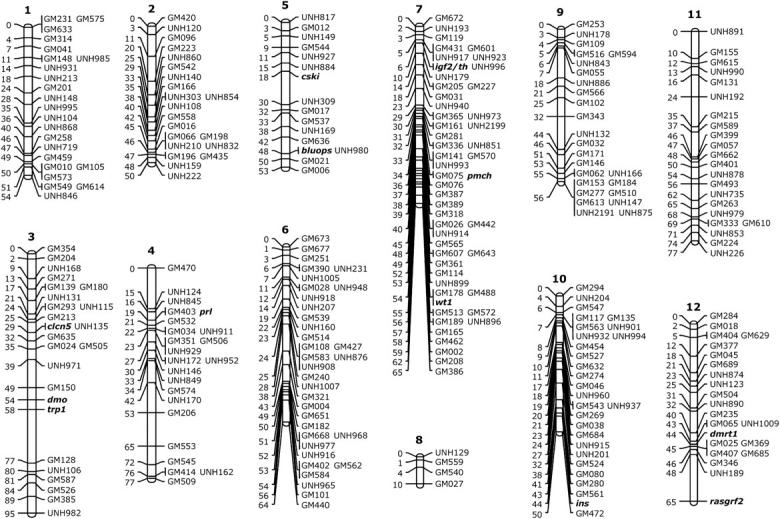

Linkage map of the tilapia genome. Distances in Kosambi centimorgans are given to the left of each ideogram. Type I markers (genes) are shown in boldface type.
TABLE 2.
Linkage group statistics
| LG no. | cM | No. markers | cM/marker |
|---|---|---|---|
| 1 | 54 | 23 | 2.35 |
| 2 | 50 | 21 | 2.38 |
| 3 | 95 | 24 | 3.96 |
| 4 | 77 | 23 | 3.35 |
| 5 | 53 | 16 | 3.31 |
| 6 | 64 | 34 | 1.88 |
| 7 | 65 | 51 | 1.27 |
| 8 | 10 | 4 | 2.50 |
| 9 | 56 | 25 | 2.24 |
| 10 | 50 | 28 | 1.79 |
| 11 | 77 | 22 | 3.50 |
| 12 | 65 | 22 | 2.95 |
| 13 | 41 | 21 | 1.95 |
| 14 | 67 | 26 | 2.58 |
| 15 | 47 | 25 | 1.88 |
| 16 | 68 | 18 | 3.78 |
| 17 | 71 | 24 | 2.96 |
| 18 | 60 | 24 | 2.50 |
| 19 | 37 | 28 | 1.32 |
| 20 | 59 | 23 | 2.57 |
| 21 | 26 | 11 | 2.36 |
| 22 | 63 | 24 | 2.63 |
| 23 | 51 | 23 | 2.22 |
| 24 | 5 | 5 | 1.00 |
| Total | 1311 | 545 | 2.41 |
Where possible, we established a correspondence with our previous map (Kocher et al. 1998), with the intention of providing a stable nomenclature for the linkage groups. Markers on LG10, 14, 18, 19, and 30 in the previous map coalesced with LG5, 3, 2, 14, and 19, respectively, in the new map. Only two markers showed unexpected linkage relationships. UNH193 was expected to fall in LG1, but now maps to LG7. UNH201 was expected to lie in LG4, but now maps to LG10. We were not able to score polymorphisms for any of the markers on LG15 in the previous map, so the correspondence of these markers to the new map is unknown. The relationships of markers in the two maps are listed in Table 3.
TABLE 3.
Syntenies of microsatellite markers in the previous linkage map (Kocheret al. 1998)
| Current LG | Common markers | Previous LG |
Anticipated syntenies |
Unexpected syntenies |
Not mapped |
|---|---|---|---|---|---|
| 1 | UNH104, UNH213 | 1 | — | UNH193 now LG7 | — |
| 2 | UNH108, UNH120, UNH140, UNH159, UNH222 |
2 + 18 | — | — | — |
| 3 | UNH106, UNH115, UNH131, UNH135, UNH168 |
3 + 14 | UNH223 | — | — |
| 4 | UNH146, UNH162, UNH172 | 4 + 19 | UNH009 | UNH201 now LG10 | — |
| 5 | UNH149, UNH169 | 5 + 10 | UNH151 | — | — |
| 6 | UNH160, UNH231 | 6 | UNH154 | — | — |
| 7 | UNH179 | 7 | UNH111 | — | — |
| 8 | UNH129 | 8 | UNH145 | — | — |
| 9 | UNH132, UNH147, UNH166, UNH178 | 9 | OS25 | — | — |
| 10 | — | — | — | — | UNH214 |
| 11 | UNH192 | 11 | UNH219, UNH232 |
— | — |
| 12 | UNH123, UNH189 | 12 | — | — | — |
| 13 | UNH173 | 13 | UNH127 | — | — |
| 14 | — | — | — | — | — |
| 15 | — | 15 | — | — | UNH186, UNH212, UME003, OS64 |
| 16 | UNH125, UNH138 | 16 | UME102, UNH102 |
— | — |
| 17 | UNH008, UNH103 | 17 | — | — | — |
| 18 | — | — | — | — | — |
| 19 | UNH211 | 30 | — | — | — |
| 20 | UNH174 | 20 | — | — | — |
| 21 | — | 21 | — | — | UNH190 |
| 22 | — | 22 | — | — | UNH194 |
| 23 | UNH197, UNH216 | 23 | UNH130 | — | — |
| 24 | — | — | — | — | — |
Map length:
The map spans 1311 cM, with an average marker density of 2.41 cM/marker. Marker density varies among chromosomes, from a high of 1 cM/marker on LG24 to a low of 3.96 cM/marker on LG3 (Table 2). Because the genome size of these species is ∼1.1 Gb, this marker spacing corresponds to an average of 840 kb/cM or about 1.7 Mb/marker. A comparison of 14 pairwise distances among markers also present on the previous map (Kocher et al. 1998) suggests ∼ 30% more recombination in the new map, which may be related to the sex-specific differences in recombination discussed below.
Segregation distortion:
Thirty-three of the 546 markers (6%) showed evidence of segregation distortion at P < 0.05. Most of these markers were distributed in an apparently random fashion over 16 linkage groups. The most significant exception is a cluster of nine loci on LG20. The genotypes at these loci suggest the segregation of a deleterious recessive near marker UNH174.
Sex linkage:
The F2 population consisted of 62 males and 94 females. Single-marker analysis using the Kruskal-Wallis test detected significant linkage between sex and six markers at one end of LG3 (Table 4). No other markers showed significant sex linkage in this family.
TABLE 4.
Sex-linked markers on linkage group 3
| Marker | Position (cM) |
Ka | Degrees of freedom |
P-value |
|---|---|---|---|---|
| GM354 | 0 | 28.9 | 1 | <0.0001 |
| GM204 | 2 | 19.1 | 2 | <0.0001 |
| UNH168 | 9 | 20.0 | 2 | <0.0001 |
| GM271 | 13 | 33.7 | 2 | <0.0001 |
| GM139 | 17 | 10.6 | 1 | <0.005 |
| UNH131 | 22 | 15.3 | 1 | <0.0001 |
Kruskal-Wallis test statistic.
Red color:
Single-marker analysis revealed eight markers on LG3, which were significantly associated with the red phenotype (Table 5). The red locus lies near trp1 in the middle of LG3. No other markers showed a significant association with red color in this family.
TABLE 5.
Markers linked to red color on linkage group 3
| Marker | Position (cM) |
Ka | Degrees of freedom |
P-value |
|---|---|---|---|---|
| GM024 | 35 | 28.7 | 3 | <0.0001 |
| UNH971 | 39 | 34.8 | 3 | <0.0001 |
| GM150 | 49 | 45.1 | 2 | <0.0001 |
| dmo | 54 | 32.6 | 2 | <0.0001 |
| Trp1 | 57 | 63.7 | 2 | <0.0001 |
| GM128 | 77 | 63.1 | 2 | <0.0001 |
| UNH106 | 80 | 41.8 | 2 | <0.0001 |
| GM587 | 81 | 51.2 | 3 | <0.0001 |
| GM526 | 84 | 39.5 | 3 | <0.0001 |
| GM385 | 89 | 33.0 | 2 | <0.0001 |
Kruskal-Wallis test statistic.
Comparative map:
We used BLASTn to compare the sequence of each marker to the Tetraodon assembly (Jaillon et al. 2004). The distribution of the 61 hits with e-values >10−8 are shown in Table 6. Unique correspondences are identified for eight chromosomes.
TABLE 6.
Oxford plot comparing the linkage maps of tilapia and the pufferfishTetraodon nigroviridis
| Tetraodon
|
|||||||||||||||||||||
|---|---|---|---|---|---|---|---|---|---|---|---|---|---|---|---|---|---|---|---|---|---|
| Tilapia | 1 | 2 | 3 | 4 | 5 | 6 | 7 | 8 | 9 | 10 | 11 | 12 | 13 | 14 | 15 | 16 | 17 | 18 | 19 | 20 | 21 |
| 1 | 2 | ||||||||||||||||||||
| 2 | 2 | ||||||||||||||||||||
| 3 | 1 | ||||||||||||||||||||
| 4 | 2 | ||||||||||||||||||||
| 5 | 2 | 1 | |||||||||||||||||||
| 6 | 1 | 1 | 1 | 4 | |||||||||||||||||
| 7 | 1 | 4 | |||||||||||||||||||
| 8 | 1 | ||||||||||||||||||||
| 9 | 1 | 1 | |||||||||||||||||||
| 10 | 4 | ||||||||||||||||||||
| 11 | 2 | ||||||||||||||||||||
| 12 | 3 | ||||||||||||||||||||
| 13 | 2 | ||||||||||||||||||||
| 14 | 4 | ||||||||||||||||||||
| 15 | 1 | 2 | |||||||||||||||||||
| 16 | 1 | ||||||||||||||||||||
| 17 | 1 | 1 | |||||||||||||||||||
| 18 | 1 | 1 | 2 | ||||||||||||||||||
| 19 | 5 | ||||||||||||||||||||
| 20 | 4 | ||||||||||||||||||||
| 21 | |||||||||||||||||||||
| 22 | 1 | ||||||||||||||||||||
| 23 | |||||||||||||||||||||
| 24 | 1 | ||||||||||||||||||||
Numbers indicate the number of tilapia markers with BLASTn hits to particular Tetraodon chromosomes. Italic numbers indicate linkage groups with unique correspondences.
DISCUSSION
This is the most comprehensive map of the tilapia genome to date and one of the most extensive linkage maps available for fishes. We identified linkages among 525 microsatellite and 21 type I (gene) markers that fall into 22 large and 2 small linkage groups. The expected position of another 13 microsatellites can be determined by comparison with our previous linkage map (Table 3), bringing the total number of sequenced markers mapped in Nile tilapia to 559.
The linkages and order of markers in the new map are largely congruent with our previous linkage map of tilapia (Kocher et al. 1998). The new map is also generally consistent with the linkages identified by Agresti et al. (2000) and McConnell et al. (2000). In particular, our new map confirms the order of markers on LG9 proposed in these other studies. Because our new map is based largely on sequenced microsatellite markers, it is easy to make comparisons of the maps constructed for different strains and species. Furthermore, these microsatellite markers are highly polymorphic and therefore informative in most crosses. The several linkage maps of tilapia can be viewed and compared using the comparative genome viewer on our website (http://www.hcgs.unh.edu/comp/).
Sequenced markers can be easily related to physical maps and genome sequences. Our genome viewer also shows links between the genetic map, a physical map based on fingerprinted BAC clones, and cichlid expressed sequence tags (ESTs) mapped onto Fugu sequence scaffolds. This resource is a useful aid for positional cloning and comparative genome analysis in cichlid fishes and is freely available on our website.
Sex-specific patterns of recombination:
Our previous estimate of total map length was ∼1200 cM, based on the recombination occurring in the female parents of meiotic gynogens (Kocher et al. 1998). The current map, based on recombination in both sexes, is only slightly longer (∼1300 cM). However, the similarity in overall length hides the fact that the distribution of recombination along the chromosomes can be very different between males and females. While the JoinMap software does not support the construction of sex-specific maps, the Crimap analysis suggested that tilapia have a sex-specific pattern of recombination. Although the overall levels of recombination are nearly identical, internal linkages are often larger in females, while terminal linkages are larger in males (e.g. Lee et al. 2004). We are currently mapping the centromeres of each chromosome to determine if this pattern is related to the position of the centromere, as it is in other fishes (Sakamoto et al. 2000; Singer et al. 2002).
Sex determination:
While sex determination in tilapia clearly has a genetic basis, the pattern of inheritance is complex (Trombka and Avtalion 1993), and environmental factors also play a role (Baroiller and D'Cotta 2001). Lee et al. (2003) identified markers linked to a dominant male-determining (XY) locus on LG1 in O. niloticus. Lee et al. (2004) found markers linked with two sex-determining loci segregating in a single family of O. aureus. A dominant female determiner (female heterogametic, WZ) system on LG3 was epistatic to a dominant male determiner (male heterogametic, XY) system on LG1. This study examined an interspecific cross between an O. niloticus male (XY, ZZ?) and an O. aureus female (XX?, WZ). The F1 male was either (XY, ZZ) or (XX, ZZ) and the F1 females either (XX, ZZ) or (X?, WZ). The fact that this F2 family showed strong sex linkage of several markers on LG3 is consistent with the segregation of a dominant female determiner (W) originating from the O. aureus parent. Markers on LG1 and LG3 have also been found to be linked to sex determination in an F2 hybrid cross between O. aureus and O. mossambicus (Cnaani et al. 2004).
Red color:
Red tilapias have been selected from several independent mutations in commercial and laboratory stocks (Huang et al. 1988). The allele studied here arose as a new mutant in the University of Stirling stock (McAndrew et al. 1988). It affects the development of melanophores early in development (Hilsdorf et al. 2002). Our results show that the mutation segregates as a single dominant gene near trp1. Efforts to positionally clone this gene are underway in our laboratory (Howe 2004).
Comparative maps:
Genetic linkage maps have been developed for a number of fish species, including zebra fish (Woods et al. 2000), medaka (Naruse et al. 2000), catfish (Waldbieser et al. 2001), rainbow trout (Young et al. 1998), Atlantic salmon (Moen et al. 2004; Gilbey et al. 2004), and Lake Malawi cichlids (Albertson et al. 2003). Whole-genome sequencing has been initiated for the zebra fish (http://www.sanger.ac.uk/Projects/D_rerio/), medaka (Naruse et al. 2004), Fugu (Aparicio et al. 2002), and Tetraodon (Crollius et al. 2002). Because of the close relationship among fishes, particularly among the perciform fishes that diverged within the last 150 million years, these genetic maps, when coupled to the whole-genome sequences of zebra fish, medaka, and Fugu, provide access to the genomes of literally thousands of species of fishes.
Preliminary evidence suggests that the linkage map of tilapia presented here will be largely conserved among the >2000 species of cichlid fishes in the lakes of East Africa (J. T. Streelman, unpublished results). Many of the tilapia microsatellites presented here have already been used to study the inheritance of traits in Lake Malawi cichlids (Albertson et al. 2003; Streelman et al. 2003). Our linkage map of tilapia is therefore an important step in the application of genomic technologies to studying the genetic basis of phenotypic traits in a large group of cichlid fishes.
Acknowledgments
This work was supported by grants from the United States Department of Agriculture National Research Initiative Competitive Grants Program (98-03476) and the New Hampshire Agricultural Experiment Station (Hatch 372 and 397) to T.D.K. J.T.S. was supported by postdoctoral fellowships from the Alfred P. Sloan Foundation and the United States Department of Agriculture. This is scientific contribution no. 2249 from the New Hampshire Agricultural Experiment Station.
References
- Agresti, J. J., S. Seki, A. Cnaani, S. Poompuang, E. M. Hallerman et al., 2000. Breeding new strains of tilapia: development of an artificial center of origin and linkage map based on AFLP and microsatellite loci. Aquaculture 185: 43–56. [Google Scholar]
- Albertson, R. C., J. T. Streelman and T. D. Kocher, 2003. Directional selection has shaped the oral jaws of Lake Malawi cichlid fishes. Proc. Natl. Acad. Sci. USA 100: 5252–5257. [DOI] [PMC free article] [PubMed] [Google Scholar]
- Aparicio, S., J. Chapman, E. Stupka, N. Putnam, J. M. Chia et al., 2002. Whole-genome shotgun assembly and analysis of the genome of Fugu rubripes. Science 297: 1301–1310. [DOI] [PubMed] [Google Scholar]
- Baroiller, J. F., and H. D'Cotta, 2001. Environment and sex determination in farmed fish. Comp. Biochem. Physiol. C Toxicol. Pharmacol. 130: 399–409. [DOI] [PubMed] [Google Scholar]
- Carleton, K. L., and T. D. Kocher, 2001. Cone opsin genes of African cichlid fishes: tuning spectral sensitivity by differential gene expression. Mol. Biol. Evol. 18: 1540–1550. [DOI] [PubMed] [Google Scholar]
- Carleton, K. L., F. I. Harosi and T. D. Kocher, 2000. Visual pigments of African cichlid fishes: evidence for ultraviolet vision from microspectrophotometry and DNA sequences. Vision Res. 40: 879–890. [DOI] [PubMed] [Google Scholar]
- Carleton, K. L, J. T. Streelman, B.-Y. Lee, N. Garnhart, M. Kidd et al., 2002. Rapid isolation of CA microsatellites from the tilapia genome. Anim. Genet. 33: 140–144. [DOI] [PubMed] [Google Scholar]
- Cnaani, A., N. Zilberman, S. Tinman, G. Hulata and M. Ron, 2004. Genome-scan analysis for quantitative trait loci in an F2 tilapia hybrid. Mol. Genet. Genomics 272: 162–172. [DOI] [PubMed] [Google Scholar]
- Crollius, H. R., O. Jaillon, A. Bernot, E. Pelletier, C. Dasilva et al., 2002. Genome-wide comparisons between human and Tetraodon. Ernst Schering Res. Found. Workshop 36: 11–29. [DOI] [PubMed] [Google Scholar]
- FAO, 1999 The State of World Fisheries and Aquaculture. Food and Agriculture Organization, Rome.
- Fryer, G., and T. D. Iles, 1972 The Cichlid Fishes of the Great Lakes of Africa: Their Biology and Evolution. TFH Publications, Neptune City, NJ.
- Gilbey, J., E. Verspoor, A. McLay and D. Houlihan, 2004. A microsatellite linkage map for Atlantic salmon (Salmo salar). Anim. Genet. 35: 98–105. [DOI] [PubMed] [Google Scholar]
- Helfman, G. S., B. B. Collette and D. E. Facey, 1997 The Diversity of Fishes. Blackwell Science, Malden, MA.
- Hilsdorf, A. W. S., D. J. Penman, E. C. Farias and B. McAndrew, 2002. Melanophore appearance in wild and red tilapia embryos. Pigm. Cell Res. 15: 57–61. [DOI] [PubMed] [Google Scholar]
- Howe, A., 2004 The genetic basis of red color in tilapia. M.S. Thesis, University of New Hampshire, Durham, NH.
- Huang, C. M., S. L. Chang, H. J. Cheng and I. C. Liao, 1988. Single-gene inheritance of red body coloration in Taiwanese red tilapia. Aquaculture 74: 227–232. [Google Scholar]
- Jaillon, O., J. M. Aury, F. Brunet, J. L. Petit, N. Stange-Thomann et al., 2004. Genome duplication in the teleost fish Tetraodon nigroviridis reveals the early vertebrate proto-karyotype. Nature 431: 946–957. [DOI] [PubMed] [Google Scholar]
- Kocher, T. D., W.-J. Lee, H. Sobolewska, D. Penman and B. McAndrew, 1998. A genetic linkage map of a cichlid fish, the tilapia (Oreochromis niloticus). Genetics 148: 1225–1232. [DOI] [PMC free article] [PubMed] [Google Scholar]
- Lander, E., and P. Green, 1987. Construction of multilocus genetic linkage maps in humans. Proc. Natl. Acad. Sci. USA 84: 2363–2367. [DOI] [PMC free article] [PubMed] [Google Scholar]
- Lee, B.-Y., D. J. Penman and T. D. Kocher, 2003. Identification of a sex-determining region in Nile tilapia (Oreochromis niloticus) using bulked segregant analysis. Anim. Genet. 34: 379–383. [DOI] [PubMed] [Google Scholar]
- Lee, B.-Y., G. Hulata and T. D. Kocher, 2004. Two unlinked loci controlling the sex of blue tilapia (Oreochromis aureus). Heredity 92: 543–549. [DOI] [PubMed] [Google Scholar]
- Lee, W. J., and T. D. Kocher, 1998. Microsatellite mapping of the prolactin locus in the tilapia genome. Anim. Genet. 29: 68. [PubMed] [Google Scholar]
- Majumdar, K. C., and B. J. McAndrew, 1986. Relative DNA content of somatic nuclei and chromosomal studies in three genera, Tilapia, Sarotherodon, and Oreochromis of the tribe Tilapiini (Pisces, Cichlidae). Genetica 68: 175–188. [Google Scholar]
- McAndrew, B. J., and K. C. Majumdar, 1983. Tilapia stock identification using electrophoretic markers. Aquaculture 30: 249–261. [Google Scholar]
- McAndrew, B. J., F. R. Roubal, R. J. Roberts, A. M. Bullock and I. M. McEwen, 1988. The genetics and histology of red, blond, and associated colour variants in Oreochromis niloticus. Genetica 76: 127–137. [Google Scholar]
- McConnell, S. K., C. Beynon, J. Leamon and D. O. Skibinski, 2000. Microsatellite marker-based genetic linkage maps of Oreochromis aureus and O. niloticus (Cichlidae): extensive linkage-group segment homologies revealed. Anim. Genet. 31: 214–218. [DOI] [PubMed] [Google Scholar]
- Melamed, P., H. Rosenfeld, A. Elizur and Z. Yaron, 1998. Endocrine regulation of gonadotropin and growth hormone gene transcription in fish. Comp. Biochem. Physiol. C Pharmacol. Toxicol. Endocrinol. 119: 325–338. [DOI] [PubMed] [Google Scholar]
- Moen, T., B. Hoyheim, H. Munck and L. Gomez-Raya, 2004. A linkage map of Atlantic salmon (Salmo salar) reveals an uncommonly large difference in recombination rate between the sexes. Anim. Genet. 35: 81–92. [DOI] [PubMed] [Google Scholar]
- Naruse, K., S. Fukamachi, H. Mitani, M. Kondo, T. Matsuoka et al., 2000. A detailed linkage map of medaka, Oryzias latipes: comparative genomics and genome evolution. Genetics 154: 1773–1784. [DOI] [PMC free article] [PubMed] [Google Scholar]
- Naruse, K., H. Hori, N. Shimizu, Y. Kohara and H. Takeda, 2004. Medaka genomics: a bridge between mutant phenotype and gene function. Mech. Dev. 121: 619–628. [DOI] [PubMed] [Google Scholar]
- Nelson, J. S., 1994 Fishes of the World. John Wiley & Sons, New York.
- Rozen, S., and H. Skaletsky, 2000. Primer3 on the WWW for general users and for biologist programmers. Methods Mol. Biol. 132: 365–386. [DOI] [PubMed] [Google Scholar]
- Sakamoto, T., R. G. Danzmann, K. Gharbi, P. Howard, A. Ozaki et al., 2000. A microsatellite linkage map of rainbow trout (Oncorhynchus mykiss) characterized by large sex-specific differences in recombination rates. Genetics 155: 1331–1345. [DOI] [PMC free article] [PubMed] [Google Scholar]
- Seale, A. P., L. G. Riley, T. A. Leedom, S. Kajimura, R. M. Dores et al., 2002. Effects of environmental osmolality on release of prolactin, growth hormone, and ACTH from the tilapia pituitary. Gen. Comp. Endocrinol. 128: 91–101. [DOI] [PubMed] [Google Scholar]
- Singer, A., H. Perlman, Y. Yan, C. Walker, G. Corley-Smith et al., 2002. Sex-specific recombination rates in zebrafish (Danio rerio). Genetics 160: 649–657. [DOI] [PMC free article] [PubMed] [Google Scholar]
- Streelman, J. T., R. Zardoya, A. Meyer and S. A. Karl, 1998. Multi-locus phylogeny of cichlid fishes: evolutionary comparison of microsatellite and single-copy nuclear loci. Mol. Biol. Evol. 15: 798–808. [DOI] [PubMed] [Google Scholar]
- Streelman, J. T., R. C. Albertson and T. D. Kocher, 2003. Genome mapping of the orange blotch color pattern in cichlid fishes. Mol. Ecol. 12: 2465–2471. [DOI] [PubMed] [Google Scholar]
- Trombka, D., and R. R. Avtalion, 1993. Sex determination in tilapias: a review. Isr. J. Aquacult. Bamidgeh 45: 26–37. [Google Scholar]
- van Ooijen, J. W., and R. E. Voorrips, 2001 JoinMap Version 3.0: Software for the Calculation of Genetic Linkage Maps. Plant Research International, Wageningen, The Netherlands.
- van Ooijen, J. W., M. P. Boer, R. C. Jansen and C. Maliepaard, 2002 MapQTL Version 4.0: Software for the Calculation of QTL Positions on Genetic Maps. Plant Research International, Wageningen, The Netherlands.
- Waldbieser, G. C., B. G. Bosworth, D. J. Nonneman and W. R. Wolters, 2001. A microsatellite-based genetic linkage map for channel catfish, Ictalurus punctatus. Genetics 158: 727–734. [DOI] [PMC free article] [PubMed] [Google Scholar]
- Woods, I. G., P. D. Kelly, F. Chu, P. Ngo-Hazelett, Y. L. Yan et al., 2000. A comparative map of the zebrafish genome. Genome Res. 10: 1903–1914. [DOI] [PMC free article] [PubMed] [Google Scholar]
- Wright, P. A., and M. D. Land, 1998. Urea production and transport in teleost fishes. Comp. Biochem. Physiol. A Mol. Integr. Physiol. 119: 47–54. [DOI] [PubMed] [Google Scholar]
- Young, W. P., P. A. Wheeler, V. H. Coryell, P. Keim and G. H. Thorgaard, 1998. A detailed linkage map of rainbow trout produced using doubled haploids. Genetics 148: 839–850. [DOI] [PMC free article] [PubMed] [Google Scholar]