Abstract
The mosquito Aedes aegypti is the most important vector of yellow fever and dengue fever flaviviruses. Ae. aegypti eradication campaigns have not been sustainable and there are no effective vaccines for dengue viruses. Alternative control strategies may depend upon identification of mosquito genes that condition flavivirus susceptibility and may ultimately provide clues for interrupting transmission. Quantitative trait loci affecting the ability of Ae. aegypti to develop a dengue-2 infection in the midgut have been mapped previously. Herein we report on QTL that determine whether mosquitoes with a dengue-2-infected gut can then disseminate the virus to other tissues. A strain selected for high rates of dengue-2 dissemination was crossed to a strain selected for low dissemination rates. QTL were mapped in the F2 and again in an F5 advanced intercross line. QTL were detected at 31 cM on chromosome I, at 32 cM on chromosome II, and between 44 and 52 cM on chromosome III. Alleles at these QTL were additive or dominant in determining rates of dengue-2 dissemination and accounted for ∼45% of the phenotypic variance. The locations of dengue-2 midgut infection and dissemination QTL correspond to those found in earlier studies.
AEDES aegypti is the most important vector of yellow fever and dengue fever (serotypes 1–4) flaviviruses in humans (Gubler 2002). It is a container-breeding mosquito with a wide distribution throughout tropical and subtropical regions of the world. Large-scale mosquito eradication programs began in the 1940s and effectively reduced Ae. aegypti numbers. Unfortunately eradication was never achieved, and with the dissolution of these programs in the late 1960s Ae. aegypti reestablished itself throughout tropical and subtropical areas of the Americas. Failure to curb the disease vector would be of little consequence if suitable vaccines were available and used effectively. However, yellow fever remains an important public health problem in much of Africa and South America despite the fact that a safe and effective vaccine is widely available (Barrett and Monath 2003). No effective vaccines are available for dengue virus infection, and this places >2 billion people at risk for infection with dengue fever; each year an estimated 100 million human infections occur (Gubler 2002). Indeed, dengue fever is one of the most rapidly expanding diseases in the tropics, and now that all four serotypes of the virus are circulating in the Americas, there is an added increase in risk for the occurrence of dengue hemorrhagic fever.
Vector competence refers to the intrinsic permissiveness of an arthropod vector to infection, replication, and transmission of a pathogen (Hardy 1988; Woodring et al. 1996). Ae. aegypti exhibits global variation in vector competence for flaviviruses. In sub-Saharan Africa, a black “sylvan” subspecies, Ae. a. formosus, predominates. This subspecies has low vector competence for flaviviruses due primarily to a midgut infection barrier. In tropical and subtropical regions outside of Africa, a lighter-colored “domestic” subspecies, Ae. a. aegypti, is more common and is relatively susceptible to flavivirus infection (Gubler et al. 1979; Tabachnick et al. 1985).
Once ingested by its mosquito host, a virus must overcome several obstacles if it is to be transmitted to a subsequent host. First, the virus must establish a productive infection in the mosquito midgut by overcoming a midgut infection barrier (MIB). Bosio et al. (2000) mapped the quantitative trait loci (QTL) that affect the MIB for dengue-2 virus using an F1 intercross. QTL for the MIB were detected on chromosomes II and III and accounted for ∼30% of the phenotypic variance (σ2p) in dengue-2 infection. These respectively accounted for 44 and 56% of the overall genetic variance (σ2g). Gomez-Machorro et al. (2004) mapped QTL for MIB in the F5 generation of an advanced intercross line established from a strain of Ae. aegypti previously selected for dengue-2 susceptibility and an Ae. a. formosus strain selected for refractoriness to midgut infection. A new sex-linked QTL and a second QTL on chromosome II with genotypes subject to balancing selection were detected. Alleles at these QTL contributed additively in determining susceptibility and accounted for ∼24% of σ2p.
Following replication in the midgut epithelium, virus must overcome a midgut escape barrier (MEB) and replicate in other tissues. Ultimately, virus must then infect the salivary glands and be shed in the saliva for transmission to the next vertebrate host. The genetics of flavivirus MEBs in Ae. aegypti are not well understood. Bosio et al. (1998) performed a standard half-sib breeding experiment and estimated that the heritability for a MEB was 0.39 in Ae. aegypti formosus but was much lower in Ae. aegypti aegypti where MEB appeared to be controlled instead by dominant alleles. Bosio et al. (2000) found weak evidence for a MEB QTL on chromosome III with standard interval mapping but not with composite-interval mapping. Other than these inconclusive studies, few researchers have examined the genetics of barriers to viral dissemination. A common problem has been that MEBs can be studied only in mosquito species or strains without MIBs because MEB phenotypes cannot be defined in mosquitoes that do not develop an infection in the gut. Thus studying MEBs requires breeding strains of mosquitoes with high midgut susceptibility that still retain some of the natural variation in MEB. Bennett et al. (2005) describe a dengue MEB strain [dengue-2 (D2)MEB] selected from a field population from Houston, Texas in which 75–85% of mosquitoes had a midgut infection but only 25–55% had a disseminated infection depending upon the dengue-2 viral genotype examined. The purpose of the present study is to map and characterize QTL that control midgut escape barriers in the D2MEB strain.
MATERIALS AND METHODS
Mosquito strains:
Selection of the Ae. aegypti dengue-2 susceptible on 3 chromosomes (D2S3) and D2MEB strains is described by Bennett et al. (2005). Briefly, in D2S3 95–100% of mosquitoes have a disseminated infection and were selected through crosses between Ibo and Puerto Rico mosquitoes, two long-maintained laboratory strains (Bosio et al. 1998). The D2MEB strain was selected beginning with families arising from single-pair matings between F3 parents from the Houston laboratory strain, which originated from eggs field collected in Houston, Texas, during the summer of 1998 (Bennett et al. 2002), and the selected D2S3 strain. In D2MEB, 85% of mosquitoes had an infected midgut but only 27% developed a disseminated infection. The P1 parents of the reciprocal F1 families generated for this study were from D2MEB F5 and D2S3 F13 generations.
All mosquito phenotyping, selection, and mapping was done using dengue-2 JAM1409 virus, a strain originally isolated in 1983 in Jamaica. Oral feeding and dengue-2 infection protocols follow those of Bennett et al. (2002). Following the 14-day extrinsic incubation period, mosquitoes were frozen and heads were severed, squashed onto acid-washed slides, acetone fixed, and assayed for dengue-2 by indirect immunofluorescence assay (Bennett et al. 2002). When viral antigen was not detected in head tissues, the respective abdomens, which had been stored at −70°, were assayed for virus antigen. Phenotypes were scored on a binary system, where 0/0 denotes an uninfected mosquito, 1/0 denotes a mosquito with an infected midgut but no disseminated infection, and 1/1 denotes a mosquito with a disseminated infection.
Breeding and experimental design:
Ten crosses between D2S3 and D2MEB parents were made in both directions to generate 20 reciprocal F1 intercross families. After 4–7 days, females were given an infectious blood meal (Bennett et al. 2002) and males were collected and frozen at −70°. Eggs were collected from individual females. After the 14-day extrinsic incubation period, infection phenotypes were determined in P1 females (Bennett et al. 2002).
D2S3 P1 females that had a disseminated infection and D2MEB P1 females that had an infected midgut but no dissemination of the infection were used. Eggs from each of these females were hatched and reared to adults, and individual F1 females from this hatch were paired with individual full-sibling F1 males. After 6–7 days, males were removed and stored at −70°. Females were given several noninfectious blood meals and eggs were collected from individual females. After 3–4 weeks, the F1 females were also stored at −70°. F2 families with the most eggs were hatched and reared to adults. These included six D2S3 × D2MEB families and seven D2MEB × D2S3 families. Full siblings of these F2 generations were allowed to intermate. After 4–7 days F2 females were provided an infectious blood meal. The F2 males and unfed females were removed and stored at −70°. Fed females were maintained through the extrinsic incubation period and assayed for infections in the midgut and head. The remnants of the abdomen and the thorax were returned immediately to a tube on dry ice and then frozen at −70° awaiting DNA isolation.
DNA was extracted from all P1, F1, and F2 mosquitoes (Black and DuTeau 1997) and resuspended in 500 μl TE (50 mm Tris-HCl, 5 mm EDTA, pH 8.0) buffer. A 50-μl aliquot of DNA was overlaid with sterile mineral oil and stored at 4° for daily use in the polymerase chain reaction (PCR). The remainder was stored in plastic screw-top vials at −70°. PCR amplification and single-strand conformation polymorphism analysis are as previously described (Black and DuTeau 1997; Bosio et al. 2000). All of the primers and optimal conditions for the PCR in this study are published (Bosio et al. 2000; Fulton et al. 2001; Gomez-Machorro et al. 2004). Ultimately two complete F1 intercross families, D2S3 × D2MEB 2.2 and D2MEB × D2S3 7.1, were selected for further analysis. These were chosen because they had the largest F2 family sizes, the P1 and F1 parents had greater numbers of polymorphic loci, and in a preliminary screen a low percentage of F2 females had a disseminated infection (D2S3 × D2MEB 2.2, 59.2% disseminated infection; D2MEB × D2S3 7.1, 42.5% disseminated infection). The F3 eggs from these two families were hatched, reared to adults, and allowed to randomly mate to generate F4 eggs. By the F5 generation, ∼2000 eggs were available in each family. For QTL mapping in an advanced intercross line, ∼1000 F5 eggs were hatched and the resulting females were assayed for infection phenotypes as described above. The remainder of the eggs was used to generate the F6 generation.
QTL mapping:
Ae. aegypti has a low abundance of microsatellites (Fagerberg et al. 2001) so that geneticists commonly use restriction enzyme analyses or single-strand conformation polymorphism analysis of PCR-amplified cDNA genes as markers for mapping. The linkage positions of all marker loci used in this study are published (Severson et al. 2002; Black and Severson 2004). Associations between genotypes at each marker locus and infection phenotypes were initially assessed by a contingency χ2 analysis. The null hypothesis was that the numbers of mosquitoes with midgut and disseminated infections were equal in each genotype class. Thus marginal probabilities were the frequencies of each genotype at a locus in females and the overall proportions of mosquitoes with midgut and disseminated infections. When a significant χ2 was detected, we examined the inheritance of the alleles at that locus. Our a priori hypothesis was that an excess of F2 individuals with an allele inherited from the D2S3 P1 parent would have a disseminated infection while an excess of F2 individuals with an allele inherited from the D2MEB P1 parent would not disseminate the virus.
Composite-interval mapping (Zeng 1994) and multiple-interval mapping (Zeng et al. 1999) were performed using QTL Cartographer 2.0 (Basten et al. 2002). Composite-interval mapping was performed with np set to the number of separate regions indicated in the initial contingency χ2-analyses and ws = 10 cM (the recommended default value). Composite-interval mapping was run with 1000 permutations to estimate the 95% experimentwise threshold. For multiple-interval mapping, an initial model was estimated by forward and backward selection on markers with a probability of a partial R2 set to 0.01. QTL positions were then optimized and the QTL model was saved. A secondary search for QTL was performed, their positions were optimized, and the QTL model was again saved. Next, a search for epistasis was performed and the QTL model was saved. In the last step, confidence intervals around QTL positions, breeding values, R2 partition, additive and dominance effects, and variance and covariance tables were produced using the multiple-interval mapping model summary procedure.
RESULTS
Mapping families:
Of 76 F2 D2S3 × D2MEB 2.2 females 62 had an infected midgut (62/76 = 81.6%), and 72.6% (45/62) of these developed a disseminated infection. Of 436 F5 females 56.0% (244/436) had an infected gut and 52.0% (127/244) of these further disseminated the infection. Of 40 F2 D2MEB × D2S3 7.1, 33 females had infected guts (33/40 = 82.5%) and 51.5% (17/33) of these disseminated the infection. A large percentage of the 296 F5 females had infected midguts (241/296 = 81.4%), but only 41.1% (99/241) of these disseminated the infection.
Genotype-phenotype associations:
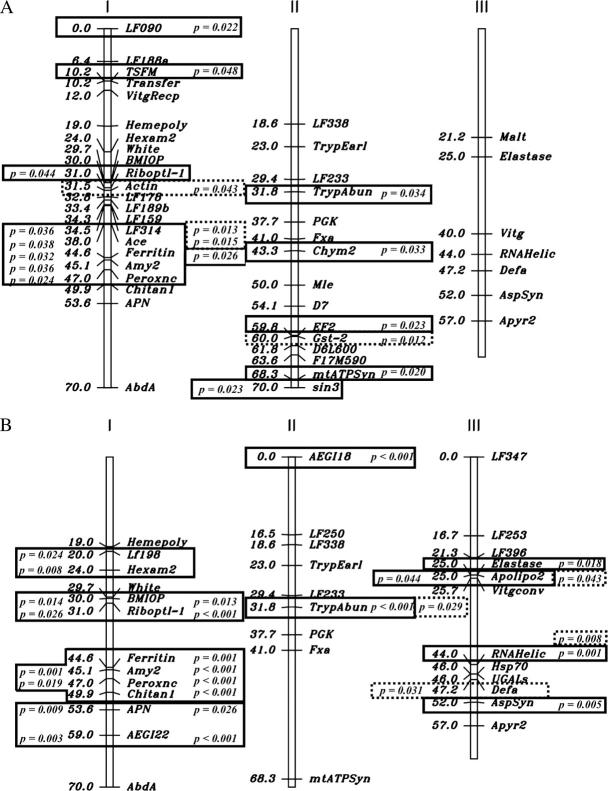
The results of χ2-goodness-of-fit tests indicated when marker genotypes were not distributed independently of infection phenotypes (Figure 1). Values to the left and right of the chromosomes are from analysis of the F2 and F5 offspring, respectively. Loci that are statistically associated with disseminated infection appear in boxes containing the associated type I probability and those associated with midgut infection appear in dotted-line boxes.
Figure 1.—
Linkage maps of the Aedes aegypti (A) D2S3 × D2MEB 2.2 and (B) D2MEB × D2S3 7.1 families. The linkage positions of all marker loci are published (Severson et al. 2002; Black and Severson 2004). The results of χ2-goodness-of-fit tests indicate when marker genotypes were not distributed independently of infection phenotypes. Loci that are statistically associated with a disseminated infection appear in boxes containing the associated type I probability and those with a midgut infection appear in dotted-line boxes. Values to the left and right of the chromosomes are from analysis of the F2 and F5 offspring, respectively.
D2S3 × D2MEB 2.2:
Among the 62 D2S3 × D2MEB 2.2 F2 females (Figure 1), there were significant associations between disseminated infection and genotypes at Riboptl-1 at 31 cM and at markers from 35 to 47 cM on chromosome I and at sin3 at 70 cM on chromosome II. There were no associations between midgut infection and genotypes among F2 females. Among the 244 F5 females, there were significant associations between disseminated infection and genotypes at LF090, TSFM, and Ferritin on chromosome I. On chromosome II there were significant associations between the disseminated infection and genotypes at TrypAbun, Chym2, EF2, and mtATPSyn. There were significant associations between midgut infection and genotypes at Actin, LF314, and Ace on chromosome I and at Gst-2 on chromosome II.
Composite-interval mapping for disseminated infection was performed in both F2 and F5 females (results not shown). In neither generation did the original LOD value exceed the 95% experimentwise threshold and thus no QTL were inferred. Similarly, composite-interval mapping didn't detect midgut infection QTL in F2 or F5 females. Multiple interval mapping estimated disseminated infection QTL in F2 or F5 females using forward or backward selection on markers (Table 1). Genetic variance (σ2g) in the multiple-interval mapping models accounted for ∼3–11% of the phenotypic variance (σ2p) for disseminated infection and ∼1–6% of σ2p for midgut infection (Table 1) but none of the effects was significant.
TABLE 1.
Multiple-interval mapping estimates of QTL position and associated genetic, environmental, and phenotypic variance and additive and dominance effects associated with MEB and MIB QTL inAedes aegypti
| σ2g% σ2p | σ2e% σ2p | σ2p | Nearest marker | cM | LR | Effect | % σ2g |
|---|---|---|---|---|---|---|---|
| DS3 × DMEB 2.2 F2 | |||||||
| MEB 2.18 (11.0%) | 17.72 (89.0%) | 19.90 | Peroxnc | 47.1 | 0.0005 | A, +0.05 | (0.0) |
| (Not significant) | (47.0–50.0) | 0.8577 | D, −3.10 | (11.0) | |||
| MIB 0.87 (5.8%) | 14.11 (94.2%) | 14.16 | Chitan1 | 50.0 | 0.6736 | A, +0.92 | (3.1) |
| (Not significant) | (49.9–53.6) | 0.5238 | D, +1.05 | (2.7) | |||
| DS3 × DMEB 2.2 F5 | |||||||
| MEB 0.74 (3.0%) | 24.18 (97.0%) | 24.92 | Chym2 | 42.7 | 1.4312 | A, −1.00 | (1.7) |
| (Not significant) | (42.6–54.4) | 0.9921 | D, +1.11 | (1.3) | |||
| MIB 0.23 (0.9%) | 24.56 (99.1%) | 24.79 | Chym2 | 38.7 | 1.1392 | A, −1.06 | (1.1) |
| (Not significant) | (38.6–42.6) | 0.1419 | D, +0.43 | (0.0) | |||
| DMEB × DS3 7.1 F2 | |||||||
| MEB 8.59 (34.4%) | 16.39 (65.6%) | 24.98 | Amy2 | 45.2 | 0.0004 | A, +1.53 | (8.9) |
| (Not significant) | (45.1–47.0) | 0.0000 | D, +4.36 | (25.5) | |||
| MIB 1.30 (9.0%) | 13.14 (91.0%) | 14.44 | Defa | 51.9 | −0.0336 | A, +1.88 | (−4.0) |
| (51.8 –52.0) | 0.2016 | D, −4.16 | (13.0) | ||||
| DMEB × DS3 7.1 F5 | |||||||
| MEB 10.96 (45.1%) | 13.32 (54.9%) | 24.28 | Riboptl-1 | 34.4 | 4.5997 | A, +2.91 | (16.1) |
| (31.0–44.5) | 0.6164 | D, +1.24 | (5.0) | ||||
| TrypAbun | 31.9 | 10.9450 | A, +1.77 | (8.6) | |||
| (31.8–37.7) | |||||||
| RNAHelic | 48.0 | 12.2771 | A, +2.81 | (8.0) | |||
| (44.0–52.0) | 10.1491 | D, −3.58 | (7.4) | ||||
| MIB 2.84 (18.7%) | 12.29 (81.3%) | 15.13 | TrypAbun | 31.9 | 4.7525 | A, +0.93 | (2.4) |
| (31.8–37.7) | 0.5628 | D, −0.46 | (0.2) | ||||
| Apolipo2 | 25.1 | 1.7454 | A, +0.88 | (2.7) | |||
| (25.0–25.7) | 2.9061 | D, +1.56 | (3.7) | ||||
| RNAHelic | 44.1 | 0.6989 | A, −0.50 | (0.9) | |||
| (44.0–60.0) | 1.4398 | D, −0.92 | (2.1) | ||||
| Apolipo2 × RNAHelic | 4.5978 | AD, +2.94 | (6.7) | ||||
Confidence intervals for QTL position are in parentheses below the position estimate. A, additive; D, dominance.
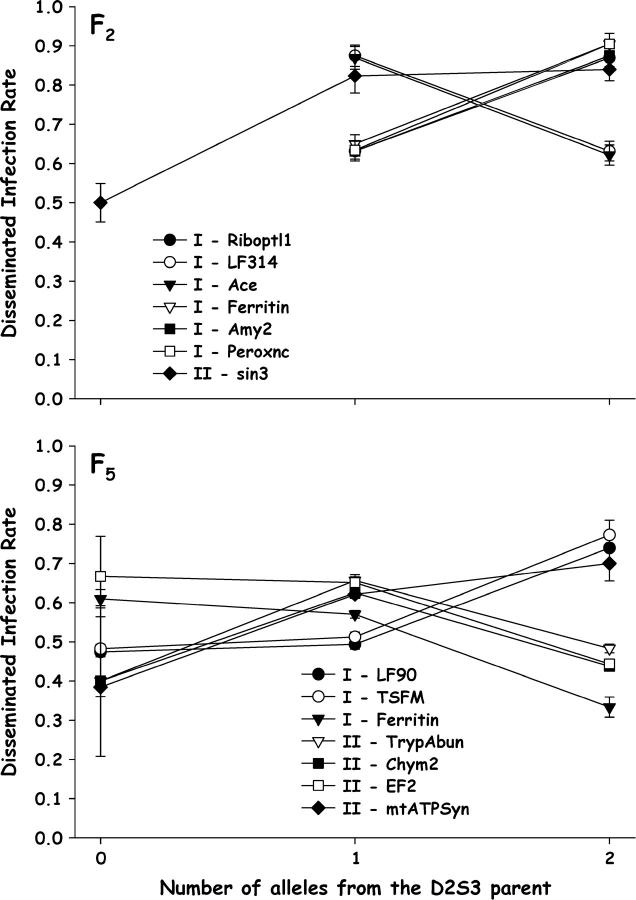
The numbers of alleles inherited from the D2S3 P1 parent were plotted against disseminated infection (Figure 2) to test the a priori assumption that alleles associated with a higher rate of disseminated infection are inherited from the D2S3 parent. Among F2 females, genotypes at Riboptl1, Ferritin, Amy2, Peroxnc, and sin3 follow the predicted pattern. However, at LF314 and Ace the opposite pattern was seen. Among F5 females, genotypes at only TSFM, LF090, and mtATPsyn follow the predicted pattern. Apparently at some loci alleles inherited from the D2MEB parent yielded more disseminated infections than alleles inherited through the D2S3 parent.
Figure 2.—
Plot of disseminated infection rates as a function of the number of alleles inherited from the D2S3 P1 parent for significant markers on chromosome I (Figure 1) in the D2S3 × D2MEB 2.2 family in the F2 (top) and F5 (bottom). Bars above and below each point are 95% confidence intervals.
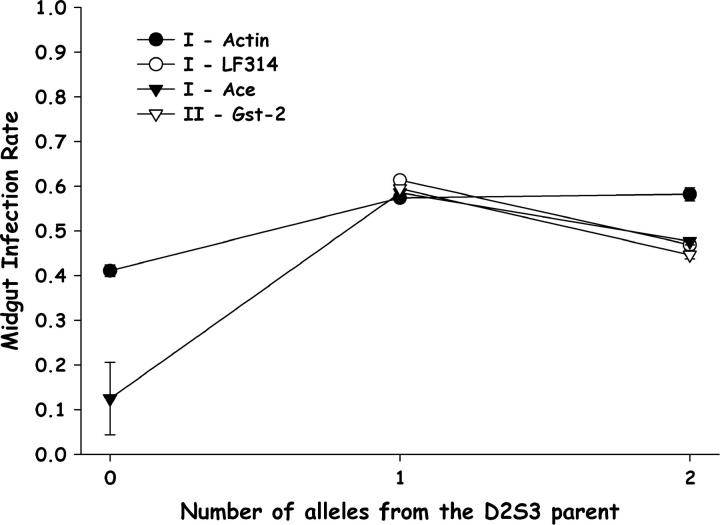
The numbers of D2S3 alleles were also plotted against midgut infections to determine if D2S3 alleles yielded more midgut infections (Figure 3). The observed patterns were consistent with this prediction. However, with the exception of Ace, the effects of genotypes were slight. QTL alleles inherited from the D2S3 parent conferred only slightly more infected midguts than alleles inherited through the D2MEB parent.
Figure 3.—
Plot of midgut infection rates as a function of the number of alleles inherited from the D2S3 P1 parent for significant markers on chromosomes I and II (Figure 1) in the F5 D2S3 × D2MEB 2.2 family. Bars above and below each point are 95% confidence intervals.
D2MEB × D2S3 7.1:
Among the 33 D2MEB × D2S3 7.1 F2 females, there were significant associations between disseminated infections and genotypes from 20 to 59 cM on chromosome I and at Apolipo2 on chromosome III (Figure 1). There was also an association between midgut infections and genotypes at DefA on chromosome III. Among the 241 F5 females, there were significant associations between disseminated infections and genotypes from 30 to 59 cM on chromosome I, at AEGI18 and TrypAbun on chromosome II, and at Elastase, RNAHelic, and AspSyn on chromosome III. There were significant associations between midgut infections and genotypes at TrypAbun on chromosome II and at Apolipo2 and RNAHelic on chromosome III.
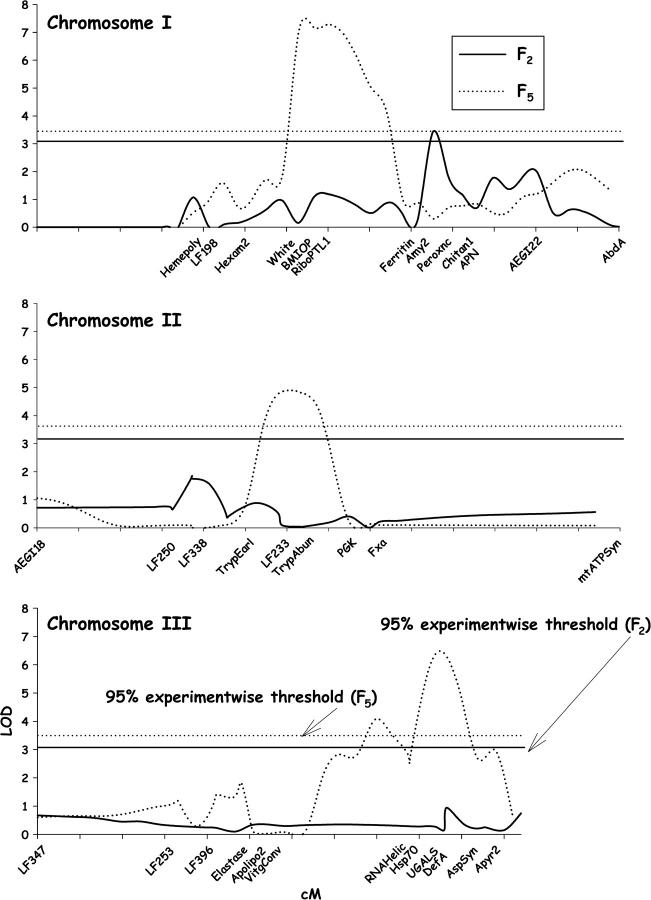
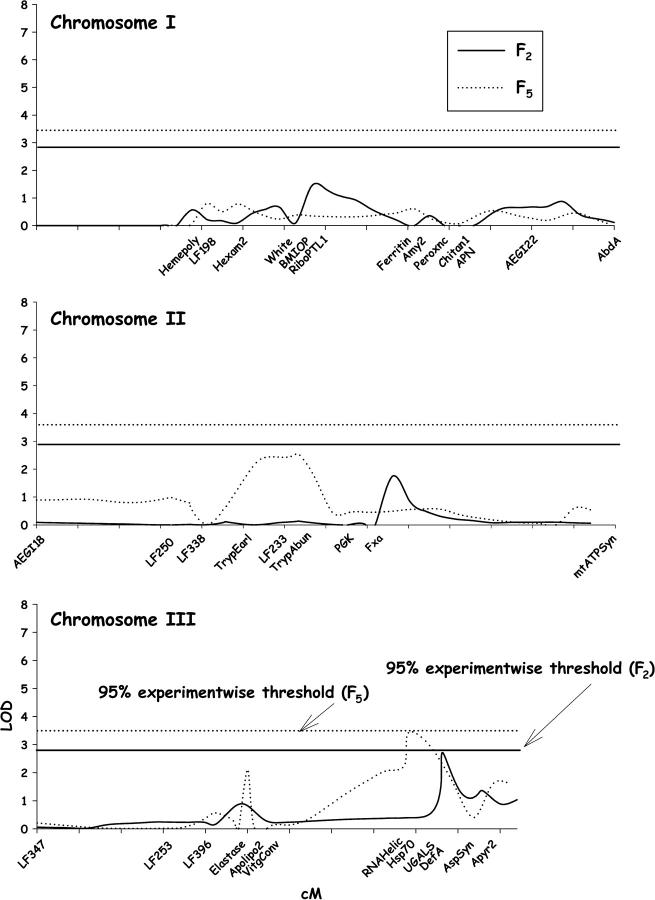
The results of composite-interval mapping for disseminated infections in F2 and F5 D2MEB × D2S3 females are shown in Figure 4. In the F2, the original LOD values exceeded the 95% experimentwise thresholds at 47 cM on chromosome I. With multiple-interval mapping, σ2g accounted for 34.4% of the σ2p for disseminated infections in the F2 (Table 1) but none of the effects were significant. In the F5 the original LOD values exceeded the 95% experimentwise thresholds at 30–45 cM on chromosome I, at 25–35 cM on chromosome II, and at 40–55 cM on chromosome III. With multiple-interval mapping, σ2g accounted for 45.1% of the σ2p for disseminated infections in the F5 (Table 1).
Figure 4.—
Plot of LOD values associated with disseminated infection rates along chromosomes I–III in the D2MEB × D2S3 7.1 family. Names of markers are listed to orient QTL positions relative to Figure 1. LOD estimated in the F2 by composite-interval mapping appears as a solid line and the 95% experimentwise threshold is represented by a straight solid line. LOD and the 95% experimentwise thresholds estimated in the F5 appear as dotted lines.
For midgut infections, the original LOD values reached the 95% experimentwise thresholds at 25 cM on chromosome II in the F2 and at 44 cM on chromosome III in the F5 (Figure 5). With multiple-interval mapping in the F2, σ2g accounted for 9% of σ2p for midgut infections (Table 1) but none of the effects was significant. However, with multiple-interval mapping in the F5, σ2g accounted for 18.7% of σ2p (Table 1).
Figure 5.—
Plot of LOD values associated with midgut infection rates along chromosomes I–III in the D2MEB × D2S3 7.1 family. Names of markers are listed to orient QTL positions relative to Figure 1.
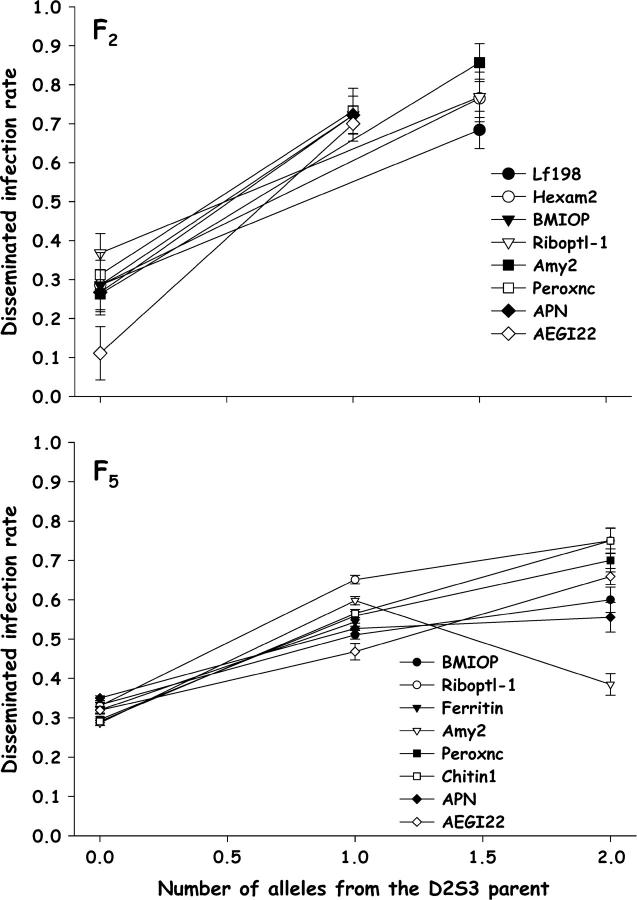
Numbers of alleles inherited from the D2S3 P1 parent were plotted against rates of disseminated infection. The observed patterns in the F2 offspring were entirely consistent with a larger number of disseminated infections being associated with alleles from the D2S3 strain for markers on all chromosomes (Figure 6).
Figure 6.—
Plot of disseminated infection rates as a function of the number of alleles inherited from the D2S3 P1 parent for significant markers on chromosome I (Figure 1) in the D2MEB × D2S3 7.1 in the F2 (top) and F5 (bottom). Bars above and below each point are 95% confidence intervals.
With the exception of Amy2, susceptibility alleles on the chromosome I QTL were additive in conditioning disseminated infections in the F5 (Figure 6). In multiple-interval mapping, more variance in σ2g associated with Riboptl1 was attributable to additive effects (16.1%; Table 1). Susceptibility alleles were also additive in conditioning disseminated infections on the chromosome II QTL (Figure 6). In multiple-interval mapping, all of the variance in σ2g associated with TrypAbun was attributable to additive effects (8.6%; Table 1). In contrast, susceptibility alleles are recessive in the chromosome III disseminated infection QTL (Figure 6). In multiple-interval mapping, equal amounts of variance in σ2g associated with RNAHelic were associated with additive and dominance effects (8.0 and 7.4%, respectively; Table 1).
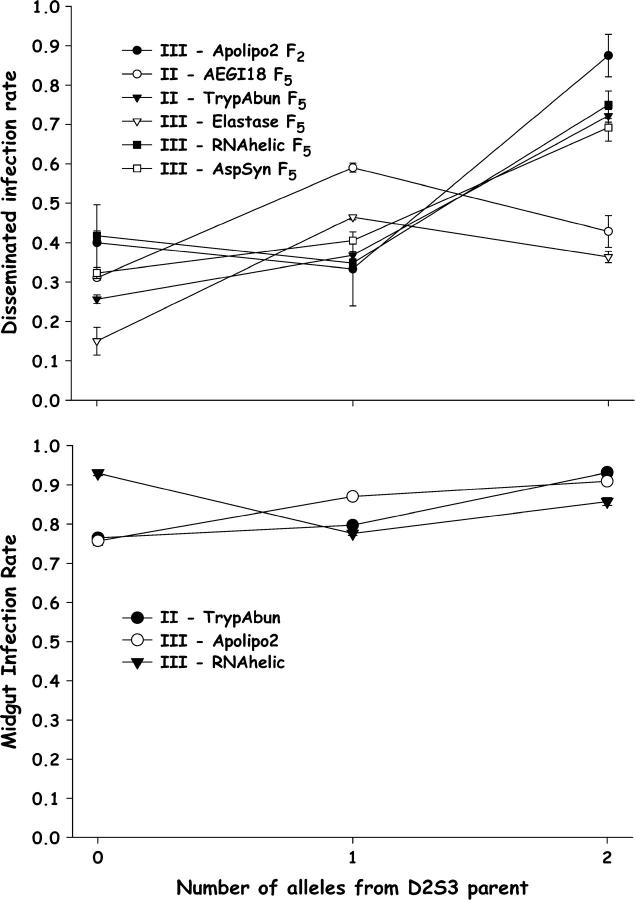
The numbers of D2S3 alleles were also plotted against the proportion of mosquitoes with infected midguts (Figure 7). The observed patterns were consistent with a higher number of mosquitoes with infected midguts being associated with alleles from the D2S3 strain. However, the variance in midgut infections among genotypes was slight. Multiple-interval mapping detected and verified a midgut infection QTL at 32 cM on chromosome II and at 25 and 44 cM on chromosome III. In addition, an epistatic interaction was detected between the QTL at 25 and 44 cM on chromosome III. This epistatic interaction is evident in Figure 7. When alleles at the 25 and 44 cM QTL were homozygous for D2MEB alleles, the proportion of mosquitoes with a disseminated infection at the 44-cM QTL exceeded the proportion at the 25-cM QTL. However, when alleles at the 25- and 44-cM QTL are heterozygous or homozygous for D2S3 alleles, the 44-cM QTL rate of dissemination is lower than the 25-cM QTL rate. This interaction appears to occur because D2S3 alleles at the 25-cM QTL are additive but are dominant at the 44-cM QTL. Note also that additive and dominance values (Table 1) are opposite in sign between the 25- and 44-cM QTL.
Figure 7.—
Plot of (A) disseminated infection and (B) midgut infection rates as a function of the number of alleles inherited from the D2S3 P1 parent for significant markers on chromosomes II and III (Figure 1) in the D2MEB × D2S3 7.1 family. Bars above and below each point are 95% confidence intervals.
DISCUSSION
Family-based selection is often necessary to maintain the viability of Ae. aegypti strains due to a high load of deleterious and lethal recessive genes in this and other Aedes species (Gomez-Machorro et al. 2004; Munstermann 1994). The genetic diversity in D2MEB generated by family-based selection probably caused the large disparity in the presence and magnitude of QTL between the two reciprocal crosses. Clearly the genome of the D2MEB × D2S3 mother contained distinct QTL with strong effects on disseminated infection or midgut infection while the father's genome in the D2S3 × D2MEB cross did not. Furthermore, Figure 2 shows that alleles inherited from the D2MEB parent actually conferred higher disseminated infection rates than alleles inherited through the D2S3 parent. These observations are consistent with the presence of a series of hypermorphic or hypomorphic alleles at disseminated infection QTL in D2MEB.
Advanced intercross lines (Darvasi and Soller 1995) were generated from each reciprocal cross in this study because of the relatively small numbers of F2 females with midgut infections (62 D2S3 × D2MEB; 33 D2MEB × D2S3) that could be used for mapping disseminated infection QTL. This is the most likely reason for the observed increase in the number of QTL from the F2 to the F5 generations of D2MEB × D2S3 7.1. In addition, when analyzing female-limited traits, advanced intercross lines are essential for testing for sex-linked QTL. This is due to insufficient recombination between the sex locus and markers/QTL on chromosome I in F2 progeny to estimate linkage with markers arising in the P1 father. Usually few if any paternal genotypes appear in F2 females. This is probably why the position and magnitude of the chromosome I QTL shifted between the F2 and F5 generations.
The identification of QTL regions associated with dengue-2 infection will become the starting point for future efforts to clone and characterize the actual genes that confer MIBs and MEBs. The limiting factor at this point may be the relatively low rate of recombination observed in the Ae. aegypti genome (1.0–3.4 Mbp/cM) (Brown et al. 2001), as the ability to create a highly resolved map upon which to base map-based positional cloning is directly dependent upon the number of recombination events between a marker and the actual QTL. Advanced intercross lines may become a viable solution to the low recombination rate in Ae. aegypti. As the number of generations increases, the amount of recombination observed in a segregating population increases, and this in turn increases the mapping resolution that can be obtained. Advanced intercross lines maintained through many generations will provide highly accurate estimates of the order of genetic markers flanking a QTL. D2MEB × D2S3 7.1 is now in the F13 generation and adults generally demonstrate good longevity and fecundity. In contrast, D2S3 × D2MEB 2.2 died out in the F11 generation due mostly to low egg and larval survivorship.
Bosio et al. (2000) mapped a disseminated infection QTL between 47 and 57 cM on chromosome III albeit with weak support (only 29 of the F2 females had infected midguts). Similarly, Gomez-Machorro et al. (2004) mapped with weak support a disseminated infection QTL at 45 cM on chromosome I. This study thus brings to three (one on each chromosome) the number of disseminated infection QTL in Ae. aegypti. Bosio et al. (2000) also mapped midgut infection QTL near TrypEarl between 20 and 25 cM on chromosome II and near Apolipo2 at 25 cM on chromosome III. The present study found an association between genotypes at TrypAbun at 32 cM on chromosome II and genotypes at Apolipo2 at 25 cM and at RNAHelic at 44 cM on chromosome III. Gomez-Machorro et al. (2004) mapped different midgut infection QTL in the first 10 cM of chromosome I and at 41–43 cM on chromosome II. This study thus brings to six (one on chromosome I, three on II, and two on III) the number of midgut infection QTL in Ae. aegypti. In total we have therefore identified nine QTL that appear to condition dengue-2 transmission in Ae. aegypti.
We are not surprised by the discovery of large numbers of QTL that condition dengue-2 transmission in Ae. aegypti populations. Cleavage of dengue-2 proteins, attachment/penetration of midgut epithelial cells, uncoating, transcription, and translation are all viral processes that exploit Ae. aegypti proteins and physiological processes. Deficiencies in any or all of these proteins or processes would constitute a MIB. Similarly, following virion maturation, infectious particles must disseminate from the midgut epithelium and infect secondary target organs. A MEB could be associated with any events that prevent infectious virions from disseminating to the hemocoele or infecting secondary target organs. Overall, we predict a minimum of 20–30 different mosquito proteins may be required for flaviviruses to complete their life cycles. Many of these proteins may be essential for mosquito survival and are therefore constrained by purifying selection. However, some may vary in transcription, translation, or activity and may in turn affect viral infection, replication, or transmission. These are likely to be the genes revealed by QTL-mapping studies. Other mechanisms (e.g., transcription factors) are possible and this represents the strength of the “top-down” approach of QTL mapping.
We find it encouraging that in this, our third study of dengue-2 infection QTL in Ae. aegypti, we are beginning to recover QTL in proximate genome positions on chromosomes I and III. We are in the process of isolating each of the three disseminated infection QTL from D2MEB × D2S3 7.1 into three lines, using marker-assisted selection (Lande and Thompson 1990; Gimelfarb and Lande 1994a,b) on genotypes at Riboptl1 on I, at TrypAbun on II, and at AspSyn on III.
Acknowledgments
Barry Miller, Carol Blair, and Carolina Barillas-Mury served on Dr. Bennett's graduate committee. This research was supported by National Institutes of Health (NIH) grant R01-AI49256 and NIH grant U01AI45430.
References
- Barrett, A. D., and T. P. Monath, 2003. Epidemiology and ecology of yellow fever virus. Adv. Virus Res. 61: 291–315. [DOI] [PubMed] [Google Scholar]
- Basten, C. J., B. S. Weir and Z-B. Zeng, 2002 QTL Cartographer. Department of Statistics, North Carolina State University, Raleigh, NC.
- Bennett, K. E., K. E. Olson, L. Munoz Mde, I. Fernandez-Salas, J. A. Farfan-Ale et al., 2002. Variation in vector competence for dengue 2 virus among 24 collections of Aedes aegypti from Mexico and the United States. Am. J. Trop. Med. Hyg. 67: 85–92. [DOI] [PubMed] [Google Scholar]
- Bennett, K. E., B. J. Beaty and W. C. Black, 2005. Selection of DS3, an Aedes aegypti strain with high oral susceptibility to dengue 2 virus and DMEB, a strain with a midgut barrier to dengue escape. J. Med. Entomol. 42: 110–119. [DOI] [PubMed] [Google Scholar]
- Black, W. C., and N. M. DuTeau, 1997 RAPD-PCR and SSCP analysis for insect population genetic studies, pp. 361–373 in The Molecular Biology of Insect Disease Vectors: A Methods Manual, edited by J. Crampton, C. B. Beard and C. Louis. Chapman & Hall, New York.
- Black, W. C., and D. W. Severson, 2004 Genetics of vector competence, pp. 415–448 in Biology of Disease Vectors, edited by W. C. Marquardt. Harcourt Academic Press, San Diego.
- Bosio, C. F., B. J. Beaty and W. C. T. Black, 1998. Quantitative genetics of vector competence for dengue-2 virus in Aedes aegypti. Am. J. Trop. Med. Hyg. 59: 965–970. [DOI] [PubMed] [Google Scholar]
- Bosio, C. F., R. E. Fulton, M. L. Salasek, B. J. Beaty and W. C. T. Black, 2000. Quantitative trait loci that control vector competence for dengue-2 virus in the mosquito Aedes aegypti. Genetics 156: 687–698. [DOI] [PMC free article] [PubMed] [Google Scholar]
- Brown, S. E., D. W. Severson, L. A. Smith and D. L. Knudson, 2001. Integration of the Aedes aegypti mosquito genetic linkage and physical maps. Genetics 157: 1299–1305. [DOI] [PMC free article] [PubMed] [Google Scholar]
- Darvasi, A., and M. Soller, 1995. Advanced intercross lines, an experimental population for fine genetic mapping. Genetics 141: 1199–1207. [DOI] [PMC free article] [PubMed] [Google Scholar]
- Fagerberg, A. J., R. E. Fulton and W. C. Black, 2001. Microsatellite loci are not abundant in all arthropod genomes: analyses in the hard tick, Ixodes scapularis and the yellow fever mosquito, Aedes aegypti. Insect Mol. Biol. 10: 225–236. [DOI] [PubMed] [Google Scholar]
- Fulton, R. E., M. L. Salasek, N. M. DuTeau and W. C. Black, 2001. SSCP analysis of cDNA markers provides a dense linkage map of the Aedes aegypti genome. Genetics 158: 715–726. [DOI] [PMC free article] [PubMed] [Google Scholar]
- Gimelfarb, A., and R. Lande, 1994. a Simulation of marker assisted selection for non-additive traits. Genet. Res. 64: 127–136. [DOI] [PubMed] [Google Scholar]
- Gimelfarb, A., and R. Lande, 1994. b Simulation of marker assisted selection in hybrid populations. Genet. Res. 63: 39–47. [DOI] [PubMed] [Google Scholar]
- Gomez-Machorro, C., K. E. Bennett, M. L. Munoz and W. C. Black, 2004. Quantitative trait loci affecting dengue midgut infection barriers in an advanced intercross line of Aedes aegypti. Insect Mol. Biol. 13: 637–648. [DOI] [PubMed] [Google Scholar]
- Gubler, D. J., 2002. The global emergence/resurgence of arboviral diseases as public health problems. Arch. Med. Res. 33: 330–342. [DOI] [PubMed] [Google Scholar]
- Gubler, D. J., S. Nalim, R. Tan, H. Saipan and J. Sulianti Saroso, 1979. Variation in susceptibility to oral infection with dengue viruses among geographic strains of Aedes aegypti. Am. J. Trop. Med. Hyg. 28: 1045–1052. [DOI] [PubMed] [Google Scholar]
- Hardy, J. L., 1988 Susceptibility and resistance of vector mosquitoes, pp. 87–126 in The Arboviruses: Epidemiology and Ecology, edited by T. P. Monath. CRC Press, Boca Raton, FL.
- Lande, R., and R. Thompson, 1990. Efficiency of marker-assisted selection in the improvement of quantitative traits. Genetics 124: 743–756. [DOI] [PMC free article] [PubMed] [Google Scholar]
- Munstermann, L. E., 1994. Unexpected genetic consequences of colonization and inbreeding—allozyme tracking in Culicidae (Diptera). Ann. Entomol. Soc. Am. 87: 157–164. [Google Scholar]
- Severson, D. W., J. K. Meece, D. D. Lovin, G. Saha and I. Morlais, 2002. Linkage map organization of expressed sequence tags and sequence tagged sites in the mosquito, Aedes aegypti. Insect Mol. Biol. 11: 371–378. [DOI] [PubMed] [Google Scholar]
- Tabachnick, W. J., G. P. Wallis, T. H. Aitken, B. R. Miller, G. D. Amato et al., 1985. Oral infection of Aedes aegypti with yellow fever virus: geographic variation and genetic considerations. Am. J. Trop. Med. Hyg. 34: 1219–1224. [DOI] [PubMed] [Google Scholar]
- Woodring, J. L., S. Higgs and B. J. Beaty, 1996 Natural cycles of vector borne pathogens, pp. 51–72 in Biology of Disease Vectors, edited by W. C. Marquardt and B. J. Beaty. University of Colorado Press, Boulder, CO.
- Zeng, Z-B., 1994. Precision mapping of quantitative trait loci. Genetics 136: 1457–1468. [DOI] [PMC free article] [PubMed] [Google Scholar]
- Zeng, Z-B., C. H. Kao and C. J. Basten, 1999. Estimating the genetic architecture of quantitative traits. Genet. Res. 74: 279–289. [DOI] [PubMed] [Google Scholar]


