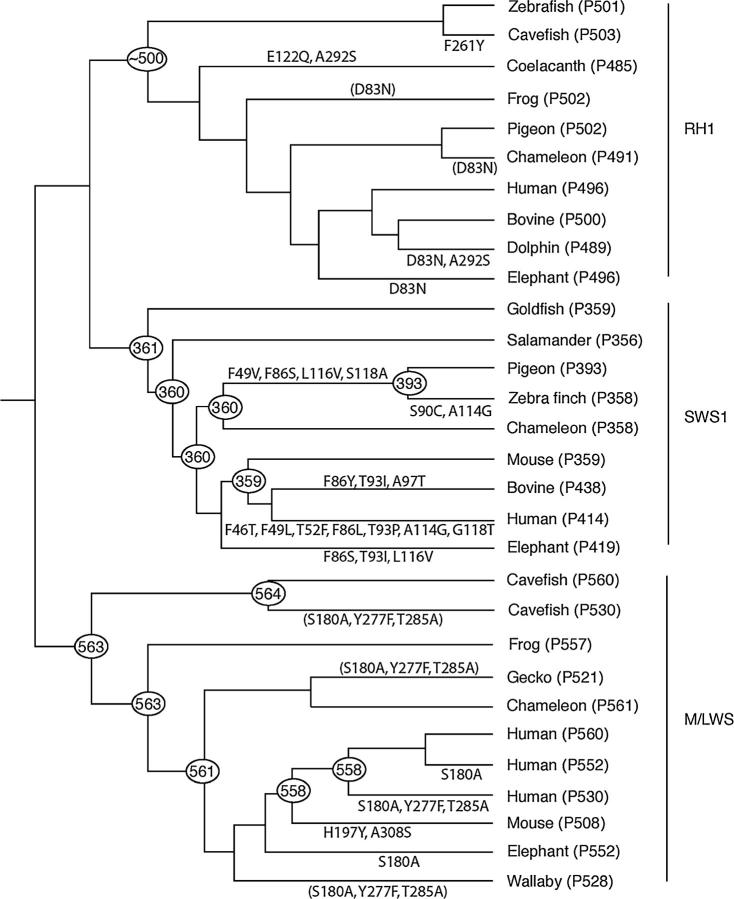
Figure 3.—
The phylogenetic tree of some representative RH1, SWS1, and LWS pigments. The numbers after P and at the nodes refer to λmax-values. Zebrafish (Danio rerio), cavefish (Astyanax fasciatus), goldfish (Carassius auratus), coelacanth (Latimeria chalamnae), frog (Xenopus laevis), salamander (Ambystoma tigrinum), pigeon (Columba livia), zebra finch (Taeniopygia guttata), chameleon (Anolis carolinensis), human (Homo sapiens), bovine (Bos taurus), dolphin (Tursiops truncates), mouse (Mus musculus), and elephant (Loxodonta africana) are shown. The λmax-values of the ancestral SWS1 and M/LWS pigments are taken from Shi and Yokoyama (2003) and Yokoyama and Radlwimmer (2001), respectively. Amino acid changes whose λmax-shifts are not evaluated are shown in parentheses. The branch lengths are not to scale.

