

Abstract
The lateral superior olive (LSO) is believed to encode differences in sound level at the two ears, a cue for azimuthal sound location. Most high-frequency-sensitive LSO neurons are binaural, receiving inputs from both ears. An inhibitory input from the contralateral ear, via the medial nucleus of the trapezoid body (MNTB), and excitatory input from the ipsilateral ear enable level differences to be encoded. However, the classical descriptions of low-frequency-sensitive neurons report primarily monaural cells with no contralateral inhibition. Anatomical and physiological evidence, however, shows that low-frequency LSO neurons receive low-frequency inhibitory input from ipsilateral MNTB, which in turn receives excitatory input from the contralateral cochlear nucleus and low-frequency excitatory input from the ipsilateral cochlear nucleus. Therefore, these neurons would be expected to be binaural with contralateral inhibition. Here, we re-examined binaural interaction in low-frequency (less than ∼3 kHz) LSO neurons and phase locking in the MNTB. Phase locking to low-frequency tones in MNTB and ipsilaterally driven LSO neurons with frequency sensitivities <1.2 kHz was enhanced relative to the auditory nerve. Moreover, most low-frequency LSO neurons exhibited contralateral inhibition: ipsilaterally driven responses were suppressed by raising the level of the contralateral stimulus; most neurons were sensitive to interaural time delays in pure tone and noise stimuli such that inhibition was nearly maximal when the stimuli were presented to the ears in-phase. The data demonstrate that low-frequency LSO neurons of cat are not monaural and can exhibit contralateral inhibition like their high-frequency counterparts.
Keywords: lateral superior olive, medial nucleus of the trapezoid body, interaural time delay, interaural level difference, sound localization, phase locking
Introduction
For ∼100 years, the Duplex theory has posited that low- and high-frequency sounds are localized using two different acoustical cues, interaural time delays (ITDs) and interaural level differences (ILDs), respectively (Rayleigh, 1907). Psychophysical data have generally supported the theory for pure tones (Stevens and Newman, 1936; Mills, 1958). Anatomical and physiological studies have revealed two parallel brainstem pathways that appear to encode ITDs and ILDs separately (Yin, 2002). ITDs are extracted by medial superior olive neurons in which ITD sensitivity results from the coincident arrival of excitatory inputs from the two ears [excitatory-excitatory (EE) binaural interaction], causing maximal responses when the ITD in the stimulus offsets differences in neural conduction times from the ears. ILDs are extracted by lateral superior olive (LSO) neurons via a subtraction-like process resulting from inhibitory inputs from the contralateral and excitatory inputs from the ipsilateral ear [inhibitory-excitatory (IE) binaural interaction]. The dual brainstem pathways provide anatomical and physiological correlates of the Duplex theory.
LSO neurons encode ILDs for high-frequency sounds in which the cues are physically available (Boudreau and Tsuchitani, 1968; Tollin, 2003), but there are discrepancies regarding low-frequency neurons. The classical descriptions of LSO report that low-frequency neurons are not binaural but rather are monaural in that they respond to stimuli presented to only one ear (Boudreau and Tsuchitani, 1968; Guinan et al., 1972b; Tsuchitani, 1977). Batra et al. (1997) were also unable to find low-frequency IE neurons in the rabbit brainstem, although it appears they only used monaural responses to assess the presence of inhibitory input via reductions in spontaneous activity. However, anatomical and physiological evidence predicts that low-frequency LSO neurons should exhibit IE interaction and thus respond to ILDs. First, these neurons receive excitatory input from neurons in the ipsilateral cochlear nucleus and frequency-matched input from glycinergic, inhibitory cells of the ipsilateral medial nucleus of the trapezoid body (MNTB), which in turn receives excitatory input from neurons in the contralateral cochlear nucleus (Glendenning et al., 1985; Smith et al., 1993, 1998). Low-frequency LSO neurons would also be expected to be sensitive to ITDs in the ongoing “fine structure” of low-frequency sounds, because the afferents preserve temporal information in the fine structure of the sounds from both ears: low-frequency neurons of the ipsilateral cochlear nucleus (Joris et al., 1994) and the MNTB exhibit phase-locked action potentials that occur at particular phases of low-frequency tones (Smith et al., 1998; Kopp-Scheinpflug et al., 2003). We hypothesize that the ITD that offsets the differences in neural conduction times from the two ears should result in the coincident arrival of excitation and inhibition from the ipsilateral and contralateral ears, respectively. Consequently, LSO neurons will be maximally inhibited at this delay. Low-frequency LSO neurons sensitive to ILDs have been reported (Caird and Klinke, 1983; Finlayson and Caspary, 1991; Spitzer and Semple, 1995; Joris and Yin, 1995), but few studies in the cat (Caird and Klinke, 1983; Joris and Yin, 1995) have reported ITD-sensitive cells of the type just described nor have they been studied in detail. Here, we report results from low-characteristic-frequency (less than ∼3 kHz) LSO and MNTB neurons.
Materials and Methods
General
All procedures used were approved by the University of Wisconsin Animal Care and Use Committee and also complied with the National Institutes of Health guidelines for animal use. Adult female cats were anesthetized initially with ketamine hydrochloride (20 mg/kg) along with acepromazine (0.1 mg/kg). Atropine sulfate (0.05 mg/kg) was also administered to reduce mucous secretions. A venous cannula was implanted in the femoral vein through which supplemental doses of sodium pentobarbital (3-5 mg/kg) were administered as needed to maintain areflexia. The cat's temperature was monitored continuously with a rectal thermometer and maintained with a heating pad at 37°C. A tracheal cannula was inserted to facilitate respiration. Both pinnas were removed, and tight-fitting hollow earpieces were fitted snugly into the external auditory meati. Polyethylene tubing (PE-90; 30 cm; inner diameter, 0.9 mm; Clay Adams, New York, NY) was glued into a small hole made in each bulla to maintain normal middle-ear pressure.
A ventral transpharyngeal approach was used, and the LSO was accessed by drilling small holes into the basioccipital bone. Small slits were then made in the dura through which parylene-coated tungsten microelectrodes (1-2 MΩ; Microprobe, Clarksburg, MD) were advanced ventromedial to dorsolateral at an angle of 26-30° into the brainstem by a hydraulic microdrive affixed to a micromanipulator (Trent Wells, Coulterville, CA) that could be advanced remotely from outside the double-walled sound-attenuating recording chamber (Industrial Acoustics Company, Bronx, NY). Electrical activity was amplified and filtered between 300 and 3000 Hz (model CR4; Princeton Applied Research, Oak Ridge, TN). Unit responses were discriminated with an amplitude-time window discriminator (model DIS-1; Bak Electronics, Mount Airy, MD), and spike times were stored at a precision of 1 μs via custom-built equipment.
Histology
In most experiments, electrolytic DC lesions were made to differentiate electrode tracks, mark locations of interest, and assist in estimating tissue shrinkage after histological processing. At the conclusion of each experiment, the brain was fixed in 10% formalin by immersion or perfusion through the heart. The fixed tissue was cut into 50 μm frozen sections and stained with cresyl violet so that electrode tracts and lesions could be seen. Figure 1 shows a section of brainstem from an experiment in which two low-frequency LSO neurons were recorded from two parallel electrode penetrations.
Figure 1.

Light micrograph of the left side of the superior olivary complex showing two electrode penetrations through the LSO. An electrolytic DC lesion marks the locations of one of the low-characteristic-frequency LSO neurons (arrow; 108-5, characteristic frequency, 1.35 kHz; and 108-9, characteristic frequency, 1.75 kHz). The major nuclei and landmarks of the superior olivary complex are denoted. MSO, Medial superior olive; TB, trapezoid body; Pyr, pyramidal tract.
Stimuli
General. All stimuli were generated digitally at 16 bit resolution and converted to analog at a rate of 100 kHz via the custom-built digital stimulus system designed by Rhode (1976). Overall stimulus level was controlled using programmable attenuators. The conditioned output of the digital-to-analog converter was sent to an acoustic assembly (one for each ear) comprising an electrodynamic speaker (40-1377; Realistic, Fort Worth, TX), a calibrated probe-tube microphone (0.5 inch; Brüel & Kjær, Norcross, GA), and a hollow earpiece that was fit and sealed snugly into the cut end of the auditory meatus. The hollow earpiece accommodated the small probe-tube microphone by which the sound delivery system to each ear was calibrated for tones between 50 Hz and 40 kHz in 50 Hz steps. The calibration data were used to compute digital filters that equalized the responses of the acoustical system and typically yielded flat frequency responses within ±2 dB for frequencies <25 kHz.
Tone bursts of varying frequency were used as search stimuli with the sound pressure level of the tone to the ipsilateral ear being 5-10 dB higher than the tone to the contralateral ear so that the IE cells of the LSO would not be missed. Once a single unit was isolated and the excitatory ear determined, its characteristic frequency and threshold level were measured using an automated tracking procedure based on that by Kiang et al. (1970). Discharge rate was measured as a function of sound pressure level by presenting 200 repetitions of a 50 ms duration tone (3.9 ms rise/fall times) every 100 ms at the characteristic frequency at different sound pressure levels in 5-10 dB steps. From these rate-level functions, the resulting poststimulus time and period histograms were examined. Phase locking (or synchrony), which measures the tendency of a neuron to fire action potentials that are synchronized to a particular phase of a sinusoidal stimulus, was measured by computing the synchronization coefficient (Goldberg and Brown, 1969). To determine the presence and nature of any binaural interaction, a characteristic frequency tone or broadband noise (300 ms duration presented every 500 ms with a rise/fall time of 4 ms) was presented to the ipsilateral ear at 10-20 dB above the threshold level while the level of a corresponding characteristic frequency tone or noise presented to the contralateral ear was varied. This procedure reveals whether ipsilaterally evoked neural responses can be inhibited by contralateral stimulation, a hallmark of LSO cells.
Binaural beat. Sensitivity to ITDs of low-frequency tones was assessed in two ways. The first method used the binaural-beat stimulus (Kuwada et al., 1979). To create binaural beats, tones of 5 s in duration were presented to both ears ∼20-30 dB above ipsilateral-ear threshold but with a frequency difference of 1 Hz, usually with the tone to the ipsilateral ear having the higher frequency. The binaural-beat stimulus results in a dynamically changing difference in the phases of the tones presented to the two ears, or interaural phase difference (IPD), over a 1 s period (see Fig. 5C, inset, for example binaural beat). ITDs can be computed from IPDs by simply dividing the IPD by the stimulus frequency. For example, an IPD of 0.5 cycles with a 500 Hz stimulus is equivalent to an ITD of 1 ms, but the same IPD is equivalent to 0.5 ms for a 1000 Hz stimulus. As discussed below, we use IPDs in the analysis of the data because it allows the binaural sensitivity of a neuron to be classified in a common framework, regardless of the absolute sensitivity to ITDs. If the neuron is sensitive to IPD, then its response will be modulated systematically by the variation in IPD present in the binaural beats, which can be converted to an ITD.
Figure 5.

Example of a low-frequency (characteristic frequency, 440 Hz) LSO neuron that is sensitive to ILD and IPD. Same neuron as in Figure 3. A, Mean discharge rate as a function of ILD of characteristic frequency tones. ILD (bottom abscissa) was varied by fixing the level at the ipsilateral ear at 30 dB and changing the level of a simultaneously presented characteristic frequency tone to the contralateral ear (top abscissa). Consistent with IE binaural interaction, increases in the level of the contralateral tone inhibited ipsilaterally driven responses resulting in a sigmoidally shaped rate-ILD function. Error bars indicate ±1 SEM. B, Poststimulus time histograms (PSTHs; left column) to binaural beat stimuli created by presenting a tone at the stimulating frequency (top right, left column) to the ipsilateral ear and a tone at a frequency 1 Hz less to the contralateral ear. An example binaural beat (C, inset) is shown. IPD sensitivity is evidenced by the response modulation at 1 Hz. Period histograms (right column) were constructed from the PSTHs by binning the responses on the period of the beat frequency (1 s). As described in Materials and Methods, the period histograms were corrected by flipping them around the point of IPD of 0.5 cycles. Using this representation, responses were low when the tones to the two ears were in-phase (0.0 cycles) and increased when the tones were out-of-phase (0.5 cycles). Vector averaging of the period histograms for each stimulating frequency yields a mean interaural phase (ϕ; top left of panels in right column) and synchronization coefficient (r). Asterisks indicate significant (p < 0.001) phase locking to the 1 Hz beat frequency. C, Mean interaural phase (ϕb) from the binaural-beat stimuli (B) as a function of frequency. The CD and CP are estimated from the slope and y-intercept of the best-fitting line to the phase-frequency data (solid line) and are indicated in the top left of the panel. D, The IPD sensitivity of the neuron as expressed in the binaural-beat period histograms (B) can be converted to an equivalent ITD sensitivity by dividing the IPD by the stimulus frequency and reorganizing the abscissa, as indicated by the drop lines. Stimulus frequency was 400 Hz. The location of the CD is indicated with an arrow. The solid line in bottom panel shows a smoothed version of the data. IPSI or Ipsi, Ipsilateral; CONTRA or Contra, contralateral.
Responses of LSO neurons to the 1 Hz binaural-beat stimuli were obtained at several different frequencies near the characteristic frequency of each neuron. At each frequency, the stimulus was repeated three times with a 1 s interstimulus interval. To characterize the tendency of these neurons to phase lock or fire action potentials at particular IPDs, period histograms were constructed by binning (64 bins) the responses on the period (1 s) of the binaural-beat frequency (1 Hz). Note that stimuli presented in the configuration we used, with the ipsilateral ear having the higher frequency, were equivalent to a “negative” binaural beat by our convention (Kuwada et al., 1979; Yin and Kuwada, 1983). To be consistent with previous studies, the interaural phase was “corrected” by flipping the period histograms around the point of IPD of 0.5 cycles when this stimulus configuration was used. From these corrected histograms, the mean IPD and the interaural synchronization coefficient, a measure of the precision of phase locking, were determined for each stimulating frequency. Significance of interaural phase locking was evaluated with the Rayleigh test (Mardia, 1972) at the p < 0.001 level. The characteristic delay (CD) (Yin and Kuwada, 1983) and characteristic phase (CP) were determined by fitting a line (least-squares procedure) to a plot of the mean IPD of the response to different frequencies, with each IPD being weighted by the product of the synchronization coefficient and the total number of spikes (Batra et al., 1997). CD is given by the slope of the phase-frequency plot and represents the relative difference in neural conduction delays between the inputs to the neuron from the two ears. The CP is determined from the y-intercept value of the phase-frequency plot at 0 Hz and indicates whether coincident arrival of inputs from the two ears results in maximal or minimal responses. In our convention, positive CDs (CD > 0) indicate a delay to the ipsilateral input, simulating a stimulus in the contralateral sound field. A CP of 0.0 or 1.0 cycles indicates that the CD results in a maximal response from the neuron, which is consistent with EE neurons. A CP of 0.5 cycles indicates that the CD results in a minimal response from the neuron, consistent with IE neurons.
ITD sensitivity was also examined by presenting identical tokens of broadband noise with equal amplitude to the two ears but systematically varying the ITD. Here, ITDs were created by delaying the entire noise waveform. The resulting plots of mean discharge rate as a function of the ITD are called noise-delay functions. On occasion, we also assessed ITD sensitivity to pure tones at or near the characteristic frequency by presenting equal amplitude tones to the two ears but varying the ITD in the whole waveform, rather than using binaural beats.
Neuron classification. The LSO and MNTB neurons reported in this paper were classified based on two main factors: their physiological responses to tones and their anatomical location in the brainstem derived from histology. Physiologically, LSO neurons were identified by excitatory responses to ipsilateral and inhibitory responses to contralateral stimulation. Anatomically, these low-frequency LSO neurons were located in the lateral limb of the LSO. The low-frequency LSO neurons were invariably encountered deeper in the electrode penetration after having encountered high- to mid-frequency-sensitive IE neurons that were recorded in the medial and middle limbs, respectively, during the same penetrations. Their depth relative to the mid- to high-frequency neurons ranged from 441 to 1286 μm (mean, 731 μm). Given the angle of electrode penetration used in these experiments (26-30°), the maximum distances separating the medial and the middle limbs of the LSO from the lateral limb measured in a sample of our histological sections (see Fig. 1) ranged from ∼1300 to 750 μm, respectively. The depths of all the low-frequency LSO neurons relative to high-frequency LSO neurons recorded in the same penetration fell below these maximums. MNTB neurons were identified by the shape of their extracellularly recorded action potentials, which exhibit a prepotential that precedes the action potential by ∼500 μs (Guinan et al., 1972a; Guinan and Li, 1990; Smith et al., 1998) and by responses only to monaural contralateral stimulation. They were also invariably located early in the electrode track shortly after encountering trapezoid body fibers (see Fig. 1)
Results
Results are based on single-unit recordings of 16 LSO and 17 MNTB neurons, all with characteristic frequencies <3.2 kHz recorded from 15 cats. Within this sample, 11 of 16 LSO and 8 of 17 MNTB neurons had characteristic frequencies <1.5 kHz. All low-frequency LSO neurons were recorded during electrode penetrations that traversed the LSO (see Materials and Methods). The locations of 12 of 16 LSO neurons were verified through histology and electrode track reconstruction. Figure 1 shows an example histological section with two well stained parallel penetrations from which recordings of two low-frequency LSO neurons were obtained. The arrow indicates an electrolytic DC lesion made at the location of one of the neurons (characteristic frequency, 1.35 kHz), the responses of which are shown in Figure 7. All MNTB neurons responded only to contralateral stimulation, exhibited prepotentials in their action potential waveforms, and were encountered in the dorsolateral portion of the MNTB nucleus. Because of limited recording time, not all stimulus manipulations were presented to each neuron.
Figure 7.
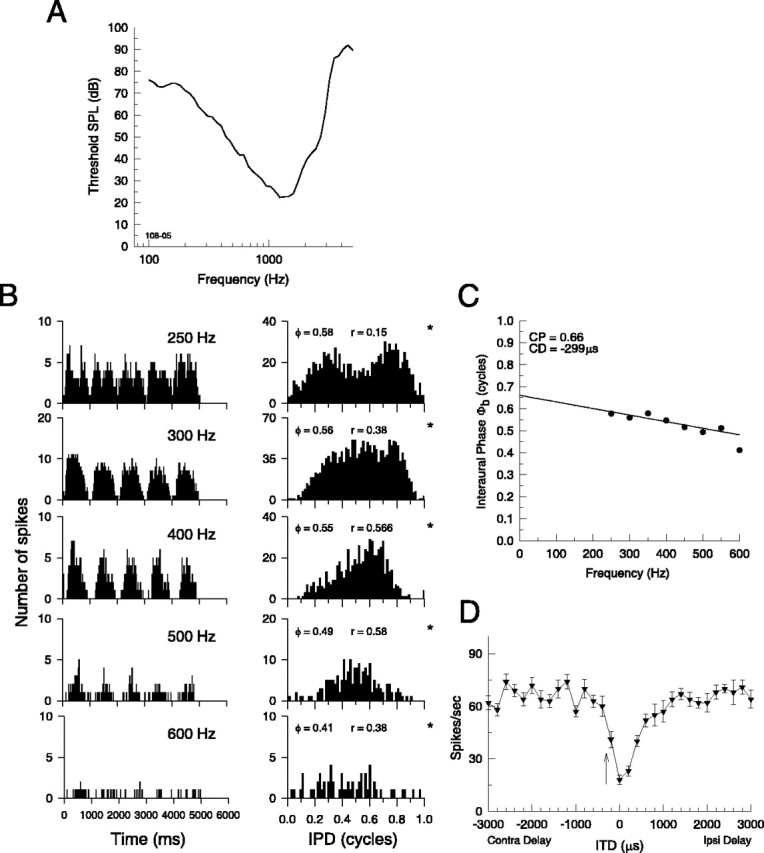
Another example of a low-characteristic-frequency LSO neuron that is sensitive to IPDs and ITDs in broadband noise stimuli. A, Frequency-threshold curve (characteristic frequency, 1.35 kHz). B-D, Same as in Figure 6, C and D. Here, the noise delay function has a response minimum for an ITD of 0 μs, compared with the delay predicted from the CD of -299 μs computed from B and C.ϕ, Mean interaural phase;ϕb, mean interaural phase from binaural-beat stimuli; *p < 0.001. Error bars represent ±1 SEM. SPL, Sound pressure level; Contra, contralateral; Ipsi, ipsilateral.
The reason for the small number of neurons in our sample deserves some explanation. Historically, LSO, and to a lesser degree MNTB, neurons, which are located deep in the brainstem in the cat, have proven to be difficult to access and record from with microelectrodes. As a result of the over-representation of high-frequency neurons in the LSO, the lateral limb where the low-frequency neurons are located is relatively small. The difficulty in recording from the low-characteristic frequency LSO neurons in the lateral limb is evident in the classic large-scale survey studies of the LSO. Of 432 neurons from all of the superior olivary complex (SOC) nuclei, Guinan et al. (1972b) recorded from only 22 LSO neurons, despite its relatively large size compared with other SOC nuclei (Fig. 1), and only a handful of these had low-characteristic frequencies; and Tsuchitani (1977) recorded from 244 LSO neurons, but only 16 (7%) of those had characteristic frequencies <2 kHz. As for low-frequency (<2 kHz) MNTB neurons, Smith et al. (1998) and Kopp-Scheinpflug et al. (2003) recorded from only two and three cells, respectively. Clearly, there is a need for additional studies of these neurons.
Low-frequency LSO and MNTB neurons exhibit highly synchronized phase locking
In order for central neurons such as those in the medial superior olive and the LSO to encode ITDs, the afferent inputs from both ears to these neurons must accurately encode the temporal characteristics of the stimuli. Here, we examine whether low-characteristic-frequency LSO and MNTB neurons exhibit phase-locked responses to pure-tone stimuli. Previous studies from our laboratory have already demonstrated the excellent, and often enhanced (relative to their auditory nerve inputs), phase-locking abilities of globular and spherical bushy cells of the cochlear nucleus that provide the inputs to the MNTB and the ipsilateral inputs to the LSO (Joris et al., 1994). Figure 2 shows the phase-locking ability of an MNTB neuron stimulated monaurally at the contralateral ear. Figure 2A shows the frequency tuning curve of this neuron, which had a characteristic frequency of 317 Hz. The frequency tuning curve shapes and bandwidths of these neurons were similar to that seen in the auditory nerve and in cochlear nucleus neurons of similar characteristic frequencies. Figure 2B shows that when presented with a 50 ms duration tone at the characteristic frequency, the discharge rate (filled circles) and the synchrony (open circles), which is a measure of the precision of phase locking, increased monotonically with increasing stimulus level. To illustrate how the synchronous firing of the neuron increases with stimulus level, Figure 2, C and D, shows the dot rasters and cycle histograms for 200 presentations of the characteristic frequency tone at the three levels indicated. At high stimulus levels (e.g., >35 dB), this neuron exhibits enhanced synchrony [relative to auditory nerve fibers (ANFs) with similar characteristic frequencies; see below] and entrainment, firing an action potential on virtually every single cycle of the stimulus. This is indicated by the discharge rate of the neuron, which asymptotes to almost exactly 317 Hz at these higher stimulus levels. Figure 3 shows in the same format the responses of a LSO neuron with a low characteristic frequency of 440 Hz (Fig. 3A). Figure 3B-D shows that when stimulated with a characteristic frequency tone presented to the ipsilateral, excitatory ear, this LSO neuron also exhibits a high degree of phase locking, with synchronization coefficients of 0.9 or greater. This LSO neuron exhibited a weakly nonmonotonic rate-level function.
Figure 2.
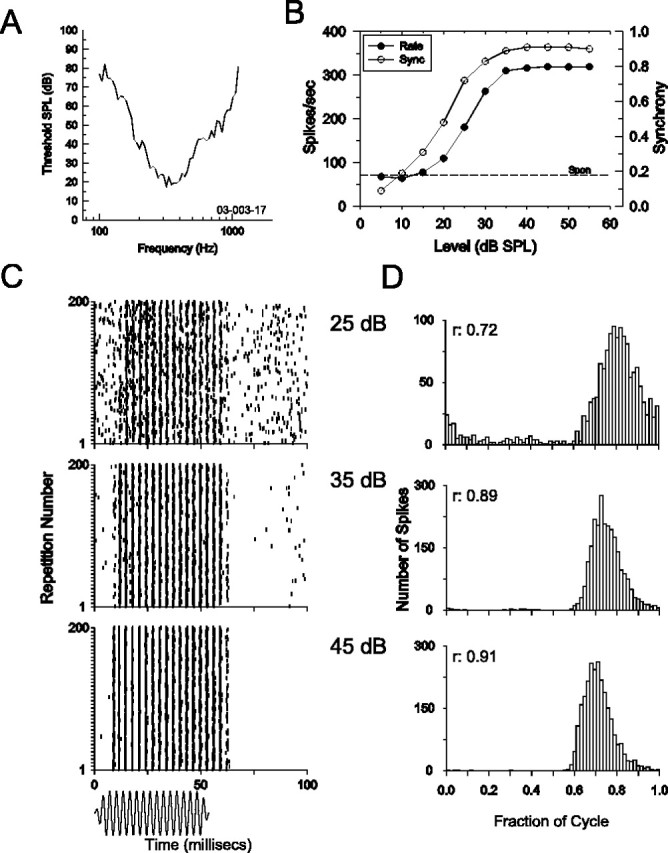
Phase-locked responses of a low-characteristic-frequency MNTB neuron to pure-tone stimuli. A, Frequency-threshold curve (characteristic frequency, 317 Hz). B, Both the discharge rate (left ordinate; filled circles) and response synchrony (Sync; right ordinate; open circles) increase with increasing level of a 50 ms duration characteristic frequency tone. Spontaneous rate is indicated by the dashed line (Spon; left ordinate). SPL, Sound pressure level. C, D, Dot rasters to 200 presentations of a 50 ms duration characteristic frequency tone (C) and associated period histograms (D) at three different stimulus levels. The responses are phase locked to the stimulus frequency, as evidenced by the tendency of spike times to line up vertically in the rasters (C) and for responses to occur at a particular phase angle resulting in peaked period histograms (D). The synchronization coefficients (r) of the responses in D are indicated in the inset. The time waveform of the characteristic frequency tone is shown below C.
Figure 3.
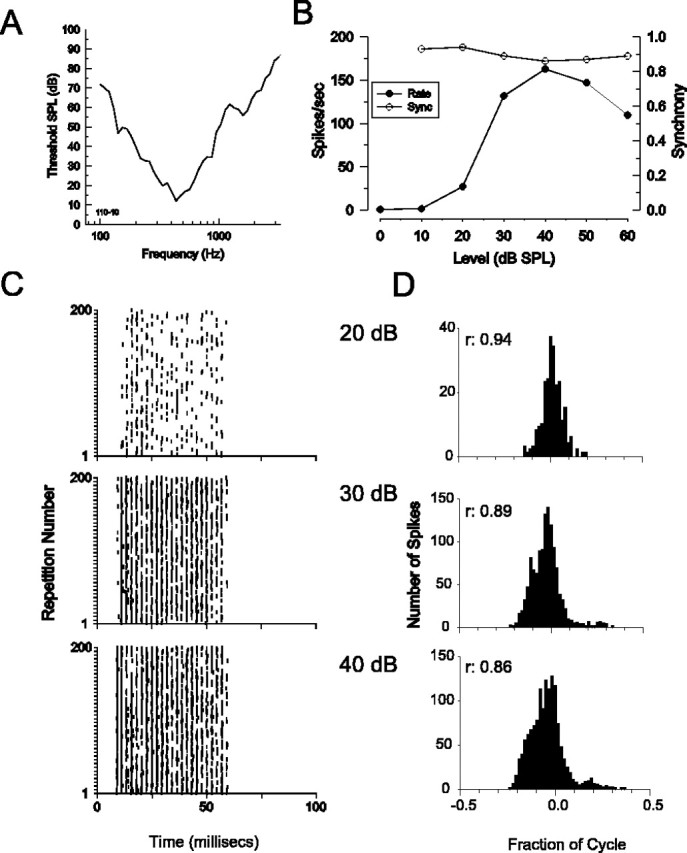
Phase-locked responses of a low-characteristic-frequency LSO neuron to pure-tone stimuli. A-D, The same as in Figure 2, but, for a low-frequency LSO neuron stimulated with characteristic frequency (440 Hz; A), tones were presented to the excitatory ipsilateral ear only. The spontaneous rate for this neuron was 0 spikes/s. Note that because the response happened to fall near a stimulus phase of 0 cycles, the phase axis has been plotted from -0.5 to 0.5 cycles for ease of presentation. SPL, Sound pressure level; Sync, synchrony.
Figure 4 summarizes the synchronization coefficients of 17 MNTB and 10 LSO neurons as a function of the characteristic frequency of the neurons. For reference, also plotted are the synchronization coefficients from the population of auditory nerve fibers from the work by Johnson (1980). LSO (t(145) = 5.7; p < 0.0001) and MNTB (t(146) = 5.4; p < 0.0001) neurons with characteristic frequencies <1.2 kHz exhibited significantly enhanced synchronization to pure-tone stimuli. The synchronization is greater than that observed in auditory nerve fibers over the same ranges of characteristic frequencies. This enhanced synchrony is similar to the synchrony observed in low-characteristic frequency spherical and globular bushy cells (Joris et al., 1994), suggesting that the enhanced phase locking at those peripheral levels is preserved at the MNTB when stimulated contralaterally and at the LSO when stimulated ipsilaterally. For neurons with characteristic frequencies greater than ∼1.2 kHz, phase locking was clearly poorer than that exhibited by ANFs. This finding also mirrors the poorer phase locking observed in bushy cells at higher frequencies.
Figure 4.

Low-frequency MNTB and LSO neurons exhibit phase locking to characteristic frequency tones that is enhanced over that seen in ANFs. Maximum (Max) synchronization coefficients are plotted as a function of the characteristic frequencies for MNTB (filled circles) and ipsilaterally stimulated LSO (Ipsi LSO; filled triangles) neurons from this study and from the population of ANF (small open circles) from the study by Johnson (1980). For characteristic frequencies <1.2 kHz, LSO and MNTB neurons showed higher synchrony than ANFs with similar characteristic frequencies but lower synchrony for characteristic frequencies >1.2 kHz. Note that data points from three MNTB neurons overlap near 1 kHz, and two overlap near 2 kHz at a synchronization coefficient of 0.6.
Low-frequency LSO neurons can be sensitive to both ILDs and IPDs
The excellent phase locking exhibited by low-characteristic-frequency LSO and MNTB neurons suggests that individual low-frequency LSO neurons that exhibit IE binaural interaction might indeed be sensitive to IPDs in addition to ILDs. In Figure 5, we show that the same LSO neuron as shown in Figure 3 exhibits sensitivity to both ILDs and IPDs, and it illustrates how these neurons were studied. This neuron showed highly phase-locked responses to characteristic frequency tones (440 Hz) presented to the ipsilateral ear (Fig. 3). The function relating discharge rate to ILD, the rate-ILD function, for this neuron was studied by holding the level of a characteristic frequency tone presented to the ipsilateral excitatory ear constant at 30 dB (∼20 dB with respect to threshold), while increasing the level of a characteristic frequency tone simultaneously presented in-phase to the contralateral inhibitory ear (Fig. 5A, top abscissa). Consistent with IE binaural interaction, increases in sound level at the contralateral ear progressively inhibited the ipsilaterally driven responses resulting in a classical sigmoidally shaped rate-ILD function that is characteristic of LSO neurons. Figure 5B shows that the neuron was also sensitive to the dynamically changing IPDs in binaural beat stimuli (Fig. 5C, inset) in that the responses were clearly modulated by the 1 Hz binaural beat frequency. As indicated by the period histograms on the right (the asterisks indicate significant phase locking at the p < 0.001 level to the 1 Hz beat frequency), the response was minimal when the stimuli were nearly in-phase (at the IPD of 0 cycles) at the two ears and nearly maximal when the stimuli were nearly out-of-phase (at 0.5 cycles). Recall that the period histograms were created by flipping the histograms created from the responses in Figure 5B (left column) around 0.5 cycles (see Materials and Methods). Observing these corrected period histograms for this neuron, it is clear that inhibition tended to occur over the first half of the cycle where the binaural beat stimulus was such that the stimulus delivered to the contralateral ear (the input to LSO of which is inhibitory) was leading that to the ipsilateral ear (i.e., ipsilateral delay). Minimal inhibition occurred over the last half of the cycle, in which the stimulus configuration was reversed (Contra delay). In addition to the ILD sensitivity, this type of response to IPDs is wholly consistent with IE binaural interaction as well.
From the binaural-beat data at several different frequencies, the CP and CD were computed (Fig. 5C). The slope of the best-fitting line to the phase-frequency data indicates the CD, and the intercept indicates the CP. Indicative of IE binaural interaction, the CP was near 0.5 (0.61 cycles). The positive CD (+187 μs) indicates that the inhibitory input from the contralateral ear lags the excitatory input from the ipsilateral ear by 187 μs. The IPDs that occur over one cycle of the binaural-beat stimulus (Fig. 5C, inset) can be converted to equivalent ITDs by dividing the IPD axis of the period histograms by the stimulus frequency (see Materials and Methods). The period histograms can then be replotted as a function of this equivalent ITD. Figure 5D (top) shows an example period histogram created from the binaural-beat stimulus for a frequency of 400 Hz, which is replotted in terms of equivalent ITD (bottom). The drop lines show how the abscissa must be reorganized for this procedure. Figure 5D (bottom) shows the ITD sensitivity of this neuron. The location of the CD (187 μs) is shown. This LSO neuron was jointly sensitive to both ILD and IPD (and, equivalently, ITD), consistent with the expectations given IE binaural interaction and phase-locked inputs.
Figure 6 shows the results of another low-frequency LSO neuron with a characteristic frequency of 566 Hz (Fig. 6A). This neuron was also sensitive to ILDs (Fig. 6B) and IPDs of binaural beats (Fig. 6C,D). Consistent with IE binaural interaction, the CP for this neuron was near 0.5 (0.47) cycles with a CD of 235 μs. With this neuron, we were able to test the hypothesis that the CD is that delay which just offsets the relative neural delay in the excitatory and inhibitory inputs to the LSO from the two ears. To do this, we measured the noise-delay function constructed by plotting the mean discharge rate of the neuron as a function of the ITD between identical broadband noise bursts of equal amplitude presented to the two ears (Fig. 6E). Based on the CP and CD of this neuron, we hypothesize that the response as a function of ITD should exhibit a minimum, or trough, at an ITD that just offsets the CD, that is, ∼235 μs (indicated by an arrow). Accordingly, there is a rate minimum at 200 μs, the nearest ITD tested.
Figure 6.
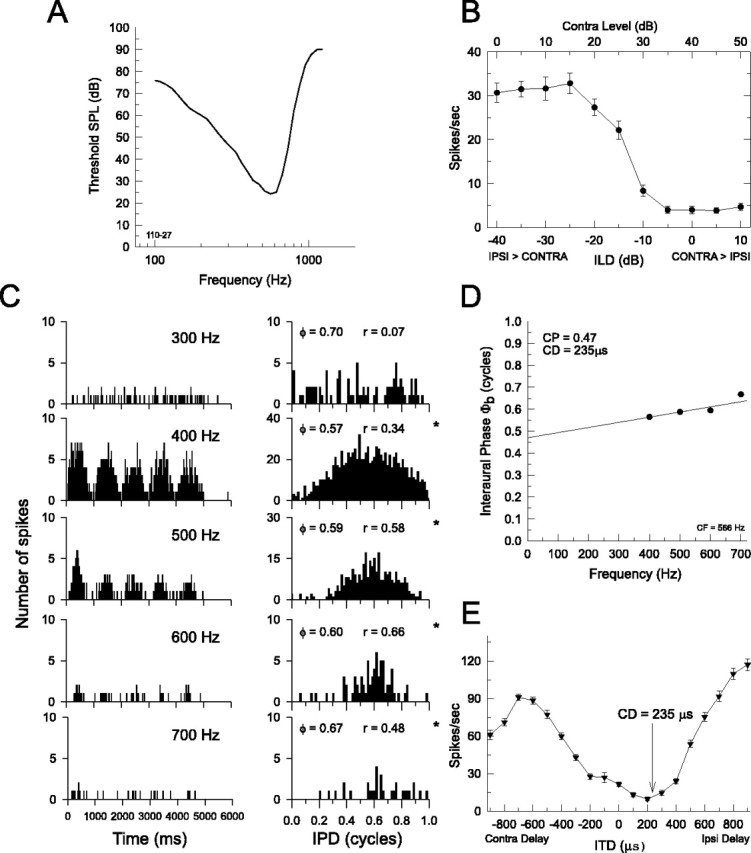
Example of a low-characteristic-frequency LSO neuron that is sensitive to ILDs and IPDs. A, Frequency-threshold curve (characteristic frequency, 566 Hz). B-D, The same as in Figure 5. ϕ, Mean interaural phase;ϕb, mean interaural phase from binaural-beat stimuli; *p < 0.001. E, Noise-delay function created by plotting the mean discharge rate as a function of the ITD of a broadband noise presented to the two ears with equal amplitude. Negative delays indicate that the contralateral stimulus lags the ipsilateral stimulus. Consistent with the CD (235 μs) and the CP (0.47 cycles) obtained from the binaural-beat stimulus for this neuron (C, D), the response minimum in the noise-delay function occurs at an ipsilateral delay of 200 μs, which is near the delay of 235 μs predicted from the CD. At the CD, the ipsilateral excitation and the contralateral inhibition arrive coincidentally at the LSO neuron, resulting in maximal inhibition. Error bars in B and E represent ±1 SEM. SPL, Sound pressure level; IPSI or Ipsi, ipsilateral; CONTRA or Contra, contralateral.
Figure 7 shows yet another example (the histological location of this neuron is shown by the arrow in Fig. 1). This neuron had a characteristic frequency of 1345 Hz (Fig. 7A) and was determined audiovisually to be ILD sensitive, as expected of LSO cells. The neuron was also clearly IPD sensitive yielding a CD of -299 μsandaCPof 0.66 cycles (Fig. 7B,C). A CD <0 indicates that the excitatory input from the ipsilateral ear lags the inhibitory input from the contralateral ear. Figure 7D shows the noise-delay function for this neuron, which has a clear response minimum at a delay of 0 μs, along with the predicted location of the response minimum at -299 μs.
Figure 8 shows a summary of the IPD and ILD sensitivity of low-characteristic frequency LSO neurons. To the extent to which the inputs to these neurons were phase locked (Fig. 4), we expected these neurons to be IPD sensitive. All neurons tested (10 of 10) with binaural beats were modulated with changes in IPD for at least one carrier frequency. Two additional neurons were not tested with binaural beats, but their responses were systematically modulated by ITDs in characteristic frequency tones. Figure 8A shows the phase-frequency plots for the eight neurons that were tested most extensively with binaural beats. Note that for two neurons, 110-47 and 023-14, the phase-frequency functions are based on only two points. Each point, however, produced significant phase locking to the binaural beats. All neurons yielded CPs that were nearer to 0.5 cycles (mean CP, 0.52 cycles; SD, 0.12 cycles; n = 8) than they were to 0.0 or 1.0 cycles, and CDs that ranged from -299 to 1065 μs (mean CD, 186 μs; SD, 451 μs; n = 8). Eleven of 13 neurons exhibited IE binaural interaction as evidenced by their ILD sensitivity; three were documented audiovisually, and the eight neurons tested with ILD functions showed the characteristic sigmoidally shaped rate-ILD functions illustrated in Figure 8B. Of the 11 units that were tested for both ILD sensitivity and IPD sensitivity, nine were sensitive to both in a manner consistent with IE binaural interaction, and two responded to IPDs consistent with IE interactions but were not modulated by ILDs over the range tested. Of the seven units that were tested with both binaural beats and tested for sensitivity to ITDs in noise, five were modulated by both noise delays and IPDs consistent with IE interaction, and two were modulated by IPDs consistent with IE interaction but not modulated by noise delays. Although the noise-delay functions based on discharge rate for these latter two units did not change systematically with ITD, close examination of the dot rasters of the responses (data not shown) indicated that there was some form of binaural interaction, as evidenced by the systematic appearance and disappearance of responses as a function of ITD. Such responses would not be expected for a monaural unit. Finally, one neuron was monaural, with no ILD or IPD sensitivity, and could only be stimulated ipsilaterally.
Figure 8.

Phase-frequency (A) and ILD (B) functions for the population of low-characteristic-frequency LSO neurons. In support of the hypothesis that low-characteristic-frequency LSO neurons can be sensitive to IPDs and ILDs in manner consistent with IE binaural interaction, the phase-frequency functions of these neurons yield CPs near 0.5 cycles (A), and all neurons tested were sensitive to ILD (B). ϕb, Mean interaural phase from binaural-beat stimuli. Error bars represent ±1 SEM. Ipsi, Ipsilateral; Contra, contralateral.
Discussion
Previous evidence for low-frequency IPD and ILD sensitivity in LSO neurons
Reports of low-frequency LSO neurons with IPD sensitivity are sparse (Caird and Klinke, 1983; Finlayson and Caspary, 1991; Joris and Yin, 1995; Batra et al., 1997). In the most comprehensive study, Finlayson and Caspary (1991) recorded from 96 LSO neurons with characteristic frequencies <1.2 kHz in chinchilla. These neurons were sensitive to ILDs, and their responses could be modulated by IPDs. However, 31 of 61 neurons tested with both in-phase and out-of-phase stimuli showed maximum inhibition to stimuli 180° out-of-phase, rather than in-phase as would be predicted from IE binaural interaction. Thirty-two additional cells in their study that were only tested with in-phase stimuli had strong inhibition to in-phase tones consistent with our data.
Batra et al. (1997) were surprised not to find any low-frequency neurons with IE interaction in the brainstem of the awake rabbit. It is not clear whether they tested for ILD sensitivity by stimulating the ipsilateral ear and looking for inhibitory input from stimulation of the contralateral ear, as we have done. Low-frequency LSO neurons showing ILD sensitivity have been reported occasionally (Caird and Klinke, 1983; Finlayson and Caspary, 1991; Joris and Yin, 1995; Spitzer and Semple, 1995). In general, these studies examined either IPD or ILD sensitivity but rarely both. All of these reports, in addition to our data, differ from the classical descriptions of the low-frequency region of the LSO where neurons were reported to be predominantly monaural (Boudreau and Tsuchitani, 1968; Guinan et al., 1972a,b; Tsuchitani, 1977). Only 1 of 16 neurons in our sample was monaural.
The average CD of our LSO neurons was +186 μs and is in agreement with delay measurements made in high-frequency LSO neurons. The high-frequency data were obtained using amplitude-modulated stimuli, because high-frequency neurons phase lock to the low-frequency envelope of amplitude-modulated stimuli with high-frequency carriers but not to pure tones. For 15 high-frequency LSO neurons, the delay was calculated from the response to monaural amplitude modulated stimuli from the slope of the phase-frequency plot. The difference in the slopes for ipsilateral and contralateral stimulation averaged +182 μs with the contralateral response delayed (Joris and Yin, 1998). For binaural stimulation of high-frequency LSO neurons with amplitude-modulated tones, Joris (1996) found that the mean CD was 200 μs. These three studies show that although the contralateral inhibitory input to LSO has a longer overall path length through the brainstem and an additional synapse in the MNTB, the inhibition lags the ipsilateral excitation by only ∼190 μs in both the high- and low-frequency limbs of the LSO. This remarkable finding is likely caused by the fast synapse through the calyx of Held from the contralateral globular bushy cells to the MNTB (Joris and Yin, 1998) and the large caliber axons of the globular bushy cells (Spangler et al., 1985). In fact, three of eight of our neurons and 7 of 21 of the high-frequency LSO cells in the study by Joris (1996) had CDs <0, indicating that the contralateral inhibition led the ipsilateral excitation.
The reports by Boudreau and Tsuchitani (1968) and Guinan et al. (1972a,b) of predominantly monaural responses in low-frequency LSO neurons were followed by anatomical studies that tended to support those findings. The projections from MNTB to the lateral limb of the LSO were less dense (Glendenning et al., 1985, 1991; Spangler et al., 1985; Sanes et al., 1987; Saint Marie et al., 1989), and the gradient of glycine receptors was less dense in the lateral than the more medial limbs (Sanes and Wooten, 1987).
On the other hand, there was also substantial physiological (discussed previously) and anatomical evidence predicting the existence of IPD- and ILD-sensitive LSO neurons in the lateral limb. First, these neurons receive excitatory input from low-frequency neurons in the ipsilateral cochlear nucleus and frequency-matched inhibitory input from the ipsilateral MNTB, which receives excitatory input from low-frequency neurons in the contralateral cochlear nucleus (Glendenning et al., 1985; Smith et al., 1993, 1998). Second, low-frequency cochlear nucleus neurons (Lavine, 1971; Bourk, 1976; Palmer et al., 1986; Blackburn and Sachs, 1989; Joris et al., 1994) exhibit highly phase-locked responses to low-frequency tones. We demonstrated here that this enhanced phase locking is preserved at the LSO when stimulated ipsilaterally (Figs. 3, 4). Moreover, we demonstrated enhanced phase locking to low-frequency tones in MNTB neurons (Figs. 2, 4), confirming previous reports from a few cells [cat (Smith et al., 1998) and gerbil (Kopp-Scheinpflug et al., 2003)]. Finally, the existence of low-frequency IPD-sensitive LSO neurons has been predicted from studies of low-frequency IPD-sensitive neurons in the inferior colliculus. Inferior colliculus neurons with CPs near 0.5 have been reported in the cat, rabbit, and guinea pig. However, the proportion of neurons exhibiting CPs in the range consistent with IE binaural interaction (∼0.25-0.75 cycles) was relatively small with only ∼20 and ∼25% in cat [for characteristic frequencies <1 kHz (Yin and Kuwada, 1983)] and rabbit (Kuwada et al., 1987) inferior colliculus, respectively, the rest being distributed around 0.0 cycles, consistent with EE interaction. Only ∼10% of 520 low-frequency inferior colliculus neurons in the guinea pig (McAlpine et al., 2001) had noise-delay functions (Fig. 6E) that exhibited a trough, as would be expected from IE interaction. The predominance of EE IPD sensitivity in low-frequency inferior colliculus neurons is consistent with the under-representation and over-representation of low-frequency neurons in LSO and medial superior olive, respectively (Guinan et al., 1972b). Some inferior colliculus neurons exhibit nonlinear phase-frequency functions when studied with binaural beats (Stanford et al., 1992; McAlpine et al., 1998). The shapes of these functions could be explained by converging inputs from medial superior olive-like neurons and LSO-like neurons (Shackleton et al., 2000) that exhibited IPD sensitivity like that demonstrated here.
Functional considerations
According to the duplex theory, localization of high-frequency sounds is based on ILDs. What is the function, then, of low-frequency LSO neurons that are sensitive to ILDs and IPDs? First, acoustic measurements of ILD cues in cats reveal moderately sized ILDs of ±5-10 dB, even for frequencies <2.0 kHz (Wiener et al., 1966; Tollin, 2004). The LSO neurons in our sample could encode these ILDs (Fig. 8B). It is unknown whether cats use low-frequency ILDs for localization. The IE mechanisms of low-frequency LSO neurons could allow for other binaural computations. For example, the classical model of binaural hearing based on ITDs is the Jeffress coincidence detection model (Jeffress, 1948). The anatomical correlate of the Jeffress model is usually based on EE binaural interaction occurring at the medial superior olive (Yin and Chan, 1990). However, inhibitory mechanisms may shape the ITD selectivity of medial superior olive neurons (Brand et al., 2002; Grothe, 2003). Anatomical evidence suggests that inhibitory input to medial superior olive derives in part from the MNTB (Kuwabara and Zook, 1991, 1992; Banks and Smith, 1992; Smith, 1995; Smith et al., 1998). The enhanced phase locking by MNTB neurons to low-frequency stimuli may play an important role in the encoding of ITD by medial superior olive neurons.
Our data suggest that it might also be possible that excitatory inputs to LSO from the contralateral cochlear nucleus (Glendenning et al., 1985) shaped the IPD selectivity observed here. For example, although pure IE-type IPD sensitivity would produce CPs of exactly 0.5 cycles and linear phase-frequency plots, our data exhibited a range of CPs around 0.5 (Fig. 8A), and some neurons (Fig. 8A, 232-15) exhibited nonlinear phase-frequency plots. Such alterations in CP and phase-frequency linearity are consistent with the model by Batra et al. (1997), which is based on the anatomical observations that some LSO neurons can also receive excitatory inputs from the contralateral ear. Finally, low-frequency neurons in the lateral limb of LSO project predominantly to the ipsilateral inferior colliculus and often stain positively for the inhibitory neurotransmitter glycine (Saint Marie et al., 1989; Glendenning et al., 1992). These inhibitory inputs converge in inferior colliculus with the excitatory projections from the ipsilateral medial superior olive neurons (Loftus et al., 2004). It is conceivable that EE and IE ITD processing by the medial superior olive and LSO, respectively, could interact at the inferior colliculus to produce neurons with novel ITD sensitivities with a larger range of CPs and CDs than the medial superior olive and LSO produce independently (previous section).
In contrast to the Jeffress model, many models of low-frequency binaural psychophysical phenomena require IE binaural mechanisms rather than EE. These models assume neurons that respond to ITDs and/or ILDs like the LSO neurons demonstrated here. For example, models of the binaural-masking-level difference assume a subtractive process, including the equalization-cancellation model (Durlach, 1963; Green, 1966; Breebaart et al., 2001). Models of binaural speech segregation (Culling and Summerfield, 1995) and the illusory binaural pitches (Huggin's, binaural edge, and Fourcin) require subtractive mechanisms (Fourcin, 1970; Culling et al., 1998a,b; Akeroyd and Summerfield, 2000). Models incorporating subtraction from the two ears have been able to account for phenomena not easily explained by Jeffress-like EE interaction (de Cheveigne, 1993; Hartmann and Zhang, 2003). These models require fast inhibitory interaction of temporally structured or phase-locked inputs. This is precisely the type of interaction that we found here in low-frequency LSO and MNTB.
Footnotes
This work was supported by National Institute on Deafness and Other Communication Disorders Grants DC-00116 and DC-02840 to T.C.T.Y. and DC-005122 and DC-006865 to D.J.T. Special thanks to Dr. Philip Joris for data. We acknowledge the assistance of J. Sekulski and R. Kochhar for help with computer programming and Dr. Nathan Schoppa for comments on this manuscript.
Correspondence should be addressed to Dr. Daniel J. Tollin, Department of Physiology and Biophysics, University of Colorado Health Sciences Center, Mail Stop 8307, P.O. Box 6511, Aurora, CO 80045. E-mail: Daniel.tollin@uchsc.edu.
Copyright © 2005 Society for Neuroscience 0270-6474/05/2510648-10$15.00/0
References
- Akeroyd MA, Summerfield AQ (2000) A fully temporal account of the perception of dichotic pitches. Br J Audiol 33: 106-107. [Google Scholar]
- Banks MI, Smith PH (1992) Intracellular recordings from neurobiotin-labeled cells in brain slices of the rat medial nucleus of the trapezoid body. J Neurosci 12: 2819-2837. [DOI] [PMC free article] [PubMed] [Google Scholar]
- Batra R, Kuwada S, Fitzpatrick DC (1997) Sensitivity to interaural temporal disparities of low- and high-frequency neurons in the superior olivary complex. I. Heterogeneity of responses. J Neurophysiol 78: 1222-1236. [DOI] [PubMed] [Google Scholar]
- Blackburn CC, Sachs MB (1989) Classification of unit types in the anteroventral cochlear nucleus: PST histograms and regularity analysis. J Neurophysiol 62: 1303-1329. [DOI] [PubMed] [Google Scholar]
- Boudreau JC, Tsuchitani C (1968) Binaural interaction in the cat superior olive S segment. J Neurophysiol 31: 442-454. [DOI] [PubMed] [Google Scholar]
- Bourk TR (1976) Electrical responses of neural units in the anteroventral cochlear nucleus of the cat. PhD thesis, Massachusetts Institute of Technology.
- Brand A, Behrend O, Marquardt T, McAlpine D, Grothe B (2002) Precise inhibition is essential for microsecond interaural time difference coding. Nature 417: 543-547. [DOI] [PubMed] [Google Scholar]
- Breebaart J, van de Par S, Kohlrausch A (2001) Binaural processing model based on contralateral inhibition. I. Model structure. J Acoust Soc Am 110: 1074-1088. [DOI] [PubMed] [Google Scholar]
- Caird D, Klinke R (1983) Processing of binaural stimuli by cat superior olivary complex neurons. Exp Brain Res 52: 385-399. [DOI] [PubMed] [Google Scholar]
- Culling JF, Summerfield Q (1995) Perceptual separation of concurrent speech sounds: absence of across-frequency grouping by common interaural delay. J Acoust Soc Am 98: 785-797. [DOI] [PubMed] [Google Scholar]
- Culling JF, Summerfield AQ, Marshall DH (1998a) Dichotic pitches as illusions of binaural unmasking. I. Huggins' pitch and the “binaural edge pitch.” J Acoust Soc Am 103: 3509-3526. [DOI] [PubMed] [Google Scholar]
- Culling JF, Marshall DH, Summerfield AQ (1998b) Dichotic pitches as illusions of binaural unmasking. II. The Fourcin pitch and the dichotic repetition pitch. J Acoust Soc Am 103: 3527-3539. [DOI] [PubMed] [Google Scholar]
- de Cheveigne A (1993) Separation of concurrent harmonic sounds: fundamental frequency estimation and a time-domain cancellation model of auditory processing. J Acoust Soc Am 93: 3271-3290. [Google Scholar]
- Durlach NI (1963) Equalization and cancellation theory of binaural masking-level differences. J Acoust Soc Am 35: 1206-1218. [Google Scholar]
- Finlayson PG, Caspary DM (1991) Low-frequency neurons in the lateral superior olive exhibit phase-sensitive binaural inhibition. J Neurophysiol 65: 598-605. [DOI] [PubMed] [Google Scholar]
- Fourcin AJ (1970) Central pitch and auditory localization. In: Frequency analysis and periodicity detection in hearing (Plomp R, Smoorenburg GF, eds), pp 319-328. Leiden, Germany: Sijthoff.
- Glendenning KK, Hutson KA, Nudo RJ, Masterton RB (1985) Acoustic chiasm II: anatomical basis of binaurality in lateral superior olive of cat. J Comp Neurol 232: 261-285. [DOI] [PubMed] [Google Scholar]
- Glendenning KK, Masterton RB, Baker BN, Wenthold RJ (1991) Acoustic chiasm. III: nature, distribution, and sources of afferents to the lateral superior olive in the cat. J Comp Neurol 310: 377-400. [DOI] [PubMed] [Google Scholar]
- Glendenning KK, Baker BN, Hutson KA, Masterton RB (1992) Acoustic chiasm V: inhibition and excitation in the ipsilateral and contralateral projections of LSO. J Comp Neurol 319: 100-122. [DOI] [PubMed] [Google Scholar]
- Goldberg JM, Brown PB (1969) Response of binaural neurons of dog superior olivary complex to dichotic tonal stimuli: some physiological mechanisms of sound localization. J Neurophysiol 32: 613-636. [DOI] [PubMed] [Google Scholar]
- Green DM (1966) Signal detection analysis of EC model. J Acoust Soc Am 40: 833-838. [Google Scholar]
- Grothe B (2003) New roles for synaptic inhibition in sound localization. Nat Rev Neurosci 4: 540-550. [DOI] [PubMed] [Google Scholar]
- Guinan Jr JJ, Li RYS (1990) Signal processing in brainstem auditory neurons which receive giant endings (calyces of Held) in the medial nucleus of the trapezoid body. Hear Res 49: 321-334. [DOI] [PubMed] [Google Scholar]
- Guinan Jr JJ, Guinan SS, Norris BE (1972a) Single auditory units in the superior olivary complex. I: responses to sounds and classifications based on physiological properties. Int J Neurosci 4: 101-120. [Google Scholar]
- Guinan Jr JJ, Norris BE, Guinan SS (1972b) Single auditory units in the superior olivary complex. II: location of unit categories and tonotopic organization. Int J Neurosci 4: 147-166. [Google Scholar]
- Hartmann WM, Zhang PX (2003) Binaural models and the strength of dichotic pitches. J Acoust Soc Am 114: 3317-3326. [DOI] [PubMed] [Google Scholar]
- Jeffress LA (1948) A place theory of sound localization. J Comp Physiol Psychol 41: 35-39. [DOI] [PubMed] [Google Scholar]
- Johnson DH (1980) The relationship between spike rate and synchrony in responses of auditory-nerve fibers to single tones. J Acoust Soc Am 68: 1115-1122. [DOI] [PubMed] [Google Scholar]
- Joris PX (1996) Envelope coding in the lateral superior olive. II. Characteristic delays and comparison with responses in the medial superior olive. J Neurophysiol 76: 2137-2156. [DOI] [PubMed] [Google Scholar]
- Joris PX, Yin TCT (1995) Envelope coding in the lateral superior olive. I. Sensitivity to interaural time differences. J Neurophysiol 73: 1043-1062. [DOI] [PubMed] [Google Scholar]
- Joris PX, Yin TCT (1998) Envelope coding in the lateral superior olive. III. Comparison with afferent pathways. J Neurophysiol 79: 253-269. [DOI] [PubMed] [Google Scholar]
- Joris PX, Carney LH, Smith PH, Yin TCT (1994) Enhancement of neural synchronization in the anteroventral cochlear nucleus. I. Responses to tones at the characteristic frequency. J Neurophysiol 71: 1022-1036. [DOI] [PubMed] [Google Scholar]
- Kiang NYS, Moxon EC, Levine RA (1970) Auditory-nerve activity in cats with normal and abnormal cochleas. In: Sensorineural hearing loss (Wolstenholme GEW, Knight J, eds), pp 241-273. London: Churchill. [DOI] [PubMed]
- Kopp-Scheinpflug C, Lippe WR, Dorrscheidt GJ, Rubsamen R (2003) The medial nucleus of the trapezoid body in the gerbil is more than a relay: comparison of pre- and postsynaptic activity. J Assoc Res Otolaryngol 4: 1-23. [DOI] [PMC free article] [PubMed] [Google Scholar]
- Kuwabara N, Zook JM (1991) Classification of the principal cells of the medial nucleus of the trapezoid body. J Comp Neurol 314: 707-720. [DOI] [PubMed] [Google Scholar]
- Kuwabara N, Zook JM (1992) Projections to the medial superior olive from the medial and lateral nuclei of the trapezoid body in rodents and bats. J Comp Neurol 324: 522-538. [DOI] [PubMed] [Google Scholar]
- Kuwada S, Yin TC, Wickesberg RE (1979) Response of cat inferior colliculus neurons to binaural beat stimuli: possible mechanisms for sound localization. Science 206: 586-588. [DOI] [PubMed] [Google Scholar]
- Kuwada S, Stanford TR, Batra B (1987) Interaural phase-sensitive units in the inferior colliculus of the unanesthetized rabbit: effects of changing frequency. J Neurophysiol 57: 1338-1360. [DOI] [PubMed] [Google Scholar]
- Lavine RA (1971) Phase-locking in response of single neurons in cochlear nuclear complex of the cat to low-frequency tonal stimuli. J Neurophysiol 34: 467-483. [DOI] [PubMed] [Google Scholar]
- Loftus WC, Bishop DC, Saint Marie RL, Oliver DL (2004) Organization of binaural excitatory and inhibitory inputs to the inferior colliculus from the superior olive. J Comp Neurol 472: 330-344. [DOI] [PubMed] [Google Scholar]
- Mardia KV (1972) Statistics of directional data. London: Academic.
- McAlpine D, Jiang D, Shackleton TM, Palmer AR (1998) Convergent input from brainstem coincidence detectors onto delay-sensitive neurons in the inferior colliculus. J Neurosci 18: 6026-6039. [DOI] [PMC free article] [PubMed] [Google Scholar]
- McAlpine D, Jiang D, Palmer AR (2001) A neural code for low-frequency sound localization in mammals. Nat Neurosci 4: 396-401. [DOI] [PubMed] [Google Scholar]
- Mills W (1958) On the minimum audible angle. J Acoust Soc Am 30: 237-246. [Google Scholar]
- Palmer AR, Winter IM, Darwin CJ (1986) The representation of steadystate vowel sounds in the temporal discharge patterns of the guinea pig cochlear nerve and primarylike cochlear nucleus neurons. J Acoust Soc Am 79: 100-113. [DOI] [PubMed] [Google Scholar]
- Rayleigh L (1907) On our perception of sound direction. Philos Mag (6 ser.) 13: 214-232. [Google Scholar]
- Rhode WS (1976) A digital system for auditory neurophysiological research. In: Current computer technology in neurobiology (Brown P, ed), pp 543-567. Washington, DC: Hemisphere.
- Saint Marie RL, Ostapoff EM, Morest DK, Wenthold RJ (1989) Glycine-immunoreactive projection of the cat lateral superior olive: possible role in midbrain ear dominance. J Comp Neurol 279: 382-396. [DOI] [PubMed] [Google Scholar]
- Sanes DH, Wooten GF (1987) Development of glycine receptor distribution in the lateral superior olive of the gerbil. J Neurosci 7: 3803-3811. [DOI] [PMC free article] [PubMed] [Google Scholar]
- Shackleton TM, McAlpine D, Palmer AR (2000) Modelling convergent input onto interaural-delay-sensitive inferior colliculus neurones. Hear Res 149: 199-215. [DOI] [PubMed] [Google Scholar]
- Smith PH (1995) Structural and functional differences distinguish principal from nonprincipal cells in the guinea pig MSO slice. J Neurophysiol 73: 1653-1667. [DOI] [PubMed] [Google Scholar]
- Smith PH, Joris PX, Yin TCT (1993) Projections of physiologically characterized spherical bushy cell axons from the cochlear nucleus of the cat: evidence for delay lines to the medial superior olive. J Comp Neurol 331: 245-260. [DOI] [PubMed] [Google Scholar]
- Smith PH, Joris PX, Yin TCT (1998) Anatomy and physiology of principal cells of the medial nucleus of the trapezoid body (MNTB) of the cat. J Neurophysiol 79: 3127-3142. [DOI] [PubMed] [Google Scholar]
- Spangler KM, Warr WB, Henkel CK (1985) The projections of principal cells of the medial nucleus of the trapezoid body in the cat. J Comp Neurol 238: 249-262. [DOI] [PubMed] [Google Scholar]
- Spitzer MW, Semple MN (1995) Neurons sensitive to interaural phase disparity in gerbil superior olive: diverse monaural and temporal response properties. J Neurophysiol 73: 1668-1690. [DOI] [PubMed] [Google Scholar]
- Stanford TR, Kuwada S, Batra R (1992) A comparison of the interaural time sensitivity of neurons in the inferior colliculus and thalamus of the unanesthetized rabbit. J Neurosci 12: 3200-3216. [DOI] [PMC free article] [PubMed] [Google Scholar]
- Stevens SS, Newman EB (1936) The localization of actual sources of sound. Am J Psychol 48: 297-306. [Google Scholar]
- Tollin DJ (2003) The lateral superior olive: a functional role in sound source localization. Neuroscientist 9: 127-143. [DOI] [PubMed] [Google Scholar]
- Tollin DJ (2004) The development of the acoustical cues to sound location in cats. Assoc Res Otol Abstr 27: 161. [Google Scholar]
- Tsuchitani C (1977) Functional organization of lateral cell groups of cat superior olivary complex. J Neurophysiol 40: 296-318. [DOI] [PubMed] [Google Scholar]
- Wiener FM, Pfeiffer RR, Backus ASN (1966) On the sound pressure transformation by the head and auditory meatus of the cat. Acta Otolaryngol 61: 255-269. [DOI] [PubMed] [Google Scholar]
- Yin TCT (2002) Neural mechanisms of encoding localization cues in the auditory brainstem. In: Integrative functions in the mammalian auditory pathway, (Oertel D, Fay RR, Popper AN, eds), pp 99-159. New York: Springer.
- Yin TCT, Chan JC (1990) Interaural time sensitivity in medial superior olive of cat. J Neurophysiol 64: 465-488. [DOI] [PubMed] [Google Scholar]
- Yin TCT, Kuwada S (1983) Binaural interaction in inferior colliculus of the cat. III. Effects of changing frequency. J Neurophysiol 50: 1020-1042. [DOI] [PubMed] [Google Scholar]