

Abstract
The chromosomes of the macronuclear (expressed) genome of Tetrahymena thermophila are generated by developmental fragmentation of the five micronuclear (germline) chromosomes. This fragmentation is site specific, directed by a conserved chromosome breakage sequence (Cbs element). An accompanying article in this issue reports the development of a successful scheme for the genome-wide cloning and identification of functional chromosome breakage sites. This article reports the physical and genetic characterization of 30 functional chromosome breakage junctions. Unique sequence tags and physical sizes were obtained for the pair of macronuclear chromosomes generated by fragmentation at each Cbs. Cbs-associated polymorphisms were used to genetically map 11 junctions to micronuclear linkage groups and macronuclear coassortment groups. Two pairs of junctions showed statistically significant similarity of the sequences flanking the Cbs, suggestive of relatively recent duplications of entire Cbs junctions during Tetrahymena genome evolution. Two macronuclear chromosomes that lose at least one end in an age-related manner were also identified. The whole-genome shotgun sequencing of the Tetrahymena macronucleus has recently been completed at The Institute for Genome Research (TIGR). By providing unique sequence from natural ends of macronuclear chromosomes, Cbs junctions will provide useful sequence tags for relating macro- and micronuclear genetic, physical, and whole-genome sequence maps.
THE ∼300 chromosomes of the macronuclear (expressed) genome of Tetrahymena thermophila are generated by developmental fragmentation of the five micronuclear (germline) chromosomes. This fragmentation is site specific, directed by a conserved 15-bp sequence (TAAACCAACCTCTTT), the chromosome breakage sequence (Cbs element) (Yao et al. 1987). The Cbs element itself and 6–34 bp on either side are lost during fragmentation. Telomeres are added de novo to the macronucleus (MAC) chromosome ends generated by fragmentation. The sequences that flanked the Cbs become the telomere-adjacent regions in each pair of MAC chromosomes (see the accompanying article by Hamilton et al. 2005, this issue, for additional details).
Genetic maps of T. thermophila, based on randomly amplified DNA polymorphisms and other genetic differences between inbred strains B and C3, are available (Brickner et al. 1996; Wickert and Orias 2000; http://www.lifesci.ucsb.edu/~genome/Tetrahymena/). The micronucleus (MIC) genome has been genetically mapped by classical approaches exploiting the frequency of meiotic recombination as an indicator of marker distance. In addition, DNA or other genetic polymorphisms in Tetrahymena can be independently assigned to MAC coassortment groups. This mapping is based on the cosegregation of markers on the same MAC chromosome in the face of random distribution of MAC chromosome copies at MAC division (Longcor et al. 1996; Wickert et al. 2000). Detection of coassortment is greatly facilitated by the rarity of MAC crossing over. Since genetic coassortment groups physically correspond to MAC chromosomes (Wong et al. 2000), any genetic polymorphism identified with a phenotypic difference can, in effect, be physically mapped to a MAC chromosome by segregation genetics.
The Tetrahymena genome sequence is considered to be valuable for fundamental and biomedical research for several reasons: Tetrahymena's history of major discoveries in molecular and cell biology, its important phylogenetic position among eukaryotes, the complexity of its eukaryotic biology, the high degree of functional conservation with the human genome, the experimental tractability of the organism, and the availability of powerful genetic and molecular technology for the sequence-enabled investigation of in vivo gene function (Turkewitz et al. 2002; http://www.nigms.nih.gov/news/releases/tetrahymena.html).
The whole-genome shotgun (WGS) sequencing and auto-assembly of the T. thermophila macronucleus has recently been completed at The Institute for Genome Research (TIGR). The WGS sequence has a depth of coverage of ninefold sequence redundancy. Scaffold assemblies and gene predictions are publicly available without restriction at http://www.tigr.org/tdb/e2k1/ttg/. Eventual closure of the WGS sequence should ideally lead to ∼300 independent sequence assemblies, one for each MAC chromosome. The ultimate objective of the work reported here is to assemble a scaffold of the MIC genome by concatenating complete MAC chromosomes using the sequence of consecutive Cbs junctions. The rationale is that each chromosome breakage junction provides sequence tags for two MAC chromosomes whose progenitor sequences are adjacent on the MIC chromosome. In the accompanying article by Hamilton et al. (2005)(this issue), it was demonstrated that functional chromosome breakage sites can be efficiently cloned, identified, and deletion mapped to chromosome arms. The existence of DNA polymorphisms associated with DNA segments flanking the Cbs element (chromosome-breakage-site-associated polymorphisms, or CBSPs) was also reported.
The objective of the work described in this article was (a) to characterize the sequence flanking each Cbs element to obtain sequence tags for every MAC chromosome end, (b) to determine the physical size of the two MAC chromosomes (c) to genetically map CBSPs to be able ultimately to relate the genetic, physical, and sequence maps of the Tetrahymena genome. A total of 23 new and 7 previously described Cbs junctions were characterized with respect to flanking sequence and physical size of flanking MAC chromosomes. The sequence uniqueness of each junction was confirmed. About a third of the Cbs junctions were genetically mapped to linkage and coassortment groups. Evidence for two novel phenomena is also reported: duplication of entire Cbs junctions during genome evolution and MAC chromosomes that lose at least one end in an age-related manner.
MATERIALS AND METHODS
Strains:
For genetic mapping, panels of meiotic segregants derived from a B/C3 heterozygote (Lynch et al. 1995; Wickert and Orias 2000; C. Van Slyke, E. Hamilton and E. Orias, unpublished observations) and a panel of terminal assortants of 36 B/C3 heterozygotes (Longcor et al. 1996) were used. Panel details are shown in supplementary Tables S1 and S2 at http://www.genetics.org/supplemental/. As positive and negative controls, DNA obtained from young mass cultures of homozygous B and C3 strains was used (see Hamilton et al. 2005, this issue). For experiments to characterize junctions 3L-4 and 4L-3, inbred strain B nullisomic strains (estimated to be older than 100 fissions; see Hamilton et al. 2005, this issue) were also used.
Cbs-related nomenclature:
Every functional Cbs has a name, of the form Cbs XY-Z, where X represents the MIC chromosome number, Y is the chromosome arm (L or R for left or right), and Z is a serial isolation number. Convergent specific primers used to PCR amplify a Cbs junction are named with the Cbs insert name followed by a G or C, depending on whether the primer is downstream from the 3′-end of the G-rich or the C-rich strand of the Cbs element, respectively. The “G” specific primer was used with the Tel primer to amplify MAC chromosome DNA on the “G” side of the junction, while the “C” specific primer was used with the Tel primer to amplify MAC chromosome DNA on the “C” side of the junction (see Figure 1 in Hamilton et al. 2005, this issue). An analogous convention (Cbs name followed by G or C) is used to refer to certain coassortment groups and to MAC chromosomes with known orientation with respect to the Cbs element.
Specific primers and PCR conditions for coassortment tests:
Convergent specific primers, SP-G and SP-C, were described in Table 2 of the accompanying article by Hamilton et al. (2005)(this issue). Additional specific primers, conditions, and band sizes are described in Tables 1 and 2. To map some of the CBSPs by coassortment, the Tel-primed PCR product was digested with an appropriate restriction enzyme before electrophoresis to separate the genetic polymorphism from the developmental heterogeneity of the telomere addition site, described in Hamilton et al. (2005)(this issue).
TABLE 1.
Additional primers used in coassortment tests
| Primer | Sequence | Direction | Location |
|---|---|---|---|
| Tt826G + 35 (Cbs 1R-1) | ATAGTATTTTTTGTAATTATTTA | Away | 35 |
| Cbs 1R-2 ISP-C | TCCAAAATTACTTAAACTTGTAAGAG | Toward | 377 |
| Cbs 1L-6 CVP | TTTAATTAGGTTATTGAATTATAAA | Away | 42 |
| Cbs 3L-1 CVP | TTTTTATTTATTTTTTCTAACATTTT | Away | 21 |
| Cbs 5-3 OSP-G | AGAAAAATAAGTTACTAATC | Toward | 396 |
“Sequence” is 5′–3′. “Direction” is in the 5′–3′ direction, away from or toward the Cbs element. “Location” is the distance in nucleotides between the 5′-end of the primer and the nearest edge of the Cbs element. Other primers are described in Table 2 of the accompanying article by Hamilton et al. (2005)(this issue).
TABLE 2.
Genetic mapping of CBSPs
| Cbs name | Linkage group (MIC) |
Coassortment group (MAC) |
Primers | Temperature | Band size |
|---|---|---|---|---|---|
| 1L-5 | 1L-mat | 1L-JB10R | SP-T, Tel | 50° | 0.35 – |
| 1L-6 | 1L-mat | 1L-RK5tR | SP-T, 1L-6 CVP | 50° | 0.2 < |
| 1R-1 | 1R-GAL1 | Cbs1R-1A | SP-A, Tt826A+35 | 45° | 0.24 > |
| 1R-2 | 1R-CHX1 | 1R-JO14 | 1R-2 ISP-T, Tel* | 55° | 0.4 < |
| 1R-4 | 1R-GAL1 | 1R-SP18R | SP-A, Tel | 55° | 0.65 < |
| 1R-5 | 1R-GAL1 | Cbs1R-5A | SP-A, Tel | 55° | 0.27 – |
| 3L-1 | 3L-FBR1 | Cbs 3L-1 | SP-A, 3L-1 CVP | 50° | 0.5 > |
| 3L-4 | 3L-FBR1 | Cbs3L-4A | SP-A, Tel | 47° | 0.37 – |
| 4L-3 | 4L-AS01 | NA | |||
| 5-1 | 5-JB04 | NA | |||
| 5-3 | 5-JP02 | Cbs5-3A | 5-3 OSP-A, Tel* | 45° | 0.4 > |
“Primers” are specific primers; see materials and methods. NA, not applicable because the polymorphic DNA is absent from the MAC genome of terminal assortants, either because the macronuclear chromosome end is incapable of long-term maintenance (Cbs 4L-3; see discussion) or because the CBSP is a short, presumably MIC-limited duplication of the Cbs element (Cbs 5-1; see Hamilton et al. 2005, this issue). “Temperature” is the PCR reannealing temperature. For “Band size,” B PCR product size (in kilobases) is shown; “>,” “<,” and “−” indicate that the polymorphic C3 band is larger, smaller, or missing, respectively, compared to B.
a Prior to agarose gel electrophoresis, AseI was used to digest the Cbs 5-3A PCR product and SspI was used to digest the Cbs 1R-2T PCR product (see materials and methods).
Detection of telomere-containing restriction fragments:
To detect telomere-containing restriction fragments, the fact that electrophoresis of such fragments results in “fuzzy” bands because of heterogeneity in telomere length and telomere addition site was exploited. Whole-cell DNA from inbred strains B and C3 was digested with Sau3A and separated on a 1.5% agarose gel. The DNA was blotted to a positively charged nylon membrane by standard Southern transfer procedures (Sambrook et al. 1989) and then crosslinked. Southern blots were probed with labeled Cbs insert DNA. Labeling, hybridization, and wash conditions were as in Hamilton and Orias (2000).
Determination of sizes of macronuclear chromosomes associated with cloned Cbs regions:
To determine the size of the flanking macronuclear chromosomes associated with each Cbs, Southern blots of clamped homogeneous electric field (CHEF) pulsed-field electrophoresis gels, referred to as “CHEF Southern blots” below, were probed.
Preparation of blots of macronuclear chromosomes:
High-molecular-weight DNA was prepared by embedding living cells from strain CU428.2 (Cole and Bruns 1992) in agarose plugs and lysing them using a modification of the method described in Birren and Lai (1993). The DNA plugs were inserted into the wells of a 1% Seakem Gold agarose gel (BioWhittaker, Walkersville, MD) in 1× TAE buffer. Various CHEF running conditions were used (D. Cassidy-Hanley, unpublished results) depending on preliminary estimates of the size of MAC chromosomes, most often obtained from gels using the following pulsed-field conditions: 30 hr, 120°, 6 V/cm, 1× TAE, and 14°. The DNA in the gel was acid depurinated, neutralized, and transferred to a positively charged nylon membrane by downward alkaline transfer (CHEF-DR III Instruction Manual and Applications Guide, Bio-Rad, Hercules, CA) using a Schleicher & Schuell (Keene, NH) TurboBlotter apparatus. After blotting, the DNA was crosslinked to the membrane using a BIOS (New Haven, CT) UV transilluminator.
Probe preparation:
Biotinylated probes were prepared using the KPL Random Primer biotinylation kit following the manufacturer's directions. In some instances, the cloned Cbs region was amplified by PCR prior to biotinylation. Briefly, 30 ng of linearized plasmid, 0.625 unit Fermentas Taq polymerase, 2.5 μl Fermentas 10× buffer (100 mm Tris-HCl, pH 8.8 at 25°, 500 mm KCl, 0.8% Nonidet P40), 2 μl of 25 mm MgCl2, and 10 μm each of the M13 reverse and M13 forward primers were combined in a 25-μl reaction mix and amplified as follows: 95° for 1 min—1 cycle; 95° for 30 sec, 55° for 30 sec, 72° for 2 min—40 cycles; 95° for 30 sec, 55° for 30 sec, 72° for 5 min—1 cycle. Ten microliters of each PCR reaction mix was biotinylated according to the Ambion (Austin, TX) BrightStar Psoralen-Biotin nonisotopic labeling kit protocol.
Hybridization and detection:
Membranes were prehybridized for 5 min in Sigma (St. Louis) Perfecthyb Plus hybridization buffer and 100 μg/ml sheared, single-stranded herring sperm DNA. Approximately 600 ng of labeled probe was denatured for 5 min at 95° in 9 μl of TE (pH 8.0), chilled on ice for 5 min, and combined with 7 ml of Sigma Perfecthyb Plus hybridization buffer and 100 μg/ml sheared, single-stranded herring sperm DNA, preheated to 65°. Hybridization was carried out at 65° overnight in heat-sealable bags with gentle agitation. Following hybridization, membranes were washed once for 5 min in 2× SSC/0.1% SDS at room temperature, and twice for 20 min in 0.5× SSC/0.1× SDS at 65°. Detection was done using the Ambion BrightStar BioDetect nonisotopic detection kit according to the manufacturer's instructions. Exposures of 5 min–2 hr were taken 2–24 hr after CDP-Star treatment using Kodak BioMax ML film.
RESULTS
Characterizing inserts with functional Cbs elements
Cbs-flanking sequence:
Sequences for 30 inserts that contain a functional Cbs are now available, as reported in the accompanying article by Hamilton et al. (2005)(this issue). Nucleotide sequences of the Cbs elements and adjacent DNA segments are shown in Figure 1. The results allow the following conclusions:
The sequences bracketing the Cbs elements are unique and very A + T rich, confirming and extending the findings of Yao et al. (1987). Alignments of the junctions in all pairwise combinations revealed statistically significant sequence similarity between only two pairs of Cbs junctions: Cbs 1R-6 and Cbs 1R-2 (match E = 2 × 10−43; Figure 2) and Cbs 3L-4 and Cbs 4L-3 (match E = 3 × 10⁻¹⁶; not shown).
Allowing for the high (88%) A + T bias and for statistical sampling error, it seems likely that any of the four possible base pairs can occupy any position within 25 bp (an arbitrarily chosen number) on either side of the Cbs element (Figure 1).
Figure 1.—

DNA sequences immediately flanking functional chromosome breakage elements. (A) Alignment of G and C nucleotides. A's and T's in the flanking sequence (88.1% of the nucleotides) have been replaced with spaces. Underlined capital A's indicate substitutions in the Cbs element sequence. Note that just the locations of C and G nucleotides are sufficient to demonstrate that no two of the 33 junctions have identical sequence. (B) Nucleotide distributions at each of the 25 positions on either side of the Cbs element (C-rich strand, as shown at the top of A). These tabulations failed to show any statistically significant deviation from the null hypothesis that any given nucleotide has the same probability of occurrence (0.440 for A and T and 0.060 for G and C) at any position within 25 bp adjacent to the edges of the Cbs element (see text).
Figure 2.—

Sequence similarity between Cbs junctions 1R-2 and 1R-6. The two sequences were aligned using the unfiltered Blastn program at the NCBI site. No. 1 positions correspond to the first matching base pair. The expected value associated with the match is 4 × 10−43. The percentage sequence identity is 83% (172/206 aligned positions), which is significantly higher (probability chi-square ≪0.001) than the 43% expected by chance alone, given the 92% A-+-T composition in the matching region. (Since the Cbs element has presumably been under selection pressure, its sequence was excluded from the chi-square analysis, although its inclusion makes a negligible probability difference.) Note that the sequence similarity occurs on both sides of the (underlined) Cbs element.
Functionally, these observations are consistent with the experimental demonstration that the Cbs element alone is sufficient for chromosome fragmentation (Yao et al. 1990).
Flanking chromosome sizes:
If an insert carries a functional Cbs, then the two DNA segments flanking the Cbs should hybridize to different MAC chromosomes. To test this prediction, every Cbs insert was PCR amplified using its specific primers, the PCR product was labeled, and a CHEF Southern blot of total DNA was probed. As expected, for most of the inserts identified as functional in Hamilton et al. (2005)(this issue), two bands were detected by hybridization (see Figure 3). Using size markers, the size of each flanking MAC chromosome was estimated (summarized in Table 3).
Figure 3.—

Two MAC chromosomes hybridize to labeled DNA probe from cloned inserts with functional Cbs junctions. Southern blots of three CHEF gels (pulsed-field conditions: 30 hr, 120°, 6 V/cm, 1× TAE, and 14°) of whole-cell DNA of inbred strains B (left lanes) and C3 (right lanes) were separately probed with labeled DNA from Cbs inserts 1L-3, 4L-2, and 5-7. MAC chromosome sizes are given in kilobases. No B-C3 size polymorphisms have been detected in any of the MAC chromosomes identified in this article, although one such polymorphism is known (Wong et al. 2000).
TABLE 3.
Macronuclear chromosome sizes
| Cbs | Flanking MAC chromosome size (kb) | |
|---|---|---|
| 1L-1 | 21 | NA |
| 1L-2 | 21 | 600a |
| 1L-3 | 560 | 780 |
| 1L-4 | 440 | 450 |
| 1L-5 | 85 | 640 |
| 1L-6 | 280 | MS |
| 1R-1 | 50 | 100 |
| 1R-2 | 1020 | MS |
| 1R-3 | 285 | NS |
| 1R-4 | 690 | 1180 |
| 1R-5 | 65 | 980 |
| 1R-6 | 280 | NS |
| 1R-7 | 610 | NS |
| 1R-8 | 315 | 1125 |
| 2R-1 | 285 | 1100 |
| 3L-1 | 230 | 670 |
| 3L-2 | 230 | 320 |
| 3L-3 | 145 | >1600 |
| 3L-4 | 350 | NM |
| 3R-1 | 595 | 625 |
| 4L-1 | NA | NA |
| 4L-2 | 200 | 625 |
| 4L-3 | MS | NM |
| 5-1 | 375 | 475 |
| 5-2 | 325 | 545 |
| 5-3 | 65 | 340 |
| 5-4 | 900 | 950 |
| 5-5 | 850 | 1600 |
| 5-6 | 680 | MS |
| 5-7 | 330 | 440 |
NA, not attempted—junctions reported by Yao et al. (1985)(1987) with too little flanking sequence; NS, no band detected—insufficient sensitivity (<60 bp of probe); MS, no band dectected—marginal sensitivity (<300 bp probe), respectively, on one side of the Cbs; NM, telomere-adjacent sequence not maintained.
In addition, each DNA segment flanking a functional Cbs insert should hybridize to the terminal restriction fragment of a MAC chromosome. Terminal fragments can be recognized after agarose gel electrophoresis because the band containing the telomere is dispersed (fuzzy), owing to the natural variability in the site of the telomere addition (∼30-bp range; see Hamilton et al. 2005, this issue) and in telomere length from molecule to molecule (an ∼200-bp range). To test this prediction, Southern blots of whole-cell DNA digested with Sau3AI were prepared. The blots were probed with labeled PCR product from Cbs inserts as above. The two predicted fuzzy bands were observed (data not shown) in all but one case tested, where only one, strongly hybridizing, fuzzy band was observed. In this case, the insert sequence revealed two Sau3A I sites equidistant from the Cbs element, thus yielding two coincident restriction fragments. This test was discontinued after the first 15 Cbs junctions, once the reliability of the PCR-based tests for functionality (described in Hamilton et al. 2005, this issue) was established.
Junctions for which two flanking MAC chromosomes were not detected:
For seven of the Cbs junctions (1L-6, 1R-2, 1R-3, 1R-6, 1R-7, 3L-4, and 5-6), only one hybridization band was seen with CHEF Southern blots, and for Cbs 4L-3 none was seen (Table 3). For Cbs 1R-3, 1R-6, and 1R-7 <60 bp of MAC-destined DNA was available on one side of the junction, so insufficient sensitivity of the probe is a likely explanation for the detection of a single hybridization band for these junctions. The remaining four cases (1L-6, 1R-2, 3L-4, and 5-6), which have >60 bp but <300 bp of MAC-destined flanking sequence on one side of the junction, are potentially explainable by coincidence in the size of the two flanking MAC chromosomes or by marginal sensitivity of detection of the hybridization signal.
Size coincidence or insufficient sensitivity could not provide a satisfactory explanation for the absence of any hybridization signal with Cbs 4L-3, where 520 bp are available for hybridization from the G side. (Only 170 bp are available on the T side, which likely explains the failure to detect a hybridization band corresponding to that MAC chromosome.) However, all of these PCR experiments had used DNA from young (<30 fissions old) cells, while the DNA used in the CHEF gels was obtained from a mature cell line, CU428.2. This led to an investigation into the possibility that at least the end of one MAC chromosome flanking the 4L-3 junction is incapable of long-term maintenance. Tel/SP-primed PCR amplification was attempted using DNA from 36 cell lines maintained for >500 fissions after conjugation (panel of terminal assortants). For three junctions that had one hybridization band (1L-6, 1R-2, and 5-6), PCR products of the correct size were observed for both sides (data not shown). Thus the failure to maintain flanking MAC chromosomes is an unlikely explanation for seeing only one hybridization band for these junctions. On the other hand, for Cbs 3L-4 and 4L-3, the Tel/SP-primed products with the predicted sizes were observed in older cell lines for only one side. For the other sides (the “C” side of 3L-4 and the “G” side of 4L-3), the predicted PCR products were observed only with the “young” B DNA controls; no amplification products were obtained with any of the 36 older cell lines (data not shown). For Cbs 4L-3, these findings were independently confirmed by using specific primers at two different locations on the “G” side, 197 and 325 bp away from the edge of the Cbs element, and by testing additional sets of young and old cells. A representative sample of the Cbs 4L-3 data is shown in Figure 4. Thus the most likely explanation for one missing hybridization band for Cbs 3L-4 and 4L-3 is that each of the Cbs generates one MAC chromosome end that is lost within 100 vegetative fissions.
Figure 4.—

Age-related loss of the end of Cbs 4L-3G MAC chromosome. PCR amplification was primed with the Tel primer and a Cbs 4L-3G specific primer whose 5′-end is located 220 bp from the edge of the Cbs element. Template DNA, lanes 1 and 9: inbred strain B, <30 fissions old; lanes 2 and 10: inbred strain C3, <30 fissions old; lanes 3 and 4: SB2379P and SB2393P (meiotic segregant panel), <30 fissions old; lanes 5 and 6: CU378 and CU385 (nullisomic panel), >150 fissions old; lanes 7 and 8: SB1819 and SB1820 (terminal assortant panel) >500 fissions old. The expected band is indicated with an arrow; its presence or absence is indicated by + or − under each lane. Slightly reduced primer annealing stringency was used to be sure that the absence of the band was not the result of a failed PCR reaction.
Genetically mapping Cbs-associated DNA polymorphisms
Mapping CBSPs to MIC linkage groups:
To map CBSPs to MIC linkage groups, DNA preparations from standard panels of meiotic segregants of a B/C3 heterozygote (see materials and methods) were tested using the appropriate specific PCR primers. Segregation to the B or C3 allele of the polymorphism was scored for each panel member. The segregation pattern for the entire panel was compared to those of ∼400 mapped polymorphisms, and linkage and map location were determined using MAPMAKER (Lander et al. 1987). The results are summarized in Table 2 and are shown in more detail in supplementary Table S3 at http://www.genetics.org/supplemental/. For every polymorphic Cbs, the linkage group assignments were entirely consistent with the results of nullisomic mapping to chromosome arms and provide a much more precise map location for the Cbs junctions.
Mapping CBSPs to MAC coassortment groups:
As indicated in the Introduction, DNA or other genetic polymorphisms in Tetrahymena can be independently assigned to MAC coassortment groups. This mapping is based on the cosegregation of markers on the same MAC chromosome in the face of random distribution of MAC chromosome copies at MAC division. To this end, DNAs from a panel of terminal assortants were tested by PCR amplification, using as primers Tel and the specific primer from the polymorphic side of the Cbs. The allele (B or C3) for which each panel member had assorted to purity was determined (see Figure 4 of the accompanying article by Hamilton et al. 2005, this issue). Most of the CBSPs were tested directly for coassortment because either (a) the magnitude of the genetically determined B-C3 band-size difference was large enough relative to the developmental size variation caused by microheterogeneity of the telomere addition site (described in Hamilton et al. 2005, this issue) or (b) the C3 DNA failed to template a band, presumably because of a DNA difference at the binding site of the specific primer. For polymorphisms with a B-C3 size difference too small relative to the developmental microheterogeneity, the problem was circumvented in one of two ways: (1) The PCR products were digested with a restriction enzyme that isolates the polymorphism from the telomere-associated fragment (e.g., Cbs 5-3G, Table 2) and (2) instead of the Tel primer, an inwardly directed specific primer that binds far enough away from the Cbs element (>40 bp) to be internal to all the various telomere addition sites was used (e.g., Cbs 1R-1G, Table 2). Using MAPMAKER, the assortment pattern of the polymorphic junctions was compared with those of 120 previously identified coassortment groups to determine whether the CBSP was coassorting with a previously mapped marker or was assorting independently. Coassortment group assignments for nine CBSPs are shown in Table 2. The complete set of coassortment data is shown in Figure 5. Three points are worth noting: (1) In all four cases of coassortment with a previously mapped genetic marker, the coassortment group was known to belong to the linkage group to which the CBSP had been independently mapped by meiotic segregation, providing additional confirmation of the genetic mapping; (2) the nearly complete coassortment with previously mapped markers rules out the existence of a general mechanism that increases the frequency of crossing over in the MAC subtelomeric region, which would have randomized the association of the CBSP with other loci on the same MAC chromosome; and (3) many of the CBSPs assort independently of all previously mapped loci, thus yielding additional genetically, physically, and sequence-tagged MAC chromosomes.
Figure 5.—
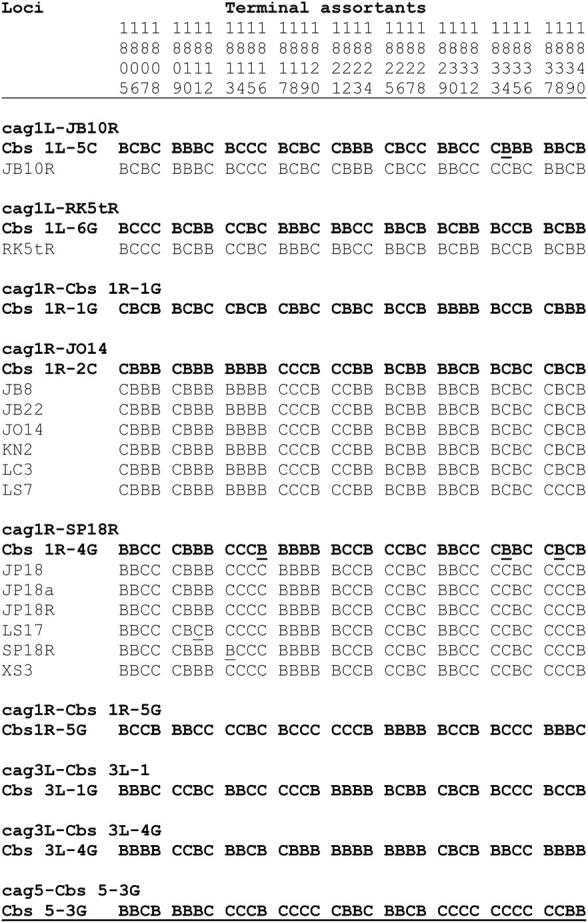
Assortment patterns of CBSPs. Terminal assortants are written vertically and omit the “SB” prefix. The name of each coassortment group is prefixed by “cag.” Assortment data for CBSPs are shown in boldface type. B and C represent the allele (B and C3, respectively) to which each genetic locus has assorted in each terminal assortant. CBSPs that assorted independently of all previously mapped loci were assigned to a new coassortment group of their own. Underlined letters call attention to putative MAC recombinational events (see Wickert et al. 2000).
DISCUSSION
Telomere-adjacent MAC chromosome sequence is unique:
This work confirms and greatly extends previous observations (Yao et al. 1987) that unique sequences flank Cbs elements (Figure 1 and sequence data deposited in GenBank). This is a useful property of Cbs elements because it should allow the unique sequence tagging of every subtelomeric segment in the MAC genome. This is in contrast to Tetrahymena MIC telomeres, where telomere-adjacent regions include a conserved sequence segment (Kirk and Blackburn 1995).
The methods developed here should allow the identification and characterization of the vast majority, if not all, of the Cbs elements in the genome. Every characterized Cbs junction constitutes a set of sequence-tagged sites (STSs), useful for physical mapping of both the MIC and the MAC genome. A Cbs junction comprises a MIC STS, detected by PCR amplification with the two specific Cbs flanking primers. Each junction also comprises two separate MAC chromosome STSs, detected by PCR amplification with the Tel primer and either specific primer. As STSs, the Cbs junctions will provide unique sequence from the natural endpoints of the MAC chromosomes, which will be useful for long-range assembly of MIC genome sequence.
Evidence for Cbs junction duplication:
Two pairs of Cbs junctions showed significant within-pair sequence similarity (Cbs 1R-2 with Cbs 1R-6 and Cbs 3L-4 with Cbs 4L-3; see Figure 2). The latter are in different MIC chromosomes. In this case, a MIC duplication of at least a few hundred base pairs that included a Cbs element may have increased the number of MAC chromosomes during the coevolution of the MIC and MAC genomes in T. thermophila. Since only ∼10% of the junctions are currently characterized, these findings raise the possibilities that other examples of junction sequence conservation will be found and that perhaps all Cbs junctions arose by a similar mechanism. If so, sequence similarity may reflect the age of the duplication event, i.e., the time when the two junctions branched off from one another and started evolving independently. These considerations suggest that Cbs 1R-2/1R-6 and 3L-4/4L-3 are the most recent duplications in this sample; the rest of the junctions would have resulted from duplications too old to have retained sequence similarity.
MAC chromosome sizes:
The average size of the MAC chromosomes so far identified by this Cbs work (Table 3) is ∼540 kb. This number would imply the existence of ∼190 MAC chromosomes, assuming a 104-Mb MAC genome and no chromosome size bias introduced by this approach. This estimate of the number of MAC chromosomes is in the range of the crude estimates currently available (Altschuler and Yao 1985; Conover and Brunk 1986).
As summarized in Table 3, the two MAC chromosomes generated by a given Cbs element generally differ in size (see also Figure 3) and do not appear to be size clustered in particular MIC chromosomes. The observation of a single hybridization band for eight junctions can be generally attributed to insufficient sensitivity on one side of the junction for detection of the hybridization signal. A second possibility is the generation of two flanking chromosomes of so nearly the same size that their hybridization signals are not resolved in the CHEF Southern blot. From Table 3 the average probability that the sizes of two randomly selected chromosomes fall within at most 5% of one another can be calculated as ∼1/25. Thus, one or at most a few junctions in this sample of 26 could generate flanking chromosomes of similar size. Additional work is required to rigorously determine the correct explanation for each of these cases.
Macronuclear chromosome ends incapable of long-term maintenance:
Potentially more interesting are the results obtained with Cbs 3L-4 and 4L-3. In particular, the lack of a hybridization band for Cbs 4L-3 cannot be fully explained by chromosome size coincidence or insufficient sensitivity on both sides of the junction. The key observation (Figure 4) was the production of Tel/SP-primed PCR amplification products of the predicted size from “young” (<30 fissions old) and not from older (>150 fissions old) cell DNA. Taken in conjunction with the missing hybridization signal, the simplest explanation is that each of these junctions generated two MAC chromosomes, but in each case the end (at least) of one chromosome is lost before 150 vegetative fissions; i.e., it is incapable of long-term maintenance.
The systematic, age-related loss of at least one end, and possibly of an entire MAC chromosome, could be explained by a chromosome-specific impairment of mechanisms that normally play a vital role in maintaining the integrity of the Tetrahymena expressed genome. These include replication control, copy-number control, and telomere maintenance. Regardless of the explanation, the loss implies the existence of a mechanism(s) in Tetrahymena capable of causing a vegetatively inherited developmental remodeling of the MAC genome with a novel feature, namely a delayed onset of occurrence. This mechanism(s) thus creates the opportunity for a novel type of developmental regulation of gene expression. The development of sexual maturity in Tetrahymena (Nanney 1974) and possibly the age-dependent reduction of the MAC chromosome average copy number from ∼66 to ∼45 (Doerder et al. 1977) are vegetatively inherited MAC differentiations with a delayed onset of expression, so far described only at the phenotypic level. Much additional work, combining the power of conventional genetics with the germline and somatic DNA replacement technology available in Tetrahymena (Turkewitz et al. 2002), will be required to reach a better understanding of these developmental phenomena.
Usefulness of Cbs junctions and associated DNA polymorphisms for relating genomic maps:
A valuable product of this work was the discovery of CBSPs because they can be genetically mapped with greater precision. CBSPs were readily and efficiently mapped to linkage and coassortment groups (Table 2 and Figure 5) using the very same B-C3 segregant panels previously used to map >400 markers on the MIC and MAC genetic maps.
Mapped CBSPs will have useful genomic applications:
Since roughly a third of the Cbs junctions characterized so far have associated polymorphisms, the completed genome-wide Cbs characterization should add ∼100 new markers to the genetic maps and thus provide as many additional links between the genetic, physical, and sequence maps.
The majority of the junctions have subtle associated polymorphisms (e.g., small insertion/deletions or SNPs), which can also be genetically mapped. Coassortment of polymorphisms on both ends of a MAC chromosome may facilitate the scaffolding of MAC chromosome sequence interrupted by physical gaps.
By increasing the number of genetically and physically tagged MAC chromosomes, CBSPs may help in the physical mapping of mutant genes by genetic coassortment and thus in their positional cloning.
The richness of genetic analysis enabled by nuclear dimorphism adds novel methodologies for the assembly of the sequence of the valuable Tetrahymena genome and for its productive use.
Acknowledgments
We thank Helen Smith for excellent technical assistance and Glenn Herrick and anonymous reviewers for many improvements resulting from their critical reading of the manuscript. We gratefully acknowledge the support by the National Institutes of Health (grant RR-02391 from the National Center for Research Resources to E.O.) and the National Science Foundation (grant 9817121 to P.J.B.)
Sequence data from this article have been deposited with the EMBL/GenBank Data Libraries under accession nos. AY653004, AY653005, AY653006, AY653007, AY653008, AY653009, AY653010, AY653011, AY653012, AY653013, AY653014, AY653015, AY653016, AY653017, AY653018, AY653019, AY653020, AY653021, AY653022, AY653023, AY653024, AY653025, AY653026, AY653027, AY653028, AY653029.
References
- Altschuler, M. I., and M. C. Yao, 1985. Macronuclear DNA of Tetrahymena thermophila exists as defined subchromosomal-sized molecules. Nucleic Acids Res. 13: 5817–5831. [DOI] [PMC free article] [PubMed] [Google Scholar]
- Birren, B., and E. Lai, 1993 Pulsed Field Gel Electrophoresis: A Practical Guide. Academic Press, New York.
- Brickner, J. H., T. J. Lynch, D. Zeilinger and E. Orias, 1996. Identification, mapping and linkage analysis of randomly amplified DNA polymorphisms in Tetrahymena thermophila. Genetics 143: 811–821. [DOI] [PMC free article] [PubMed] [Google Scholar]
- Cole, E. S., and P. J. Bruns, 1992. Uniparental cytogamy: a novel method for bringing micronuclear mutations of Tetrahymena into homozygous macronuclear expression with precocious sexual maturity. Genetics 132: 1017–1031. [DOI] [PMC free article] [PubMed] [Google Scholar]
- Conover, R. K., and C.F. Brunk, 1986. Macronuclear DNA molecules of Tetrahymena thermophila. Mol. Cell. Biol. 6: 900–905. [DOI] [PMC free article] [PubMed] [Google Scholar]
- Doerder, F. P., J. H. Lief and L. E. Debault, 1977. Macronuclear subunits of Tetrahymena thermophila are functionally haploid. Science 177: 946–948. [DOI] [PubMed] [Google Scholar]
- Hamilton, E. P., and E. Orias, 2000 Genetically mapping new mutants and cloned genes, pp. 263–278 in Tetrahymena thermophila, edited by D. J. Asai and J. D. Forney. Academic Press, New York. [DOI] [PubMed]
- Hamilton, E., P. Bruns, C. Lin, V. Merriam, E. Orias et al., 2005. Genome-wide characterization of Tetrahymena thermophila chromosome breakage sites. I. Cloning and identification of functional sites. Genetics 170: 1611–1621. [DOI] [PMC free article] [PubMed] [Google Scholar]
- Kirk, K. E., and E. H. Blackburn, 1995. An unusual sequence arrangement in the telomeres of the germ-line micronucleus in Tetrahymena thermophila. Genes Dev. 9: 59–71. [DOI] [PubMed] [Google Scholar]
- Lander, E. S., P. Green, J. Abrahamson, A. Barlow, M. J. Daly et al., 1987. MAPMAKER: an interactive computer package for constructing primary genetic linkage maps of experimental and natural populations. Genomics 1: 174–181. [DOI] [PubMed] [Google Scholar]
- Longcor, M. A., S. A. Wickert, M.-F Chau and E. Orias, 1996. Coassortment of genetic loci during macronuclear division in Tetrahymena thermophila. Eur. J. Protistol. 32(Suppl. 1): 85–89. [Google Scholar]
- Lynch, T. J., J. H. Brickner, K. J. Nakano and E. Orias, 1995. Genetic map of randomly amplified DNA polymorphisms closely linked to the mating type locus of Tetrahymena thermophila. Genetics 141: 1315–1325. [DOI] [PMC free article] [PubMed] [Google Scholar]
- Nanney, D. L., 1974. Aging and long-term temporal regulation in ciliated protozoa. A critical review. Mech. Ageing Dev. 3: 81–105. [DOI] [PubMed] [Google Scholar]
- Sambrook, J., E. F. Fritsch and T. Maniatis, 1989 Molecular Cloning: A Laboratory Manual. Cold Spring Harbor Laboratory Press, Cold Spring Harbor, NY.
- Turkewitz, A. P., E. Orias and G. Kapler, 2002. Functional genomics: the coming of age for Tetrahymena thermophila. Trends Genet. 18: 35–40. [DOI] [PubMed] [Google Scholar]
- Wickert, S., and E. Orias, 2000. Tetrahymena micronuclear genome mapping: a high resolution map of chromosome 1L. Genetics 154: 1141–1153. [DOI] [PMC free article] [PubMed] [Google Scholar]
- Wickert, S., L. Nangle, S. Shevel and E. Orias, 2000. Tetrahymena macronuclear genome mapping: colinearity of macronuclear coassortment groups and the micronuclear map of chromosome 1L. Genetics 154: 1155–1167. [DOI] [PMC free article] [PubMed] [Google Scholar]
- Wong, L., L. Klionsky, S. Wickert, V. Merriam, E. Orias et al., 2000. Autonomously replicating macronuclear DNA pieces are the physical basis of coassortment groups in Tetrahymena thermophila. Genetics 155: 1119–1125. [DOI] [PMC free article] [PubMed] [Google Scholar]
- Yao, M.-C, S. G. Zhu and C. H. Yao, 1985. Gene amplification in Tetrahymena thermophila: formation of extrachromosomal palindromic genes coding for rRNA. Mol. Cell. Biol. 5: 1260–1267. [DOI] [PMC free article] [PubMed] [Google Scholar]
- Yao, M.-C, K. Zheng and C. H. Yao, 1987. A conserved nucleotide sequence at the sites of developmentally regulated chromosomal breakage in Tetrahymena. Cell 48: 779–788. [DOI] [PubMed] [Google Scholar]
- Yao, M.-C, C. H. Yao and B. Monks, 1990. The controlling sequence for site-specific chromosome breakage in Tetrahymena. Cell 63: 763–772. [DOI] [PubMed] [Google Scholar]