

Abstract
Bioinformatic analyses of maize EST sequences have highlighted large numbers of candidate genes putatively involved in agriculturally important traits. To contribute to ongoing efforts toward mapping of these genes, we used two populations of intermated recombinant inbred lines (IRILs), which allow a higher map resolution than nonintermated RILs. The first panel (IBM), derived from B73 × Mo17, is publicly available from the Maize Genetics Cooperation Stock Center. The second panel (LHRF) was developed from F2 × F252 to map loci monomorphic on IBM. We built framework maps of 237 loci from the IBM panel and 271 loci from the LHRF panel. Both maps were used to place 1454 loci (1056 on map IBM_Gnp2004 and 398 on map LHRF_Gnp2004) that corresponded to 954 cDNA probes previously unmapped. RFLP was mostly used, but PCR-based methods were also performed for some cDNAs to map SNPs. Unlike in usual IRIL-based maps published so far, corrected meiotic centimorgan distances were calculated, taking into account the number of intermating generations undergone by the IRILs. The corrected sizes of our framework maps were 1825 cM for IBM_Gnp2004 and 1862 cM for LHRF_Gnp2004. All loci mapped on LHRF_Gnp2004 were also projected on a consensus map IBMconsensus_Gnp2004. cDNA loci formed clusters near the centromeres except for chromosomes 1 and 8.
LINKAGE mapping has been carried out in maize by numerous laboratories since the 1980s and large amounts of data are now available in the MaizeGDB database (http://www.maizegdb.org/). Several types of mapping panels have been used in maize, including F2 (Beavis and Grant 1991), immortalized F2 (Gardiner et al. 1993; Davis et al. 1999), and recombinant inbred line (RIL) populations (Burr et al. 1988; Causse et al. 1996). Composite maps have also been constructed from multiple crosses (Davis et al. 1994; Causse et al. 1996). The present reference public map of maize is the IBM2 map (see MaizeGDB), based on intermated recombinant inbred lines (IRILs) obtained from the cross B73 × Mo17 by including four generations of intermating among F2 plants before selfing. Compared to usual RILs, such lines offer an increase of map resolution, due to the additional recombination events occurring during intermating (Beavis et al. 1992; Liu et al. 1996; Sharopova et al. 2002; Winkler et al. 2003). The IBM2 map was used to pool loci from several other maps by homothetic projection (M. L. Polacco, unpublished results; see MaizeGDB), to design the “IBM2 neighbors” map, which is so far the most comprehensive public source of locus position information on a single consensus maize map. So IRILs proved their usefulness, but to our knowledge, all published maize linkage maps derived from IRILs to date display inappropriately estimated centimorgan distances obtained from calculations based on theoretical developments that should be used only with nonintermated RILs.
More recently, physical mapping has been undertaken within the Maize Mapping Project (MMP; http://www.maizemap.org/; Bharti et al. 2004), so that a constantly improving integrated physical and genetic map is available (Wei et al. 2004). Anchoring the physical and genetic maps requires many high-quality single-locus markers placed on both maps, and the availability of such data is one of the significant bottlenecks of the map integration process, although the situation is improving rapidly (Gardiner et al. 2004). In this context, extensive gene mapping programs are very useful as a potential source of links between physical and genetic maps. In addition to classical RFLP or single-nucleotide polymorphism (SNP)-based projects, numerous ESTs have been simply PCR amplified, electrophoresed, and screened on the parents of different crosses, to provide a higher chance of finding insertion-deletion polymorphism (IDP) to generate more gene mapping information (Wen et al. 2002). In addition to classical genetic and physical mapping, alternative approaches have also been considered for high-throughput mapping of maize cDNA. For instance, radiation hybrid panels have been built on the basis of oat-maize addition lines (Okagaki et al. 2001) or hamster ovary cells (Davis et al. 2000). Similarly, physically sheared DNA diluted at subhaploid genome equivalent level has also been used (Dear and Cook 1993). But the availability of the maize physical map may now lower the relevancy of such approaches. Moreover, sequencing of the maize genome is now on the way (Chandler and Brendel 2002), which promises ideal in silico mapping possibilities in the near future.
To identify as many genes as possible that control agriculturally important traits in maize, Genoplante—the French genomics consortium—has developed a candidate-gene approach based on combining functional and positional information (Murigneux et al. 2003). Several standard or subtractive cDNA libraries were built to produce EST sequences, which went through an automatic functional annotation pipeline, sometimes followed by a literature survey of known genes of similar functions and manual reannotation of the sequence, to identify candidate genes on the basis of their putative function. Loci derived from these genes were then genetically mapped to look for colocalization with QTL. This was achieved by pooling on a single consensus map the positions and confidence intervals of the QTL, as well as the positions of as many mapped cDNA loci as possible, including our cDNA mapping results as well as the gene and cDNA loci of the IBM2 neighbors map publicly available on MaizeGDB. The best functional and positional candidates then have to undergo functional validation processes, such as reverse genetics mutant collection screening, overexpression or knockout transgenic approaches, or association studies between allelic polymorphism of the gene and phenotypic data. In such strategies, an important bottleneck is the step of cDNA mapping because previous steps of EST sequence annotation are partially automated and generate a high number of candidate cDNAs, whereas placing these cDNAs on a linkage map requires extensive wet bench work as long as no genomic sequence is available.
In this article, we present the cDNA linkage mapping results obtained within the Genoplante consortium. Our objective was to map the candidate genes identified by the consortium so that their map locations could be confronted with QTL positions. So we built framework maps, placed the loci on them, and integrated all locus positions on a consensus map. Cross-operability with the international maize mapping initiatives was sought as much as possible, so that our mapping results could be easily integrated with public data and would, for instance, provide a valuable contribution to the anchoring of the public physical and genetic maps. Thus, the IBM population, which is now used for the IBM2 public reference map, was chosen as the principal mapping panel. To map loci that are monomorphic between the parental lines B73 and Mo17, from which IBM was derived, we developed the LHRF IRIL panel at INRA from the cross F2 × F252, and we used it to build another framework map. Both maps were tightly connected by numerous shared loci to make data integration between them as accurate as possible (Falque et al. 2003). All genetic distances were also corrected according to a recent theoretical development, to get corrected meiotic centimorgans.
In addition to cDNAs, we mapped anonymous SSR or RFLP markers. The goal was to increase the number of loci in common between our maps and the different maps used by the international maize community. This is particularly useful to project QTL and candidate gene positions on a single map for colocalization studies. Indeed, the availability of common markers is essential to get accurate projection of loci from one map onto another.
MATERIALS AND METHODS
Mapping panels:
The IBM mapping panel we used is the subset of 94 lines chosen as the international community mapping resource (http://www.maizemap.org/94_ibm.htm) among a total of 302 lines distributed by the Maize Genetics Cooperation Stock Center. F7:F8 IBM seeds were provided by Mike Lee (Iowa State University) in 1998. The LHRF mapping panel was built by Alain Charcosset and co-workers at INRA, UMR de Génétique Végétale, Gif-sur-Yvette, France, according to the same scheme as IBM, with four generations of intermating. The LHRF lines used for DNA extraction in this study were F5:F6. For both mapping panels, 94 lines were used for PCR-based genotyping, and 81 or 85 lines for RFLP genotyping. This limited population size was imposed by technical constraints, considering the large number of cDNAs to be genotyped. However, the choice of IRILs provides a map resolution comparable to that obtained with larger RIL populations (Liu et al. 1996).
DNA extraction was performed according to Rogers and Bendich (1985) with some differences: Four grams of young maize leaves were ground in dry ice and then incubated with 9 ml of 2% CTAB buffer at 65° for 30 min. Then, 7 ml chloroform:isoamyl alcohol (24:1) was added and the tubes were centrifuged at 9000 × g for 20 min at 4°. The top phase was treated with 500 μg RNAse and incubated at 37° for 30 min. Four milligrams ProteinaseK were then added and incubated at 37° for 60 min. Then 1/10 volume of 65° 10% CTAB was added and the tubes were incubated for 10 min at room temperature. We then added 7 ml of chloroform:isoamyl alcohol (24:1) and centrifuged them at 9000 × g for 15 min at 4°. The top phase was precipitated with 19 ml CTAB precipitation buffer for 30 min at room temperature. Samples were then centrifuged at 12000 × g for 30 min at 4°. The DNA pellets were isolated and incubated with 100 μg RNAse at 37° for 30 min. Then 500 μl of phenol:chloroform:isoamyl alcohol (25:24:1) was added, the tubes were centrifuged at 13,000 × g for 15 min at 4°, and the top phase was transferred into a new tube with 500 μl chloroform:isoamyl alcohol (24:1) and centrifuged at 9000 × g for 15 min at 4°. The top phase was transferred into a new tube, and DNA was precipitated with 50 μl 1 m NaCl and 1 ml 100% ethanol and resuspended in TE buffer.
RFLP genotyping:
DNA of the parental lines was digested with EcoRI, EcoRV, HindIII, BamHI, or BglII for at least 4 hr at 37° and then run in a 0.8% agarose gel, in 1× TBE (0.89 m Tris, 0.89 m orthoboric acid, 20 mm EDTA) buffer overnight at 33 V. Before transfer, the gel was soaked in 0.25 n HCl for 10 min. DNA was transferred onto charged nylon filters [Amersham (Arlington Heights, IL) HybondN+] using alkaline transfer (Reed and Mann 1985). For hybridization, 40 ng DNA was 32P-radiolabeled by random priming (Feinberg and Vogelstein 1983), using the Amersham Megaprime DNA labeling system. Prehybridization and hybridization were carried out for 4 hr and overnight, respectively, both at 68° in 6× SSC, 5× Denhart's solution, 0.5% SDS, and 250 μg denatured salmon sperm DNA per milliliter. Membranes were washed twice for 15 min each at 65° in 2× SSC, once in a plastic box at the same stringency for 30 min at 65°, and then for 30 min at 65° in 2× SSC with 0.1% SDS. Then, and depending on the membrane activity after the previous washes, we washed them once for 15 min at 65° in 0.1× SSC with 0.1% SDS. Blots were dried and then autoradiographed for 5–15 days at −80° with Amersham Hyperfilm M, using intensifying screens. DNA probes used for RFLP genotyping were sometimes longer than the associated EST sequence, which is available from dbEST (http://www.ncbi.nlm.nih.gov/dbEST/).
PCR-based cDNA genotyping:
Gene-specific primers (supplementary Table S4 at http://www.genetics.org/supplemental/) were designed from EST sequences by using the SPADS software (Thareau et al. 2003) to amplify and sequence a part of the gene (referred to as “probe”) to look for SNP and IDP between B73 and Mo17 and, if there was none, between F2 and F252. IDPs were preferred when possible, because of their easier genotyping. In rare cases, two different primer pairs (probes) were designed from the same sequence to map two fragments of the gene independently as a control. Initial PCR amplifications of the genes for subsequent allele-competitive PCR (AC-PCR) SNP genotyping were carried out in 25 μl total volume, with 200 ng genomic DNA, Taq polymerase buffer (QIAGEN, Valencia, CA), 3 mm MgCl2, 0.6 mm of each dNTP, 1 unit Taq polymerase (QIAGEN), and 0.5 μm of each gene-specific primer. Thermal cycling conditions were 94° for 5 min; 35 cycles of 94° for 30 sec, 56° for 30 sec, and 72° for 30 sec; and a final extension of 72° for 5 min.
SNP genotyping by AC-PCR was developed at INRA Le Moulon, Gif-sur-Yvette, France (M. Falque, unpublished data). It was carried out in 25 μl total volume, with 2 μl of 1/50 diluted product of the initial PCR, Taq polymerase buffer (QIAGEN), 3 mm MgCl2, 0.6 mm of each dNTP, 1 unit Taq polymerase (QIAGEN), and the three following primers: (1) 0.5 μm of a (short) forward primer designed from the sequence immediately upstream to the SNP, with the base at its 3′ extremity corresponding to the SNP position, and matching one of the possible alleles of the SNP; (2) 0.25 μm of a (long) similar forward primer, but with the base at the 3′ extremity matching the alternate allele of the SNP, and with a M13 forward tail (5′-CACGACGTTGTAAAACGAC-3′) added to the primer sequence at the 5′ side so that PCR products originating from this long forward primer are 19 bp longer than those originating from the short forward primer; and (3) 0.5 μm of a reverse primer designed to get an amplified product length of 100–200 bp with either the short or the long forward primer. The competition between both forward primers results in a much higher priming efficiency for the primer with a correct match at the 3′ base, so that depending on the allele at the SNP position, either the short or the long forward primer will be involved in the product. Thermal cycling conditions were 94° for 5 min; 35 cycles of 94° for 30 sec, 65° or 60° for 30 sec, and 72° for 30 sec; and a final extension of 72° for 5 min. The product was electrophoresed on a 4% MetaPhor (TEBU) agarose gel with 1 mg/ml ethidium bromide during 4 hr at 120 V, so that the 19-bp size differences between the two SNP alleles were easy to read.
SNP genotyping by SSCP (Orita et al. 1989) was carried out by capillary electrophoresis on an ABI Prism 3100 genetic analyzer (PE Applied Biosystems, Foster City, CA) after a two-round PCR. All PCR amplifications were carried out in a total volume of 20 μl with 15 ng genomic DNA for the first-round PCR or 3 μl of the first-round PCR product diluted 1:100 for the second-round PCR, 0.6 unit of Taq DNA polymerase (Invitrogen, San Diego), 10 pmol of each gene-specific primer, 2.5% glycerol, 1.5 mm MgCl2, and 0.2 mm dNTP. The first-round PCR used specific primers extended at their 5′-end with a modified M13 universal sequence. The cycling program was 94° for 2 min and then 10 cycles of 94° for 1 min, 61° with a 0.6° decrease at each cycle for 50 sec, and 72° for 1 min 30 sec; then 25 cycles of 94° for 1 min, 55° for 50 sec, and 72° for 1 min 30 sec; and finally 72° for 10 min. PCR products were controlled by electrophoresis on a 1.5% agarose gel. The second-round PCR used M13 forward primer (5′-CACGACGTTGTAAAACGAC-3′) 5′-end labeled with NED (PE Applied Biosystems) and M13 reverse primer (5′-CAGGAAACAGCTATGACC-3′) 5′-end labeled with 6-FAM (5-carboxyfluorescein). The cycling program was 94° for 2 min; 25 cycles of 94° for 1 min, 58° for 50 sec, and 72° for 1 min 30 sec; and 72° for 10 min. Four microliters of the second-round PCR product diluted 1:10 was then added for capillary electrophoresis to a 13.25-μl loading solution containing 64% Hi-Di formamide, 0.01 n NaOH, and 1.9% MegaBACE ET900-R size standard. The run was performed as described by Bernat et al. (2002), using a 36-cm capillary array.
SSR genotyping:
PCR amplification reactions were performed in 20 μl containing 500 ng genomic DNA, 1× reaction buffer (QIAGEN), 3 mm MgCl2, 0.2 mm each dNTP, 0.4 mm each primer, and 1 unit of Taq DNA polymerase (QIAGEN). The cycling program was 94° for 2 min; 35 cycles of 94° for 45 sec, 56° for 45 sec, and 72° for 1 min; and 72° for 7 min. PCR products were electrophoresed on 3% MetaPhor (TEBU) agarose gels for 180 min at 150 V and stained with ethidium bromide.
Mapping data analysis:
We had to build the IBM_Gnp2004 framework map presented in this article because the Genoplante cDNA mapping program started before the community mapping group had built the first version of the IBM2 framework map available on MaizeGDB. To build the two framework maps on which the loci would be placed, we selected a set of markers according to the following criteria: (1) The order of the loci along the chromosomes should be as statistically reliable as possible, (2) there should be as many core bin markers (Gardiner et al. 1993) as possible, (3) there should be as many loci as possible in common between both framework maps, and (4) there should be preferentially easy-to-score SSR markers. To ensure direct compatibility of our data with the IRIL-based maize linkage maps publicly available to date, we achieved map computation with MapMaker software (Lander et al. 1987), using the “RI self Haldane” parameters. Unlike the Kosambi function, the Haldane function assumes no interference. This may be untrue, but the effect of interference in IRILs is extremely diluted because numerous successive meioses are involved in shaping the final distribution of recombination events observed, and we observed indeed no better additivity of distances with Kosambi's function (M. Falque, unpublished results). The order of framework loci was determined with a LOD value of ≥1.0, except for limited segments of lower stability (Figure 1). Given the limited size of the panel and its highly recombinant structure, it was not possible to use a higher LOD threshold. Once the framework maps were built, subsequent mapping of candidate gene-related loci or additional other markers was carried out by using the ActionMap software developed in our laboratory (Albini et al. 2003). This package interacts automatically with MapMaker to assign each new locus to its chromosome and to its most likely interval between framework loci. Map positions are then calculated according to the most likely assignment. Each locus is mapped independently on the framework map, so that possible low-quality mapping of some loci does not alter subsequent mapping of other loci, and results refer to a stable reference map. MapMaker parameters used through ActionMap were the same as for building the framework maps manually.
Figure 1.—

Chromosome 1 of framework IBM_Gnp2004 and LHRF_Gnp2004 maps used for cDNA mapping. The complete figure with all 10 chromosomes is available as supplementary Figure S1 at http://www.genetics.org/supplemental/. Links between maps indicate common markers. Core bin markers are boxed. Hatched segments in the chromosome axis indicate segments within which the LOD value indicating the stability of the order between loci is <1. Map coordinates at the left side of the axis are in overestimated centimorgans calculated by MapMaker using the “RI self Haldane” parameters, whereas positions in italics at the right side of the axis are corrected meiotic centimorgan distance (CCD) coordinates, taking into account the four generations of intermating undergone by the mapping population (see materials and methods). Side plots indicate the frequencies of the B73 or F2 allele in the segregation data (dots) for all loci mapped against these frameworks, as well as the 1% confidence interval (lines) of the expected frequency (0.5), taking into account sample size and genetic drift during the four generations of intermating (see materials and methods). Open circles indicate the position of the centromeres (from MaizeGDB).
In addition to the cDNA and anonymous loci we mapped, Mike Lee [Iowa State University (ISU)] kindly provided us with IBM map scores of 165 loci, and we extracted IBM map scores of 817 additional loci from the Maize Mapping Project. All these data were also computed with the ActionMap software to assign the loci to the IBM_Gnp2004 framework.
To pool all the mapped cDNA loci on the IBMconsensus_Gnp2004 framework map, those primarily mapped on LHRF_Gnp2004 were projected onto IBM_Gnp2004. Such homothetic projections were computed with the BioMercator software developed in our laboratory (Arcade et al. 2004), based on loci common to both maps.
Calculation of corrected meiotic centimorgan distances:
The “RI self” parameter of MapMaker was used first to ensure cross-compatibility with IBM-based public maps. This method yields, however, overestimated centimorgan distances relative to the classical definition of genetic distance, because the calculation is inappropriate with IRILs. To our knowledge, no mapping software available to date proposes algorithms developed specifically for IRIL panels. As a consequence, direct comparison of genetic distances is not possible with F2, backcross, or RIL-derived maps. For this reason, we additionally computed corrected meiotic centimorgan distances (CCDs) on the basis of recent theoretical developments proposed by Winkler et al. (2003). These authors adapted the approach used by Haldane and Waddington (1931) on RILs, to extend it to IRILs. They stated that if Rn is the recombination fraction observed among IRILs having undergone n generations of panmictic intermating before selfing, the crossover rate per meiosis r follows the relation
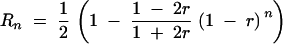 |
We computed iterations to get the estimates of r corresponding to the R4 values for each interval between adjacent loci in IBM_Gnp2004 and LHRF_Gnp2004 maps. Genetic distances were then calculated from r according to Haldane (1919). R4 values were calculated from the genetic distances produced by MapMaker (with the RI self option), by applying first a reversed Haldane distance function (Haldane 1919) to get r and then the relation stated by Haldane and Waddington (1931) to get R4. This distance conversion process was computed with the IRILmap software developed in our laboratory (Falque 2005; http://moulon.inra.fr/~bioinfo/mapping/irilmap1.html).
By this means, we computed CCDs between adjacent loci of our IBM_Gnp2004 and LHRF_Gnp2004 framework maps, to obtain CCD map coordinates for all framework loci. To generate also CCD map coordinates for all the nonframework loci, we calculated the CCD between each nonframework locus and its immediately proximal framework locus and added this distance to the CCD map coordinate of the framework locus.
Simulation of genotyping errors:
To investigate the consequence of possible genotyping errors on framework map size expansion, we computed simulated maps based on the IBM_Gnp2004 framework, including increasing rates of randomly distributed false segregation data. The order of loci was conserved as in the initial map. Crossover rates between adjacent loci were calculated as for RILs according to Haldane and Waddington (1931) from the proportion of recombinant plants, and the Haldane distance function (Haldane 1919) was used. When recombination fractions exceeded 0.5, the distance was arbitrarily set to 100 cM.
Confidence interval of allele frequencies:
To test allele frequencies for significant deviation from the 1:1 expected ratio, we calculated their 1% confidence interval (C.I.) as
 |
where p0 is the expected 0.5 allele frequency, N is the number of valid genotyping data at the locus, Ne is the effective population size during intermating (estimated at 300), and g = 4 is the number of intermating generations.
RESULTS
All mapping data presented in this article are available at http://genoplante-info.infobiogen.fr/GnpMap and will be submitted, including map scores, to MaizeGDB.
Framework maps:
The IBM_Gnp2004 framework includes 237 loci, among which 84 are core bin markers (Gardiner et al. 1993) or very close equivalents (Figure 1). The LHRF_Gnp2004 framework is made of 271 loci including 51 core bin markers (Figure 1). These maps share 106 loci. The total framework map length is 4039 cM for IBM_Gnp2004 and 4135 cM for LHRF_Gnp2004 when computed as for RILs with MapMaker or 1825 cM for IBM_Gnp2004 and 1862 cM for LHRF_Gnp2004 when calculating CCDs. Simulated errors in the IBM_Gnp2004 data set expanded the map size (Figure 2) as much as 8% for only 1% errors.
Figure 2.—

Effect of simulated data errors on map size expansion. The vertical axis indicates the percentage of map size expansion consecutive to increasing frequencies of randomly distributed simulated errors in the segregation data of the IBM_Gnp2004 framework map. The solid line indicates the mean value, and dashed lines show the minimum and maximum values obtained during 1000 simulations.
cDNA mapping:
Ninety-three percent of the cDNA probes tested for RFLP genotyping gave readable patterns. Screening blots containing the four parental lines digested by five restriction enzymes showed that 5.0% of the probes were monomorphic on both crosses, 6.7% were polymorphic between B73 and Mo17 but monomorphic between F2 and F252, 11% were polymorphic between F2 and F252 but monomorphic between B73 and Mo17, and 77% were polymorphic on both crosses. Among the polymorphic probes screened, 90% were successfully genotyped on at least one of the mapping panels.
According to the patterns observed on the parental screening blots, we estimated that 22% of the probes were single copy, 67% hybridized to two to five copies, and 9.8% displayed complex patterns or smears, indicating highly repeated sequences. Most of the time, a single probe-enzyme combination was chosen for subsequent genotyping of the mapping panel, but for a small number of particularly interesting functional candidate genes, we tried to map as many loci as possible.
In addition to RFLP experiments, some loci were mapped by PCR-based genotyping methods. PCR amplification on the four parental lines and sequencing of the alleles was successful for 84% of the genes tested. This revealed IDP or SNP polymorphism in at least one of the crosses for 76% of the sequenced genes. Among these polymorphic genes, 96% were successfully genotyped on one of the mapping populations.
Linkage analysis of the RFLP and PCR segregation data led to a successful mapping in 98% of the cases. The remaining markers were not possible to place on the framework map according to our quality criteria.
In total, we mapped 1454 cDNA loci (supplementary Table S1 at http://www.genetics.org/supplemental/), 1056 on IBM_Gnp2004 and 398 on LHRF_Gnp2004. These loci correspond to 954 cDNA probes for which information related to sequence and annotation (Samson et al. 2003) is available in supplementary Table S2 (http://www.genetics.org/supplemental/). Mapping was performed on IBM_Gnp2004 for 735 probes, on LHRF_Gnp2004 for 289 probes, and on both for 70 probes. All LHRF_Gnp2004 loci were projected onto IBMconsensus_Gnp2004 (supplementary Table S1). One probe was mapped to 10 loci, 1 on 9 loci, 3 on 8 loci, 2 on 7 loci, 8 on 6 loci, 8 on 5 loci, 24 on 4 loci, 53 on 3 loci, 200 on 2 loci, and 654 on 1 single locus. This distribution reflects the fact that in rare cases only we sought for the mapping of all segregating bands. It gives then little indication of the distribution of the genes copy numbers in the maize genome. The use of the LHRF mapping panel made it possible to map 219 probes that were monomorphic with IBM (on 270 loci) and to find 128 additional loci for 70 probes that were already mapped on IBM_Gnp2004.
The relationship between MapMaker-computed distance and CCD for IRILs having undergone four generations of intermating is nonlinear (Figure 3). The rate of overestimation in MapMaker-computed distance is ∼2.0 for very small distances, as expected from calculations based on Winkler et al. (2003), then reaches 2.4 for 36 cM CCD and decreases for higher distances (Figure 3).
Figure 3.—

Relationship between MapMaker-computed distance using the “RI self Haldane” option (solid line) and corrected centimorgan distance (CCD) for IRILs having undergone four generations of random intermating. The right vertical axis and dashed line indicate the rate of distance overestimation resulting from the use of MapMaker with the RI self Haldane option to compute distances from IRIL populations.
The cDNA loci are distributed all along the 10 chromosomes (Figure 4). For chromosomes 2, 3, 4, 6, 7, 9, and 10, the main mode of locus density matches close to the centromeric zone. Chromosomes 1, 4, 5, 6, 8, and 10 seem to have bimodal or multimodal distributions. For chromosomes 1, 5, and 8, the main mode is unclear and/or does not clearly match with the centromere.
Figure 4.—

Density of cDNA mapped along the linkage groups of the IBM_Gnp2004 map. Loci projected from LHRF_Gnp2004 are included. The horizontal axis indicates the number of cDNA mapped. The vertical axis indicates map coordinates in centimorgans on the IBM_Gnp2004 map. Arrows indicate the position of the centromeres (according to MaizeGDB).
Mapping anonymous loci:
In addition to cDNAs, we mapped 369 anonymous SSR or RFLP markers on IBM_Gnp2004 and 61 on LHRF_Gnp2004 (supplementary Table S3 at http://www.genetics.org/supplemental/). From the IBM segregation map scores provided by Mike Lee and the MMP, we mapped 982 additional loci on IBM_Gnp2004 and calculated CCD map coordinates for each of them (supplementary Table S3).
Segregation distortion:
Significant distortion (α = 1%) from the expected 1:1 segregation ratio was observed in 21% of the loci for IBM_Gnp2004 and also 21% for LHRF_Gnp2004. The distribution of allele frequencies along the chromosomes (Figure 1) shows regions with strong allelic bias toward either of the parental alleles [e.g., around the IBM_Gnp2004 loci umc67a (bin 1.06), umc63a (bin 3.09), umc52 (bin 4.08–4.09), and umc1316 (bin 8.05) and around the LHRF_Gnp2004 loci umc1128 (bin 1.07–1.08), umc1057 (bin 3.02–3.03), bnl6.16a (bin 3.06–3.07), and umc1366 (bin 9.07)]. Bins 3.04, 4.04, and 6.05 are significantly distorted in both IBM_Gnp2004 and LHRF_Gnp2004 maps, but many other regions are distorted in a single population.
DISCUSSION
Contribution of cDNA mapping data to maize genetics studies:
Within this Genoplante mapping program, we produced numerous new candidate gene-derived linkage map positions that will provide a powerful resource for looking at colocalizations with QTL to discover new genes that control agriculturally important traits. To look at such colocalizations, a key point is to cumulate on a single consensus map cDNA loci mapped on IBM_Gnp2004 or LHRF_Gnp2004 and positions of QTL detected in other crosses. This can be straightforward by using the BioMercator software (Arcade et al. 2004), provided that the number of loci in common between maps is sufficient. Therefore, the 430 anonymous loci that we mapped within Genoplante were chosen among the markers most frequently found in the Genoplante QTL maps. The map scores of 165 additional loci from ISU and 817 from MMP further contributed to increase the number of loci in common between IBM_Gnp2004 and other maps. We also projected on our IBMconsensus_Gnp2004 map as many genes, cDNA loci, and anonymous marker loci as possible from public data available on MaizeGDB, so that this maize map contains >7000 loci (data available at http://genoplante-info.infobiogen.fr/GnpMap).
We used IBM as the main mapping panel and projected our LHRF_Gnp2004 data onto the IBMconsensus_Gnp2004 map, because IBM is the reference population used by the American Maize Mapping Project. There is no conflicting order of loci between IBM_Gnp2004 and IBM2 framework maps. So the loci that we mapped on IBM_Gnp2004 can be accurately placed on the public IBM2 map to compare their positions with most of the public markers and QTL available from MaizeGDB. As a consequence, our work will hopefully provide a significant contribution to increase the number of links between the maize physical and genetic maps developed by the public community. The availability of such links is to date the main bottleneck for the integration of maize linkage maps with the physical map (Gardiner et al. 2004).
Distribution of cDNA loci:
We observed an accumulation of cDNA loci near the centromere for seven chromosomes. This was expected, given the very low recombination rates often associated with centromeric regions (Tanksley et al. 1992; Wu et al. 2003), which lead to very short genetic distances even between physically distant loci. Under the hypothesis that genes or gene islands are evenly distributed along the DNA molecule in the chromosomes, the bimodal or multimodal distributions observed on chromosomes 1, 4, 6, and 10 might suggest recombination hotspots, for instance, ∼200 cM in chromosome 4.
Importance of the LHRF population:
The LHRF population was designed with the same genetic structure as IBM, to provide similar map resolution, but from different genetic origins, including in particular F2, a European flint line of key historical importance for hybrid maize production in Europe. Apart from IBM, LHRF is to our knowledge the only other maize IRIL population publicly available. This resource allowed us to map 30% more cDNAs than could be achieved with IBM alone. Some regions of IBM_Gnp2004 or LHRF_Gnp2004 maps show local expansions of the genetic distance compared to the other one (e.g., bins 2.06 and 2.07 expanded in LHRF_Gnp2004, bins 3.07 and 3.08 expanded in IBM_Gnp2004), which may be a consequence of local heterogeneities of marker density between both maps.
Bin-mapping approach:
Large-scale linkage mapping projects have to cope with the problem of mapping a high number of loci with a limited number of segregating plants, due to technical constraints. In this context, reliably ordering all loci is hopeless, and the bin-mapping approach is a relevant way to proceed. Each locus can then be assigned to an interval between framework loci with reasonable certainty. The loci already placed do not alter the placement of the subsequent ones, and all results refer to a stable reference framework map. It is easy to automate the process, which we did with the ActionMap software (Albini et al. 2003). A similar approach was chosen for the maize community mapping initiative within the MMP, by using another software to automatically place new loci on the map (http://www.maizemap.org/bioinformatics/CIMDE/CIMDE.html).
Comparison between RFLP and PCR mapping:
We observed 95% polymorphic probes by RFLP with five restriction enzymes, whereas only 76% of the sequenced genes displayed SNP or IDP polymorphisms between the same four lines. SNPs are more abundant than restriction site polymorphisms in the genome, but we investigated SNPs with PCR primers developed within the available EST sequence, which was usually shorter than the cDNA clone used in RFLP. Moreover, RFLP can reveal polymorphism even outside the region recognized by the probe. An advantage of RFLP is also that several genes displaying enough sequence similarity to the probe can be genotyped simultaneously. This can lead to mapping unknown genes, the functions of which are likely to be related to that of the initially targeted candidate gene. Looking for colocalizations between these genes and a QTL can obviously help for characterizing the QTL. However, once several loci are mapped with one RFLP probe, it is difficult to determine which locus corresponds to the known gene copy used as probe. In such cases, PCR-based methods like SNP or IDP mapping provide a much better link between one sequence and one locus, due to the higher specificity of PCR compared to Southern blot. Moreover, PCR-based techniques are now much easier to perform on a large scale.
IRILs and map length:
The sizes of our framework maps—computed with MapMaker as for RILs—are more than twice the usual length of maize linkage maps based on RILs, due to the intermated structure of the mapping panel. This is in accordance with previous observations on Arabidopsis thaliana (Liu et al. 1996) and maize (Beavis et al. 1992; Lee et al. 2002). However, the length of the IBM2 framework map from the MMP (see “Framework Mapscores for 94 lines” at http://www.maizemap.org/ibm2_frameworkmaps.htm) is 4922 cM, that is, 22% longer than our IBM_Gnp2004 framework map (4039 cM). Both maps were built from the same 94 IRILs and contain similar numbers of loci. Moreover, all mapping software and parameters were identical in both projects. On the basis of 72 common markers between these maps, we observed that the size expansion observed in the MMP IBM2 map is not limited to chromosome ends but distributed all along the chromosomes. Moreover, close rates of size expansion (22 and 17%, respectively) were observed (1) for the whole map and (2) within all map segments delimited by common markers and representing true linkage groups on both maps (with threshold LOD 3 and minimum distance 40 cM). The lower accuracy of distances calculated between loosely linked markers is therefore not responsible for the size difference observed. Genotyping errors can also be a factor for overestimated genetic distances. To get an idea of possible error rates, we compared the raw segregation data of 77 markers present in MMP and regenotyped in our laboratory (see list in supplementary Table S3). The proportion of discordant data between the data sets was 1.86%. Among 1000 simulations with 1.86% randomly simulated genotyping errors in our IBM_Gnp2004 framework data set, the consecutive map size expansion ranged between 10.5 and 20.8% with a mean of 15.3%. The effect of a low proportion of genotyping errors on map size expansion seems then to be rather drastic and might partly explain the size difference between IBM_Gnp2004 and MMP IBM2 maps. To get map length values directly comparable to other maize F2 or RIL maps, we calculated the CCD map sizes of the IBM_Gnp2004 (1825 cM), LHRF_Gnp2004 (1862 cM), and MMP IBM2 (2202 cM) framework maps. The longer size of IBM2 remains clear, but all three map sizes are consistent with usual lengths of maize linkage maps, such as 1500–2200 cM for four F2 maps (Beavis and Grant 1991), 1727 cM for an immortalized F2 map (Davis et al. 1999), or 1588–1869 cM for three RIL maps (Causse et al. 1996). The mean ratio between MapMaker and CCD map sizes (2.2) is consistent with our calculations of the relationship between both distances (Figure 3). As it can be easily derived from Winkler et al. (2003), this ratio approaches 2.0 at the zero limit and varies with the density of markers on the map.
Segregation distortion:
Both IBM and LHRF mapping panels revealed high rates of segregation distortion regions (SDRs) (Figure 1). Distortions toward either of the parental alleles were observed. There was no clear evidence for particularly distorted centromeric regions, unlike that reported by Sharopova et al. (2002). Most of the distorted loci were grouped in regions within which all loci are distorted toward the same allele. This is an indication that possible genotyping errors biasing toward one allele (e.g., missing data called as a valid absence of band) are not a main cause for segregation distortion in our data set. Sharopova et al. (2002) observed even higher rates (43%) with 983 loci (mainly SSRs) mapped on IBM, and Lee et al. (2002) and Lu et al. (2002) found also high proportions of distorted loci in nonfixed intermated maize populations from B73 × Mo17 and LH200 × LH216 crosses. In comparison, only 4–12% of the loci showed significantly distorted (P < 0.01) segregation ratios in three RIL panels (Causse et al. 1996) as well as 5–10% of the loci in two immortal F2 populations (Sharopova et al. 2002). Consistently, Xu et al. (1997) found more segregation distortion in RILs than in doubled-haploid, backcross, or F2 rice populations, and Lu et al. (2002) also stated that segregation distortion accumulates with additional generations of meiosis, which may be explained by the fact that more generations result in a stronger effect of selection.
Among 28 main SDRs described by Sharopova et al. (2002) on 277 IBM lines, 20 were significant in our IBM_Gnp2004 map. We observed one additional region strongly distorted toward the Mo17 allele at bin 2.09. This SDR is colocalized with one described under the name SDR2.3 by Lu et al. (2002). Bins 3.04, 4.04, and 6.05 show significant SDRs in both IBM_Gnp2004 and LHRF_Gnp2004 maps. In these regions, there might be segregating alleles conferring contrasted fitness values within both crosses and resulting in selection. Similar stacking of SDRs in different crosses was also reported by Lu et al. (2002). However, many SDRs observed on IBM_Gnp2004 do not correspond to SDRs in LHRF_Gnp2004. Similar situations were also observed by Lu et al. (2002) and may be explained by monomorphism at the locus under selection. In our case, it can also be a simple consequence of the lower number of cDNA loci mapped on LHRF_Gnp2004 compared to IBM_Gnp2004. Reciprocally, some SDRs observed on LHRF_Gnp2004 are not significantly distorted on IBM_Gnp2004. Most of them colocalize with SDRs previously described by Lu et al. (2002), for instance, on bins 1.02 (SDR1.1), 1.07 (SDR1.2), 2.02 (SDR2.1), and 4.10 (SDR4.2), or by Sharopova et al. (2002), for instance, on bin 9.07.
Future of cDNA mapping:
When maize genetic and physical maps are tightly enough integrated, it will be possible to infer accurate linkage map positions of new genes or markers by high-throughput physical assignment of the marker to a minimum tiling path of BAC clones by overgo hybridization or PCR on multidimensional pools. This might be easier than high-throughput linkage mapping. Further ahead, the complete sequence of the maize genome is now on the way, and in silico physical mapping will become more and more efficient.
Acknowledgments
We thank Denis Coubriche and Daniel Jolivot at Institut National de la Recherche Agronomique, Le Moulon, for their contribution to the development of the LHRF mapping panel; Martine Bangratz, Nolwen Dautrevaux, and Lisa Frances for their contribution to mapping; Delphine Madur, Chin Ky, Valérie Combes, and Laurence Moreau for their contribution to the selection of SSR markers to use on LHRF; Mathieu Mercy for contributing to the development of the AC-PCR method; Mike Lee for providing IBM seeds to Biogemma; Michaël Alaux, Guillaume Albini, Farid Chetouani, Emmanuelle Karsenty, Stéphane Rouillé, and Bruce Thomas for contributing to the database; as well as Dominique de Vienne, Domenica Manicacci, Christine Dillmann, Philippe Brabant, Rex Bernardo, and two anonymous reviewers for helpful comments on the manuscript. This work was funded by Genoplante, the French consortium for plant genomics (http://www.genoplante.com).
References
- Albini, G., M. Falque and J. Joets, 2003. ActionMap: a web-based software that automates loci assignments to framework maps. Nucleic Acids Res. 31: 3815–3818. [DOI] [PMC free article] [PubMed] [Google Scholar]
- Arcade, A., A. Labourdette, M. Falque, B. Mangin, F. Chardon et al., 2004. BioMercator: integrating genetic maps and QTL towards discovery of candidate genes. Bioinformatics 20: 2324–2326. [DOI] [PubMed] [Google Scholar]
- Beavis, W. D., and D. Grant, 1991. A linkage map based on information from 4 F2 populations of Maize (Zea mays L.). Theor. Appl. Genet. 82: 636–644. [DOI] [PubMed] [Google Scholar]
- Beavis, W. D., M. Lee, D. Grant, A. R. Hallauer, T. Owens et al., 1992. The influence of random mating on recombination among RFLP loci. Maize Newsl. 66: 52–53. [Google Scholar]
- Bernat, M., E. Titos and J. Claria, 2002. Rapid identification of single nucleotide polymorphisms by fluorescence-based capillary electrophoresis. Genet. Mol. Res. 1: 72–78. [PubMed] [Google Scholar]
- Bharti, A. K., F. Wei, E. Butler, Y. Yu, J. L. Goicoechea et al., 2004. High resolution physical mapping of the maize genome and sequencing a part thereof. Maize Genet. Conf. Abstr. 46: T20. [Google Scholar]
- Burr, B., F. Burr, K. H. Thompson, M. Albersten and C. W. Stuber, 1988. Gene mapping with recombinant inbreds in maize. Genetics 118: 519–526. [DOI] [PMC free article] [PubMed] [Google Scholar]
- Causse, M., S. Santoni, C. Damerval, A. Maurice, A. Charcosset et al., 1996. A composite map of expressed sequences in maize. Genome 39: 418–432. [DOI] [PubMed] [Google Scholar]
- Chandler, V. L., and V. Brendel, 2002. The maize genome sequencing project. Plant Physiol. 130: 1594–1597. [DOI] [PMC free article] [PubMed] [Google Scholar]
- Davis, D. W., K. C. Cone, P. Chomet, D. Cox, S. Brady et al., 2000 Maize whole-genome radiation hybrids: a progress report. Plant & Animal Genome VIII Conference, January 9–12, 2000, San Diego.
- Davis, G., E. Coe, Jr., O. Heredia-Diaz, T. Musket, S. Chao et al., 1994. Toward a consensus Maize map. Maize Genet. Conf. Abstr. 36: P27. [Google Scholar]
- Davis, G., M. McMullen, C. Baysdorfer, T. Musket, D. Grant et al., 1999. A maize map standard with sequenced core markers, grass genome reference points and 932 expressed sequence tagged sites (ESTs) in a 1736-locus map. Genetics 152: 1137–1172. [DOI] [PMC free article] [PubMed] [Google Scholar]
- Dear, P. H., and P. R. Cook, 1993. Happy mapping: linkage mapping using a physical analogue of meiosis. Nucleic Acids Res. 21: 13–20. [DOI] [PMC free article] [PubMed] [Google Scholar]
- Falque, M., 2005. IRILmap: linkage map distance correction for intermated recombinant inbred lines/advanced recombinant inbred strains. Bioinformatics (in press). [DOI] [PubMed]
- Falque, M., L. Décousset, A. Murigneux, N. Dautrevaux, D. Dervins et al., 2003. Large-scale maize cDNA mapping for candidate gene approach. Maize Genet. Conf. Abstr. 45: P116. [Google Scholar]
- Feinberg, A. P., and B. Vogelstein, 1983. A technique for radio-labeling DNA restriction endonuclease fragments to high specific activity. Anal. Biochem. 132: 6–13 [addendum: Anal. Biochem. 137: 266–267 (1984)]. [DOI] [PubMed] [Google Scholar]
- Gardiner, J. M., E. H. Coe, S. Melia-Hancock, D. A. Hoisington and S. Chao, 1993. Development of a core RFLP map in maize using an immortalized F2 population. Genetics 134: 917–930. [DOI] [PMC free article] [PubMed] [Google Scholar]
- Gardiner, J., S. Schroeder, M. L. Polacco, H. Sanchez-Villeda, Z. Fang et al., 2004. Anchoring 9,371 maize expressed sequence tagged unigenes to the bacterial artificial chromosome contig map by two-dimensional overgo hybridization. Plant Physiol. 134: 1317–1326. [DOI] [PMC free article] [PubMed] [Google Scholar]
- Haldane, J. B. S., 1919. The combination of linkage values and the calculation of distance between loci of linked factors. J. Genet. 8: 299–309. [Google Scholar]
- Haldane, J. B. S., and C. Waddington, 1931. Inbreeding and linkage. Genetics 16: 357–374. [DOI] [PMC free article] [PubMed] [Google Scholar]
- Lander, E. S., P. Green, J. Abrahamson, A. Barlow, M. J. Daly et al., 1987. MAPMAKER: an interactive computer package for constructing primary genetic linkage maps of experimental and natural populations. Genomics 2: 174–181. [DOI] [PubMed] [Google Scholar]
- Lee, M., N. Sharopova, W. D. Beavis, D. Grant, M. Katt et al., 2002. Expanding the genetic map of maize with the intermated B73 × Mo17 (IBM) population. Plant Mol. Biol. 48: 453–461. [DOI] [PubMed] [Google Scholar]
- Liu, S. C., S. P. Kowalski, T. H. Lan, K. A. Feldmann and A. Paterson, 1996. Genome-wide high-resolution mapping by recurrent intermating using Arabidopsis thaliana as a model. Genetics 142: 247–258. [DOI] [PMC free article] [PubMed] [Google Scholar]
- Lu, H., J. Romero-Severson and R. Bernardo, 2002. Chromosomal regions associated with segregation distortion in maize. Theor. Appl. Genet. 105: 622–628. [DOI] [PubMed] [Google Scholar]
- Murigneux, A., P. A. Lessard, J. P. Martinant, E. Huttner, M. Debrand et al., 2003. Isolation of genes controlling agronomic traits in maize. Maize Genet. Conf. Abstr. 45: P152. [Google Scholar]
- Okagaki, R. J., R. G. Kynast, S. M. Livingston, C. D. Russell, H. W. Rines et al., 2001. Mapping maize sequences to chromosomes using oat-maize chromosome addition materials. Plant Physiol. 125: 1228–1235. [DOI] [PMC free article] [PubMed] [Google Scholar]
- Orita, M., H. Iwahana, H. Kanazawa, H. Kanazawa, K. Hayashi et al., 1989. Detection of polymorphisms of human DNA by gel electrophoresis as single-strand conformation polymorphisms. Proc. Natl. Acad. Sci. USA 86: 2766–2770. [DOI] [PMC free article] [PubMed] [Google Scholar]
- Reed, K. C., and D. A. Mann, 1985. Rapid transfer of DNA from agarose gels to nylon membranes. Nucleic Acids Res. 13: 7207–7221. [DOI] [PMC free article] [PubMed] [Google Scholar]
- Rogers, S. O., and A. J. Bendich, 1985. Extraction of DNA from milligram amounts of fresh, herbarium and mummified plant tissues. Plant Mol. Biol. 5: 69–76. [DOI] [PubMed] [Google Scholar]
- Samson, D., F. Legeai, E. Karsenty, S. Reboux, J. B. Veyrieras et al., 2003. GénoPlante-Info (GPI): a collection of databases and bioinformatics resources for plant genomics. Nucleic Acids Res. 31: 179–182. [DOI] [PMC free article] [PubMed] [Google Scholar]
- Sharopova, N., M. D. McMullen, L. Schultz, S. Schroeder, H. Sanchez-Villeda et al., 2002. Development and mapping of SSR markers for maize. Plant Mol. Biol. 48: 463–481. [DOI] [PubMed] [Google Scholar]
- Tanksley, S. D., M. W. Ganal, J. P. Prince, M. C. de Vicente, M. W. Bonierbale et al., 1992. High density molecular linkage maps of the tomato and potato genomes. Genetics 132: 1141–1160. [DOI] [PMC free article] [PubMed] [Google Scholar]
- Thareau, V., P. Déhais, C. Serizet, P. Hilson, P. Rouzé et al., 2003. Automatic design of gene-specific sequence tags for genome-wide functional studies. Bioinformatics 19: 2191–2198. [DOI] [PubMed] [Google Scholar]
- Wei, F., W. Nelson, J. L. Goicoechea, F. Engler, S. A. Lee et al., 2004. An integrated genetic and physical map of the maize genome. Maize Genet. Conf. Abstr. 46: 125. [Google Scholar]
- Wen, T., F. Qiu, L. Guo, M. Lee, K. Russell et al., 2002. High-throughput mapping tools for maize genomics. Maize Genet. Conf. Abstr. 44: P8. [Google Scholar]
- Winkler, C. R., N. M. Jensen, M. Cooper, D. W. Podlich and O. S. Smith, 2003. On the determination of recombination rates in intermated recombinant inbred populations. Genetics 164: 741–745. [DOI] [PMC free article] [PubMed] [Google Scholar]
- Wu, J., H. Mizuno, M. Hayashi-Tsugane, Y. Ito, Y. Chiden et al., 2003. Physical maps and recombination frequency of six rice chromosomes. Plant J. 36: 720–730. [DOI] [PubMed] [Google Scholar]
- Xu, Y., L. Zhu, J. Xiao, N. Huang and S. R. McCouch, 1997. Chromosomal regions associated with segregation distortion of molecular markers in F2, backcross, doubled-haploid, and recombinant inbred populations in rice (Oryza sativa L.). Mol. Gen. Genet. 253: 535–545. [DOI] [PubMed] [Google Scholar]