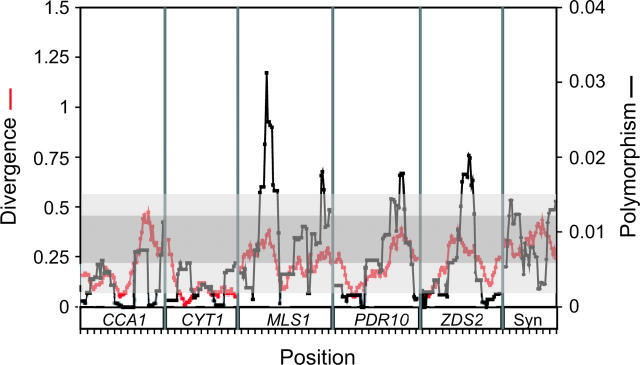
Figure 3.—
Sliding window of polymorphism compared to divergence for noncoding and synonymous sites. Divergence (red) is between S. cerevisiae and S. paradoxus as measured by the Jukes-Cantor model (Jukes and Cantor 1969), and polymorphism (black) is measured by diversity among strains without missing data. The range of synonymous-site divergence (gray) and polymorphism (light gray) is shown as shaded regions. The plot is separated into six regions labeled below the abscissa. The first five regions are from the noncoding sequences 5′ of each gene. The last region (Syn) is the concatenation of fourfold degenerate synonymous sites from the coding sequences of all five genes.

