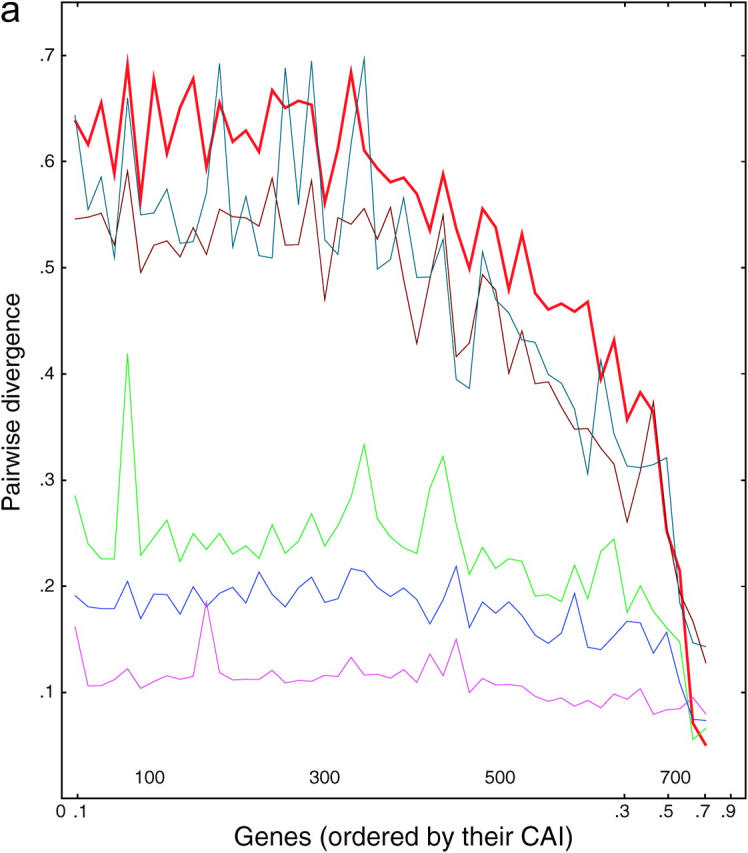
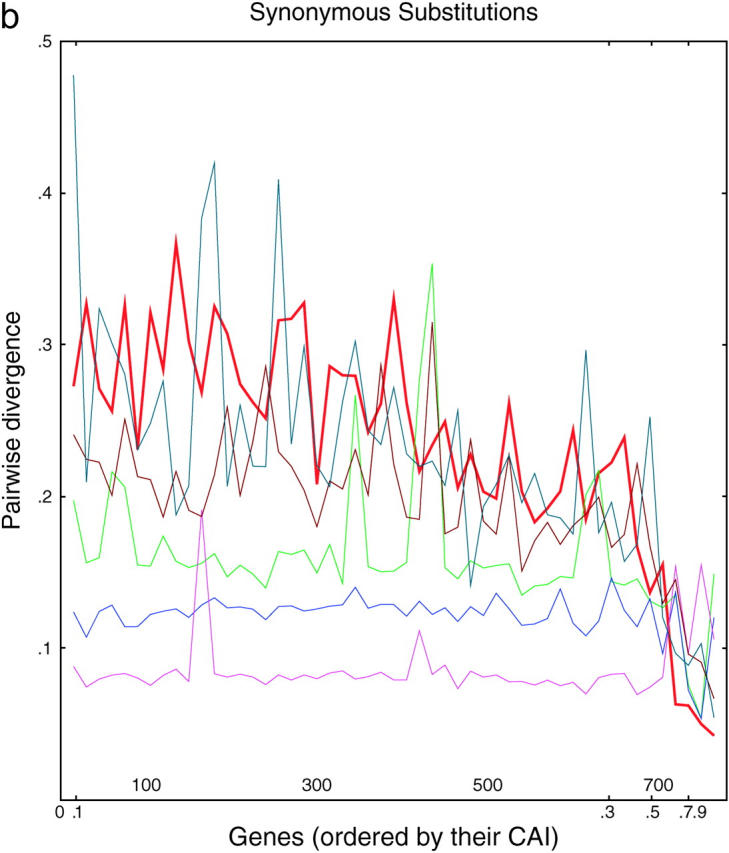
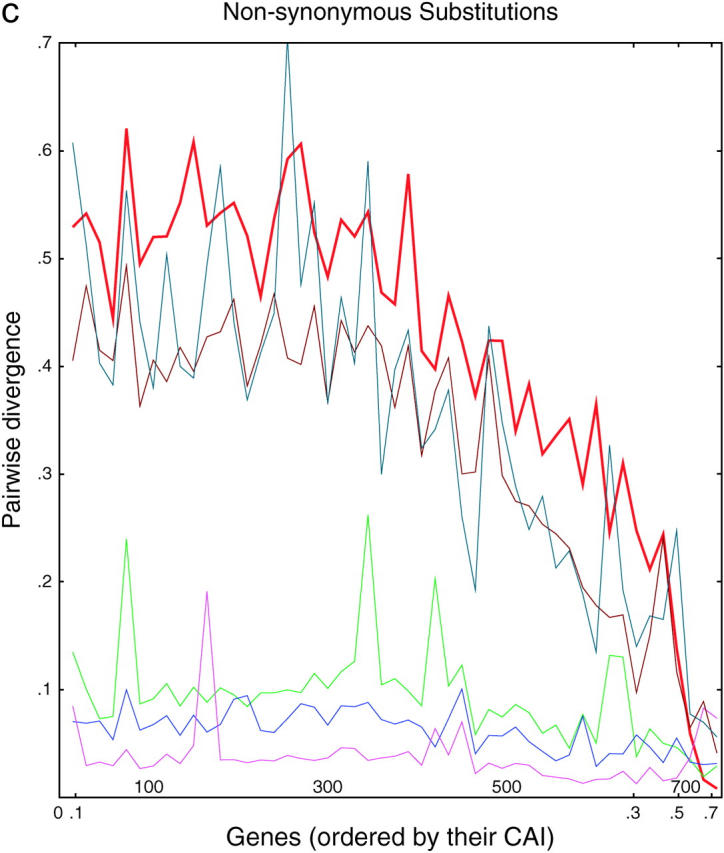
Figure 3.—


Divergence as a function of expression in six yeasts. (a) Each of 764 ancient duplicated genes in S. cerevisiae is compared to its closest homolog in S. cerevisiae (intraspecies comparison) or to its closest homolog in another species of Saccharomyces (interspecies comparisons). From top to bottom, on the left side of the graph, the lines are S. kluyveri (thin line, blue-green), S. cerevisiae (thick line, red), S. castellii (brown), S. bayanus (green), S. mikatae (blue), and S. paradoxus (purple). Divergence scores were calculated (materials and methods) for each pairwise comparison and plotted on the y-axis. Along the x-axis, the genes are sorted from left to right in the increasing order of the CAI of the chosen cerevisiae gene. Divergence scores were averaged over consecutive disjoint sets of 15 genes each to smooth the curves. The number of genes plotted in each curve varies from 752 to 758, depending on the existence/availability of interspecies homologs, whether the Jukes-Cantor score is defined, etc. b and c are the same as a, but are confined to synonymous and nonsynonymous substitutions, respectively.
