Figure 2.—
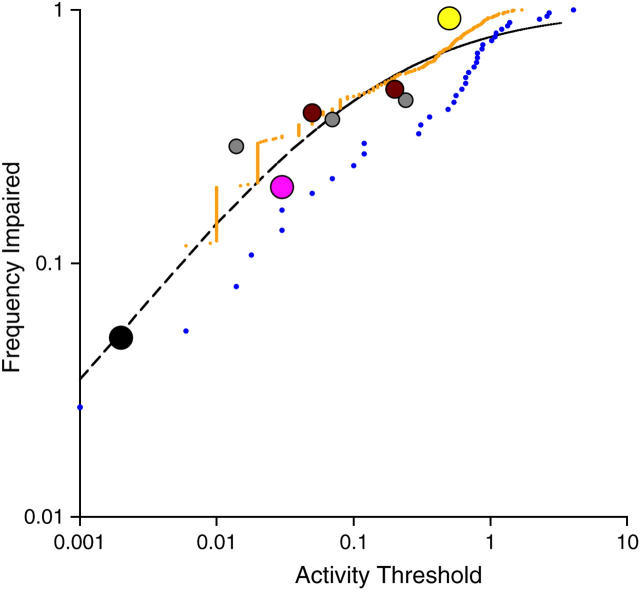
Empirical severity-of-effect distribution. The observed frequency of amino acid exchange variants pT that fall below some threshold of activity T is shown as a function of the threshold, on a double-log scale. Data on this relationship are available from seven studies (for details, see supplementary materials at http://www.genetics.org/supplemental/): the lysozyme (pink dot), barnase (black dot), and β-lactamase (yellow dot) studies each contribute a single point; two points are available from the interleukin-3 study (brown dots); three points from the LacI study (gray dots); and the observed discretized frequency distribution is available for 37 insulin variants (blue dots) and 366 HIV-RT variants (orange dots). The sizes of dots represent weights assigned to each point for purposes of regression. The dashed line is the best fit (residual sum-of-squares, 0.13) to a cumulative frequency distribution based on the power law (Equation 1).

