

Abstract
Understanding the genetic architecture of traits such as growth, body composition, and energy balance has become a primary focus for biomedical and agricultural research. The objective of this study was to map QTL in a large F2 (n = 1181) population resulting from an intercross between the M16 and ICR lines of mice. The M16 line, developed by long-term selection for 3- to 6-week weight gain, is larger, heavier, fatter, hyperphagic, and diabetic relative to its randomly selected control line of ICR origin. The F2 population was phenotyped for growth and energy intake at weekly intervals from 4 to 8 weeks of age and for body composition and plasma levels of insulin, leptin, TNFα, IL6, and glucose at 8 weeks and was genotyped for 80 microsatellite markers. Since the F2 was a cross between a selection line and its unselected control, the QTL identified likely represent genes that contributed to direct and correlated responses to long-term selection for rapid growth rate. Across all traits measured, 95 QTL were identified, likely representing 19 unique regions on 13 chromosomes. Four chromosomes (2, 6, 11, and 17) harbored loci contributing disproportionately to selection response. Several QTL demonstrating differential regulation of regional adipose deposition and age-dependent regulation of growth and energy consumption were identified.
TO better understand animal growth, much research has been conducted to test the theoretical basis of quantitative genetics using long-term selective breeding strategies in rodents over the last half of the twentieth century (Eisen 1989). Selection for growth in mice almost always results in increased energy intake, enhanced efficiency of energy conversion, and heightened fat deposition (Eisen 1989; Bunger et al. 2001). These selection experiments also resulted in a wealth of unique populations of mice (e.g., Bunger et al. 2001) that are very useful for exploring the genetic architecture of complex trait predisposition (Pomp et al. 2004) and the nature of selection response (Eisen 2005).
Many studies have been conducted to identify QTL for growth and body composition in mice, and several of these utilized long-term selection lines (see reviews by Corva and Medrano 2001, Brockmann and Bevova 2002, and Pomp et al. 2004). However, only a few of these experiments have involved crosses between a long-term selection line and its randomly selected control line (Brockmann et al. 1998) or between lines divergently selected from a common base population (Moody et al. 1999; Horvat et al. 2000). Such crosses are required to differentiate the subset of QTL that have contributed to selection response for complex traits from among those that segregate in the multitude of inbred lines used in genetical research. Recent QTL-based analyses of selection response have been reported for maize (Laurie et al. 2004), Arabidopsis (Ungerer and Rieseberg 2003), and Drosophila (Valenzuela et al. 2004).
Despite the significant emphasis placed on QTL detection for growth and body composition in mice, and the fact that energy intake is a major determining factor in these phenotypes, identification of chromosomal regions harboring QTL for energy intake has proven to be elusive. Smith Richards et al. (2002) found two QTL for total intake adjusted to body weight, measured at ∼10 weeks of age, on MMU17 and MMU18. Moody et al. (1999) detected no QTL for feed intake measured from 12 to 14 weeks of age when evaluating selected chromosome regions where QTL for heat loss had been identified in a large mapping population of mice. The relative lack of information on loci contributing to genetic variation for energy consumption is a major gap in our knowledge of the control of energy balance.
This study focuses on the discovery of QTL accounting for phenotypic differences resulting from direct and correlated responses to 27 generations of selection for 3- to 6-week weight gain in mice. Selection was done within full-sib families from a base population of outbred Institute of Cancer Research (ICR) stock (Eisen 1975), resulting in the selection line designated as M16. In brief, long-term selection for rapid weight gain resulted in M16 mice that are larger than ICR mice at all ages measured (birth to 30 weeks) (Eisen 1975; Eisen et al. 1978; Robeson et al. 1981). Correlated responses include hyperphagia with improved feed efficiency (Eisen et al. 1978; Eisen and Leatherwood 1978) and increased fat, lean, and ash weights (Eisen et al. 1977). Recently, extensive recharacterization of many previously recorded phenotypes and measurement of several new phenotypes were completed using the M16 and ICR lines (Allan et al. 2004).
A fully inbred line (M16i) derived from M16 has been used in two previous QTL mapping experiments. A backcross population using M16i crossed with Mus musculus castaneous was measured for body weight at various ages and evaluated for body composition and skeletal development at 12 weeks. Evidence for QTL was found for all traits measured, with an extremely large effect on body weight and fatness on MMU2 (Pomp 1997; Leamy et al. 2000, 2002). A second, very large population was established using an F2 intercross between M16i and the L6 line, which was selected for low 6-week weight gain from a base population developed by crossing four standard inbred lines. Numerous QTL were detected for growth, adiposity, and reproduction with large effects also found on the distal end of MMU2 (Rocha et al. 2004a,b,c). While both of these experiments were highly successful in QTL identification, the M16i line represents only a single sampling (family) from the M16 selection line, and it is also not possible to differentiate QTL effects originating from M16i alleles relative to alleles from the castaneous and/or L6 lines used in the crosses.
In the present study, the M16 line was crossed to its randomly selected ICR control line to create a very large F2 intercross population. By localizing QTL for a wide variety of traits related to growth and adiposity, a primary objective was to identify chromosomal regions harboring genetic variation that specifically contributed to the extensive direct and correlated phenotypic responses to 27 generations of selection for rapid weight gain. By measuring weekly feed intake during the growth phase in nearly 1200 individual F2 mice, a secondary objective was to provide sufficient power to yield a detailed map of QTL regulating energy consumption. And finally, a third objective was to begin to integrate large-scale endo-phenotyping into QTL analysis for growth and body composition to combine the powers of functional and recombination analyses (Schadt et al. 2003; Pomp et al. 2004). While the major undertaking of high-throughput evaluation of mRNA and proteomic phenotypes in the M16 × ICR F2 intercross is in progress, we demonstrate the utility of this population using obesity-relevant measurements of plasma proteins (insulin, leptin, TNFα, IL6) and a metabolite (glucose).
MATERIALS AND METHODS
Resource population:
Selection leading to the present M16 line was originally conducted in two replicate lines (M16-1 and M16-2; Hanrahan et al. 1973). Each replicate consisted of 16 pair matings/generation, and the mean effective population size realized was 41. Through the first 14 generations of selection, the regression of response on the cumulative selection differential was 0.38 and 0.31 in replicates 1 and 2, respectively, and there was no significant nonlinearity (Hanrahan et al. 1973; Eisen 1975). However, from generations 15 to 27 of selection, the response declined sharply. The realized heritability in the second phase of selection was only about one-third that of the first phase—0.10 and 0.12 in M16-1 and M16-2, respectively (Eisen 1975). Replicate direct responses, realized heritabilities, and correlated responses were homogeneous across the 27 generations of selection. The two replicates were subsequently crossed to form the present M16 line, which was maintained (along with the control line ICR) by within-family random selection for ∼100 generations prior to establishment of the QTL mapping population used in this study.
A large F2 population (n = 1181) was established by intercrossing the M16 and ICR lines (for a recent description of relevant phenotypes in the parental lines, see Allan et al. 2004). Twelve F1 families resulted from six pair matings of M16 males × ICR females and six pair matings of the reciprocal cross. A total of 55 F1 dams were mated to 11 F1 sires in sets of five F1 full sisters mated to the same F1 sire. These same specific matings were repeated in three consecutive replicates. Thus, the F2 population consisted of ∼55 full-sib families of up to 24 individuals each and 113/4-sib families of up to 120 individuals each. Actual numbers of mice within families varied slightly due to a small number of failed pregnancies. All litters were standardized at birth to eight pups, with approximately equal representation of males and females.
Mouse care and maintenance:
All litters were weaned at 3 weeks of age, with mice placed in plastic cages with wood chip bedding and provided ad libitum access to water and pellet feed (Teklad 8604 rodent chow). Mice were caged individually from 4 to 8 weeks of age. Laboratory temperature was maintained at 22°, with relative humidity at 35–50% and a light:dark cycle of 12:12 hr starting at 7:00 a.m. The University of Nebraska Institutional Animal Care and Use Committee approved all procedures and protocols.
Phenotypic data collection:
Body weights were measured at weekly intervals from 3 to 8 weeks of age (3WK, 4WK, 5WK, 6WK, 7WK, 8WK). From 4 to 8 weeks of age, feed intake was recorded for all F2 mice at weekly intervals (FI5, FI6, FI7, FI8). Although food spillage (any evidence of portions of the brown pellet feed present in the wood chip bedding) was marginal, data were discarded for the mice (<10%) that spilled their food. At 8 weeks of age, following a period of 1.5 hr where feed was removed but access to water remained, mice were decapitated after brief exposure to CO2. Blood was collected from the trunk, and blood glucose (GLUC) was measured using the SureStep Blood Glucose Monitoring System (LifeScan Canada, Burnaby, British Columbia, Canada). The entire body except the head (i.e., the subcranial region) was scanned in a consistent, dorsal position using a dual-energy X-ray absorption (DEXA) densitometer (PIXImus, Lunar, Madison, WI). The DEXA measurements estimated two primary body composition characters in each mouse: total subcranial tissue mass (TTM, in grams) and total subcranial fat (FAT, in grams). After scanning, each carcass was dissected and weights of liver (LIV), right hind limb subcutaneous adipose depot (SCF), and right epididymal (males) or perimetrial (females) adipose depot (EPF) were recorded. These and other tissues, including hypothalamus, pituitary, gastrocnemius muscle, heart, spleen, kidney, (with adrenal) and tails, were collected and snap frozen in LN2.
Analysis of plasma proteins:
All F2 males were measured for plasma levels of insulin (INS), leptin (LEP), tumor necrosis factor α (TNFα), and interleukin 6 (IL6) using a single multiplex reaction (run in duplicate) based on microsphere bead technology (Linco, St. Louis). These proteins were selected for measurement on the basis of a previous evaluation of the M16 and ICR parental lines (Allan et al. 2004). Assays were run according to the manufacturer's instructions using a Luminex100 system (Luminex, Austin, TX). Raw data were processed using Masterplex QT (Miraibio, Alameda, CA); plate-to-plate variation was normalized using a standard sample on all plates.
Genotyping:
DNA was extracted from tails using a protocol originally described for toe clips (Pomp and Murray 1991). All 24 grandparents were prescreened for marker informativeness across ∼700 genome-wide microsatellite markers. Using the SAS program developed by Rocha et al. (2001), markers were selected for use in the full population on the basis of maximizing informativeness in the actual F0 matings and being as evenly spaced across the genome as possible.
Genotypes were collected for 80 microsatellite markers spaced at an ∼20-cM average distance across 19 autosomes for all founder, F1, and F2 animals. Descriptive and map information for all markers can be found in the appendix. The X chromosome was not included in the genome scan due to lack of informative markers between the parental lines (35 markers tested); we speculate that this may be due to homozygosity of large genomic regions in the ICR base population before selection of the M16 line had taken place. Genotypes were assayed using PCR with forward primers containing 19-mer 5′ tails end-labeled with one of two infrared dyes (IRD700 or IRD800), followed by electrophoresis and analysis on the LI-COR 4200 DNA Analysis System (LI-COR, Lincoln, NE). Gel images were analyzed using Gene ImageIR (Scanalytics, Fairfax, VA) to determine genotypes for each individual.
Markers were evaluated for allele scoring errors on the basis of evaluation of Mendelian inheritance. All specific genotyping discrepancies were cross-referenced with the original gels and either corrected or omitted from the study. Markers were evaluated for segregation distortion in the F2 population using chi-square tests. Chromosomal linkage maps were built using Cri-Map (Green and Crooks 1990) and reported in Kosambi centimorgans. Marker order was verified using the whole mouse genome sequence (http://www.ensembl.org/Mus_musculus/).
Marker positions and orders derived from the linkage analysis of the data in this study (appendix) are in reasonable agreement with those from the Mouse Genome Database (MGD; http://www/informatics.jax.org) and the whole mouse genome sequence (Ensembl Genome Browser; http://www.ensembl.org/Mus_musculus/). Marker map positions estimated from the genotype data in this study were used in the subsequent QTL analyses. None of the markers used in this study deviated significantly from expected F2 Mendelian segregation ratios.
Data adjustment and analysis:
Data for LIV, EPF, and SCF were also expressed as a percentage of 8-week body weight (LIVP, EPFP, and SCFP, respectively). Percentage body fat (FATP) was defined as FAT expressed as a percentage of TTM. Body weight gain was defined as the difference between the ending weight and the starting weight for periods of 3–6 weeks (GAIN3–6) and 4–8 weeks (GAIN4–8). Weekly feed intakes were also adjusted for the body weight measured at the end of each weekly period (FI5A, FI6A, FI7A, FI8A). Weekly feed efficiency was defined as weight gain divided by total feed intake for each weekly period (FE5, FE6, FE7, FE8; e.g., FE5 = (5WK–4WK)/FI5). Total adjusted feed intake (FIA) and feed efficiency (FE) were calculated over the entire 4-week feeding period.
Basic statistics and trait distributions were calculated using the UNIVARIATE function in SAS (SAS 1990). Phenotypic correlations among dependent variables were adjusted for sex and replicate using the MANOVA procedures in SAS (SAS 1990). Correlations are reported for 16 of the 29 traits used in QTL analysis; traits selected for this analysis represented four primary categories of phenotypes, including growth, body composition, energy consumption, and blood metabolites.
Data for body weights, feed intakes, organ weights, body composition traits, and blood glucose were analyzed with a mixed model approach using the PROC MIXED procedures in SAS (Little et al. 1996). The model contained sire and dam nested within sire as random effects, replicate and sex as fixed effects, and all two-way interactions. Normalized data for insulin, leptin, TNFα, and IL6 were analyzed with no sex effect (or corresponding interactions) in the model.
Residuals generated from the mixed model for each trait were combined with marker genotypes and map information for discovery of QTL using the F2 regression analysis option of QTL Express (Seaton et al. 2002). The analysis involved three steps. First, a simple interval approach, using a single QTL model, was run. This step was followed by selection of QTL to be used as background genetic effects to increase the precision and accuracy of QTL discovered in the single QTL model, which is similar in nature to a composite interval mapping analysis (Zeng 1993, 1994). Selection of QTL for genetic background effects was done using a forward selection approach. Briefly, the QTL with the largest effect was added to the model as a cofactor and the analysis rerun. This procedure was repeated until no additional significant QTL were detected. The final step was to remove each QTL individually from the model and rerun the analysis with the background genetic effects, as suggested by Zeng (1993).
Analysis for two QTL in a region was done (QTL Express) for all QTL with large confidence intervals. Results of all such analyses were not significant (data not shown). To test for QTL × sex interaction effects, data were reanalyzed without preadjustment for gender and by fitting a QTL × sex interaction into the model. To evaluate whether QTL were fixed or still segregating in the parental lines, analyses were also performed within the 11-sib families for several regions where QTL were identified in the full population.
A previous study using the M16i line (Rocha et al. 2004a) showed that basing QTL analyses on residuals from models that preadjust data introduced a consistent 10–20% downward bias in estimates of most QTL effects. However, no such bias was found in this study; QTL effects (and LOD scores) were essentially unchanged between analyses based on residuals and those where effects were fitted within the QTL analysis itself (data not shown). We speculate that the lack of bias in the present analysis is due to the large and well-balanced sibships created in this F2 population structure.
The percentage variance explained by a QTL effect was calculated as follows: [(residual variance of the reduced model − residual variance of the full model)/residual variance of the reduced model] × 100. Confidence intervals were calculated for the position of the QTL using a bootstrapping resampling option (Visscher et al. 1996) in QTL Express (Seaton et al. 2002), with 1000 iterations for each chromosome.
Genome-wide significance thresholds from the regression analysis were established using permutation testing (Churchill and Doerge 1994). A total of 1000 permutations were conducted for a variety of traits, including 8WK, FATP, LIVP, INS, FE, and FIA. Due to the similarity of thresholds for all of these six traits, and for computational simplicity, we used their average value (LOD 3.3) to establish a standard 5% genome-wide significance threshold for all traits in the study. The same approach was used in previous studies (Rocha et al. 2004a,b) that involved a similarly large F2 population originating from a cross involving the M16i line. Since relatively limited QTL data exist for feed intake and for plasma levels of insulin, leptin, TNFα, and IL6, a 10% genome-wide significance level (LOD 2.9) was also used as suggestive evidence for QTL for these traits.
RESULTS
Descriptive statistics for the phenotypic traits measured in the F2 population are shown in Table 1. The extensive phenotypic divergence caused by long-term selection for rapid growth rate in the M16 line (Allan et al. 2004) led to a large degree of phenotypic variation generated in the M16 × ICR F2 population (Table 1). Phenotypic correlations (adjusted for effects of replicate and sex; Table 2) show that body weights at 6 and 8 weeks of age are moderately correlated with traits reflecting fatness and with plasma levels of insulin and leptin and are highly correlated with feed intake. Leptin showed stronger correlations with fat levels than did insulin, as would be expected, given that leptin is an endocrine product of adipose tissue.
TABLE 1.
Descriptive statistics for traits measured in the M16 × ICR F2 population
| Traita | Mean | SD | Range | Traita | Mean | SD | Range |
|---|---|---|---|---|---|---|---|
| 3WK | 18.80 | 2.15 | 11.74–25.88 | FAT | 6.09 | 2.29 | 1.89–20.7 |
| 4WK | 28.82 | 3.91 | 16.05–39.22 | FATP | 17.05 | 4.20 | 7.20–38.20 |
| 5WK | 33.99 | 5.13 | 19.75–46.02 | FI | 187.20 | 20.41 | 122–244 |
| 6WK | 36.43 | 5.42 | 22.02–50.41 | FIA | 1.32 | 0.12 | 0.23–1.72 |
| 7WK | 37.26 | 5.77 | 22.54–54.27 | FIA5 | 1.46 | 0.14 | 0.76–2.47 |
| 8WK | 38.81 | 6.00 | 23.36–57.24 | FIA7 | 1.27 | 0.15 | 0.67–1.82 |
| GAIN3–6 | 17.78 | 5.44 | 2.52–41.67 | FIA8 | 1.19 | 0.16 | 0.53–2.06 |
| GAIN4–8 | 9.91 | 4.38 | −4.05–26.66 | FE | 0.049 | 0.019 | 0.002–0.134 |
| TTM | 34.79 | 6.19 | 20.83–56.96 | FE5 | 0.09 | 0.06 | −0.15–0.36 |
| LIV | 2.26 | 0.51 | 1.10–4.83 | GLUC | 144.23 | 34.02 | 65–292 |
| LIVP | 5.82 | 0.61 | 3.99–8.82 | INSb | 267.79 | 150.11 | 43.34–802.00 |
| SCF | 0.23 | 0.08 | 0.06–0.72 | LEPb | 119.47 | 85.71 | 15.48–560.92 |
| SCFP | 0.60 | 0.18 | 0.22–1.45 | TNFαb | 64.69 | 14.65 | 46.37–367.17 |
| EPF | 0.47 | 0.23 | 0.03–2.28 | IL6b | 10.93 | 7.34 | 2.58–94.33 |
| EPFP | 1.18 | 0.48 | 0.10–3.87 |
Traits measured include body weight (in grams) at ages 3, 4, 5, 6, 7, and 8 weeks (3WK–8WK), body weight gain between 3 and 6 weeks and between 4 and 8 weeks of age (GAIN3–6 and GAIN4–8), TTM (g), liver weight (g), LIVP, SCF (g), SCFP, right epididymal (males) or perimetrial (females) EPF (g), EPFP, FAT (g), FATP, FI (g), FIA, feed intake adjusted for body weight for specific weekly time periods (FI5A, FI7A, FI8A), FE, feed efficiency for a specific weekly time period (FE5), GLUC (mg/dl), INS (pmol/ml), LEP (pmol/ml), TNFα (pg/ml), and IL6 (pg/ml).
Measured only in males.
TABLE 2.
Phenotypic correlation matrix for the M16 × ICR F2 population
| Traita | GLUC | EPFP | SCFP | FATP | LIVP | 3WK | 6WK | 8WK | GAIN3–6 | FI | FIA | FE | INSb | LEPb | TNFαb | IL6b |
|---|---|---|---|---|---|---|---|---|---|---|---|---|---|---|---|---|
| GLUC | 1.0 | 0.20 | 0.04NS | 0.20 | 0.43 | −0.13 | 0.19 | 0.27 | 0.25 | 0.10NS | −0.18 | 0.44 | 0.21 | 0.13 | 0.02NS | −0.01 |
| EPFP | 1.0 | 0.65 | 0.81 | 0.08NS | 0.06NS | 0.47 | 0.49 | 0.43 | 0.34 | −0.23 | 0.40 | 0.39 | 0.58 | 0.01NS | 0.10 | |
| SCFP | 1.0 | 0.72 | 0.05NS | −0.02NS | 0.20 | 0.22 | 0.17 | 0.15 | −0.07NS | 0.16 | 0.25 | 0.63 | −0.01NS | 0.07 | ||
| FATP | 1.0 | 0.04NS | −0.02NS | 0.43 | 0.48 | 0.44 | 0.33 | −0.23 | 0.42 | 0.35 | 0.63 | 0.05NS | 0.12 | |||
| LIVP | 1.0 | −0.21 | 0.18 | 0.24 | 0.29 | 0.24 | 0.01NS | 0.37 | 0.24 | 0.14 | 0.04NS | 0.26 | ||||
| 3WK | 1.0 | 0.24 | 0.28 | −0.31 | 0.14 | −0.23 | −0.32 | 0.08NS | 0.06 | −0.03NS | −0.02 | |||||
| 6WK | 1.0 | 0.82 | 0.85 | 0.72 | −0.39 | 0.35 | 0.32 | 0.34 | −0.02NS | 0.17 | ||||||
| 8WK | 1.0 | 0.65 | 0.70 | −0.37 | 0.59 | 0.39 | 0.43 | 0.01NS | 0.13 | |||||||
| GAIN3–6 | 1.0 | 0.63 | −0.25 | 0.52 | 0.27 | 0.30 | −0.01NS | 0.25 | ||||||||
| FI | 1.0 | 0.27 | 0.24 | 0.32 | 0.29 | 0.01NS | 0.14 | |||||||||
| FIA | 1.0 | −0.28 | −0.10NS | −0.15 | 0.03NS | −0.05NS | ||||||||||
| FE | 1.0 | 0.20 | 0.31 | 0.02NS | 0.17 | |||||||||||
| INSb | 1.0 | 0.52 | 0.01NS | 0.01NS | ||||||||||||
| LEPb | 1.0 | 0.26 | 0.12 | |||||||||||||
| TNFαb | 1.0 | 0.04NS | ||||||||||||||
| IL6b | 1.0 |
NS represents all correlations that were not significantly different (P < 0.01).
Blood glucose levels (GLUC), percentage epididymal/perimetrial adipose pads (EPFP), percentage subcutaneous adipose pad (SCFP), percentage overall body fat (FATP), percentage liver (LIVP), 3-week body weight (3WK), 6-week body weight (6WK), 8-week body weight (8WK), weight gain from 3 to 6 weeks of age (GAIN3–6), total feed intake (FI), total intake adjusted for body weight (FIA), feed efficiency (FE), insulin (INS), leptin (LEP), tumor necrosis factor α (TNFα), and interleukin 6 (IL6). All data adjusted for sex and replicate.
Correlations involving INS, LEP, TNFα, and IL6 were measured in males only.
A total of 39 significant (LOD >3.3) QTL were identified for body weight and growth traits measured in this study (Table 3). Using a distance of 15–20 cM to determine the independence of regions, and assuming pleiotropy for correlated traits, these QTL likely represent 14 unique loci on 10 chromosomes. Two QTL were found for 3WK, four each for 5WK, 6WK, GAIN3–6, and GAIN4–8, five each for 4WK and 8WK, and six for 7WK. To better evaluate overall growth, TTM was included in the analysis. A total of five QTL for TTM were found on chromosomes 2, 6, 8, 11, and 17, with LOD scores of 9.3, 4.2, 3.5, 10.0, and 7.4, respectively. The QTL with largest effects were found on chromosome 11 for 8WK, explaining 6.2% of the residual variance for the 8-week weight. A QTL on MMU2 for 8WK explained 4.7% of the residual variance with a LOD score of 11.8. All QTL for growth traits were additive with the M16 allele causing an increase in values, with the exceptions of 4WK on MMU14 and GAIN4–8 on MMU1 for which the M16 allele led to a decrease in value (Table 3). QTL affecting only early or late growth were observed on chromosomes 1, 7, 10, 13, 15, and 17, while QTL affecting growth across all ages studied were found on MMU2, MMU6, and MMU11 (Figure 1).
TABLE 3.
QTL for growth traits mapped in the M16 × ICR F2 population
| Chromosome | Traita | Position of QTL peak (cM)b |
C.I.c | Estimated position (Mb)d |
LOD | Additive effecte |
Dominance effectf |
% residual varianceg |
|---|---|---|---|---|---|---|---|---|
| 1 | 4WK | 19 | 19–109 | 34.2 | 3.3 | 0.09 ± 0.03 | 0.03 ± 0.04 | 1.2 |
| 1 | GAIN4–8 | 40 | 26–105 | 74.1 | 3.4 | −0.12 ± 0.03 | 0.05 ± 0.05 | 1.2 |
| 2 | 4WK | 66 | 55–102 | 98.9 | 4.9 | 0.12 ± 0.03 | 0.14 ± 0.05 | 1.8 |
| 2 | TTM | 83 | 77–85 | 125.5 | 9.3 | 0.19 ± 0.03 | 0.07 ± 0.07 | 3.8 |
| 2 | 8WK | 86 | 80–95 | 130.5 | 11.8 | 0.23 ± 0.03 | 0.11 ± 0.05 | 4.7 |
| 2 | 5WK | 88 | 77–94 | 133.8 | 5.4 | 0.14 ± 0.03 | 0.11 ± 0.05 | 2.1 |
| 2 | 7WK | 89 | 79–96 | 135.5 | 10.1 | 0.21 ± 0.04 | 0.13 ± 0.06 | 4.0 |
| 2 | GAIN4–8 | 90 | 83–101 | 137.2 | 6.7 | 0.21 ± 0.03 | 0.07 ± 0.06 | 2.7 |
| 2 | GAIN3–6 | 90 | 57–96 | 137.2 | 5.8 | 0.15 ± 0.03 | 0.11 ± 0.05 | 2.1 |
| 2 | 6WK | 90 | 74–97 | 137.2 | 8.7 | 0.19 ± 0.03 | 0.10 ± 0.06 | 3.4 |
| 2 | 3WK | 98 | 65–110 | 147.8 | 4.1 | 0.12 ± 0.03 | 0.14 ± 0.06 | 1.7 |
| 6 | GAIN3–6 | 19 | 19–57 | 43.6 | 5.0 | 0.11 ± 0.03 | 0.14 ± 0.04 | 1.8 |
| 6 | 6WK | 19 | 19–61 | 43.6 | 4.8 | 0.12 ± 0.03 | 0.18 ± 0.05 | 1.8 |
| 6 | 5WK | 20 | 19–62 | 46.0 | 5.0 | 0.12 ± 0.03 | 0.11 ± 0.04 | 1.9 |
| 6 | 4WK | 37 | 19–59 | 83.3 | 7.5 | 0.12 ± 0.03 | 0.06 ± 0.04 | 2.9 |
| 6 | TTM | 45 | 19–61 | 96.5 | 4.2 | 0.12 ± 0.03 | 0.07 ± 0.05 | 1.7 |
| 6 | 7WK | 45 | 19–59 | 96.5 | 7.5 | 0.17 ± 0.03 | 0.11 ± 0.05 | 2.9 |
| 6 | 8WK | 45 | 19–59 | 96.5 | 6.8 | 0.16 ± 0.03 | 0.10 ± 0.05 | 2.6 |
| 7 | 3WK | 47 | 8–66 | 99.8 | 3.6 | 0.11 ± 0.03 | 0.002 ± 0.04 | 1.3 |
| 8 | TTM | 1 | 1–35 | 5.0 | 3.5 | 0.12 ± 0.03 | 0.01 ± 0.05 | 1.3 |
| 8 | 7WK | 1 | 1–35 | 5.0 | 3.4 | 0.11 ± 0.03 | 0.04 ± 0.05 | 1.3 |
| 10 | 8WK | 8 | 2–30 | 14.2 | 4.9 | 0.12 ± 0.03 | −0.01 ± 0.05 | 1.9 |
| 10 | 7WK | 14 | 2–30 | 22.1 | 4.4 | 0.11 ± 0.03 | −0.04 ± 0.04 | 1.7 |
| 11 | 4WK | 29 | 13–76 | 45.5 | 3.3 | 0.11 ± 0.03 | 0.15 ± 0.07 | 1.2 |
| 11 | 6WK | 63 | 26–72 | 99.4 | 13.2 | 0.22 ± 0.03 | 0.06 ± 0.05 | 5.2 |
| 11 | GAIN3–6 | 64 | 51–72 | 100.2 | 12.9 | 0.20 ± 0.03 | 0.06 ± 0.04 | 4.8 |
| 11 | 5WK | 64 | 26–73 | 100.2 | 11.1 | 0.19 ± 0.03 | 0.05 ± 0.05 | 4.4 |
| 11 | 8WK | 64 | 30–72 | 100.2 | 15.6 | 0.23 ± 0.03 | 0.02 ± 0.05 | 6.2 |
| 11 | 7WK | 65 | 29–74 | 101.1 | 13.9 | 0.23 ± 0.03 | 0.07 ± 0.05 | 5.5 |
| 11 | TTM | 67 | 32–77 | 103.0 | 10.0 | 0.20 ± 0.03 | 0.005 ± 0.05 | 4.1 |
| 11 | GAIN4–8 | 67 | 51–77 | 103.0 | 11.2 | 0.25 ± 0.04 | 0.03 ± 0.05 | 4.4 |
| 13 | 5WK | 24 | 24–54 | 58.5 | 3.5 | 0.09 ± 0.02 | −0.03 ± 0.05 | 1.4 |
| 15 | 4WK | 49 | 29–49 | 87.9 | 5.1 | −0.12 ± 0.03 | −0.01 ± 0.07 | 1.9 |
| 17 | GAIN3–6 | 58 | 48–72 | 48.6 | 3.3 | 0.11 ± 0.02 | −0.006 ± 0.04 | 1.2 |
| 17 | GAIN4–8 | 59 | 17–67 | 49.7 | 3.6 | 0.14 ± 0.03 | −0.05 ± 0.05 | 1.3 |
| 17 | TTM | 61 | 19–69 | 51.9 | 7.4 | 0.16 ± 0.03 | −0.04 ± 0.05 | 3.0 |
| 17 | 6WK | 63 | 50–78 | 54.0 | 3.7 | 00.13 ± 0.03 | −0.04 ± 0.05 | 1.2 |
| 17 | 8WK | 65 | 55–71 | 56.3 | 5.1 | 0.15 ± 0.03 | −0.04 ± 0.05 | 1.9 |
| 17 | 7WK | 69 | 55–75 | 60.7 | 3.5 | 0.13 ± 0.03 | −0.04 ± 0.05 | 1.3 |
Body weight at ages 3, 4, 5, 6, 7, and 8 weeks (3WK–8WK), body weight gain between 3 and 6 weeks and between 4 and 8 weeks of age (GAIN3–6 and GAIN4–8) and total tissue mass (TTM).
Based on the QTL Express analysis.
95% confidence interval for QTL peak (in centimorgans).
Estimated relative to microsatellite megabase position on the Ensembl map.
In phenotypic SD units (± standard error). Positive values represent the increasing effect of the M16 allele.
In phenotypic SD units (± standard error) representing the heterozygous genotype in relation to the mean of the two homozygous genotypes.
Accounted for by the QTL effect.
Figure 1.—
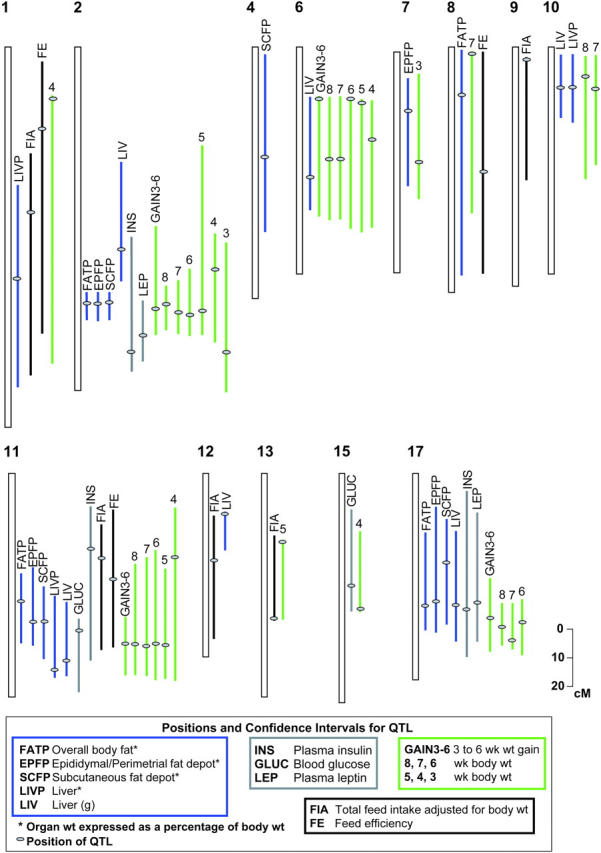
Genomic mapping of direct and correlated responses to long-term selection for 3- to 6-week weight gain in mice, representing 66 QTL identified in the M16 × ICR F2 cross. QTL not included in this figure were for fat traits expressed in grams, TTM, GAIN4–8, and weekly FIA. Colored lines represent confidence intervals for QTL according to trait. Gray dots on the colored lines show estimated positions of QTL peaks.
A total of 36 significant QTL influencing body composition, including fat and organ traits (Table 4), and likely representing 13 unique loci on 10 chromosomes, were found. Six QTL were found for LIV; five each for EPF, SCF, and FAT; four each for SCFP, EPFP, and FATP; and three for LIVP. Chromosome 2 appears to contribute to fat traits the most, explaining 7.0 and 8.1% of the residual variance for FATP and FAT, respectively. Effects of all QTL for adipose and organ traits were additive with the M16 allele associated with increased values, with the exception of a QTL on MMU07 for EPF and EPFP where the ICR allele leads to increased fat. Evidence for differential regulation of regional adipose accretion was found on the basis of a QTL on MMU7 for EPF and EPFP (Figure 2A) and a QTL on MMU04 for SCF and SCFP (Figure 2B).
TABLE 4.
QTL for body composition traits mapped in the M16 × ICR F2 population
| Chromosome | Traita | Position of QTL peak (cM)b | C.I.c | Estimated position (Mb)d |
LOD | Additive effecte |
Dominance effectf |
% residual varianceg |
|---|---|---|---|---|---|---|---|---|
| 1 | LIVP | 79 | 50–102 | 163.6 | 3.4 | 0.15 ± 0.03 | −0.002 ± 0.07 | 1.2 |
| 2 | LIV | 63 | 41–78 | 94.5 | 4.8 | 0.14 ± 0.04 | 0.04 ± 0.06 | 1.7 |
| 2 | SCFP | 83 | 80–89 | 125.5 | 12.1 | 0.33 ± 0.04 | 0.11 ± 0.06 | 4.8 |
| 2 | SCF | 83 | 81–89 | 125.5 | 17.3 | 0.38 ± 0.04 | 0.11 ± 0.06 | 8.7 |
| 2 | FATP | 84 | 82–92 | 127.2 | 16.8 | 0.33 ± 0.04 | 0.10 ± 0.06 | 7.0 |
| 2 | EPFP | 85 | 83–93 | 132.5 | 14.2 | 0.35 ± 0.04 | 0.08 ± 0.06 | 6.5 |
| 2 | FAT | 85 | 83–91 | 132.5 | 19.8 | 0.37 ± 0.03 | 0.12 ± 0.06 | 8.1 |
| 2 | EPF | 85 | 83–92 | 132.5 | 15.9 | 0.35 ± 0.04 | 0.09 ± 0.09 | 6.7 |
| 4 | SCFP | 41 | 2–62 | 78.0 | 4.6 | 0.17 ± 0.05 | 0.11 ± 0.25 | 1.8 |
| 4 | SCF | 46 | 0–67 | 86.9 | 3.9 | 0.63 ± 0.05 | 0.11 ± 0.11 | 1.4 |
| 6 | LIV | 52 | 19–55 | 108.2 | 6.6 | 0.16 ± 0.02 | −0.006 ± 0.04 | 2.4 |
| 6 | FAT | 55 | 19–71 | 112.4 | 4.1 | 0.15 ± 0.03 | 0.11 ± 0.06 | 1.7 |
| 6 | EPF | 57 | 19–70 | 115.2 | 3.5 | 0.13 ± 0.04 | 0.13 ± 0.04 | 1.5 |
| 6 | SCF | 75 | 44–83 | 137.2 | 4.6 | 0.25 ± 0.04 | −0.03 ± 0.08 | 1.1 |
| 7 | EPF | 23 | 8–65 | 33.5 | 3.6 | −0.13 ± 0.04 | 0.04 ± .017 | 1.2 |
| 7 | EPFP | 28 | 8–51 | 41.3 | 5.1 | −0.19 ± 0.04 | 0.02 ± 0.08 | 1.9 |
| 8 | FAT | 9 | 0–81 | 15.5 | 4.7 | 0.17 ± 0.04 | 0.02 ± 0.07 | 1.3 |
| 8 | FATP | 22 | 1–82 | 32.6 | 4.0 | 0.12 ± 0.03 | 0.11 ± 0.06 | 1.2 |
| 10 | LIVP | 13 | 2–26 | 28.2 | 4.4 | 0.15 ± 0.03 | 0.01 ± 0.06 | 1.6 |
| 10 | LIV | 13 | 2–22 | 28.2 | 8.5 | 0.18 ± 0.02 | −0.02 ± 0.04 | 3.1 |
| 11 | FATP | 51 | 36–65 | 82.1 | 5.2 | 0.17 ± 0.04 | 0.01 ± 0.06 | 1.8 |
| 11 | FAT | 56 | 34–68 | 91.0 | 9.8 | 0.23 ± 0.03 | 0.003 ± 0.06 | 3.4 |
| 11 | SCF | 57 | 42–60 | 92.8 | 7.4 | 0.25 ± 0.04 | −0.01 ± 0.06 | 2.9 |
| 11 | EPFP | 58 | 32–64 | 94.3 | 6.0 | 0.19 ± 0.04 | 0.002 ± 0.06 | 2.6 |
| 11 | SCFP | 58 | 41–75 | 94.3 | 3.6 | 0.17 ± 0.04 | −0.04 ± 0.06 | 1.5 |
| 11 | EPF | 58 | 31–65 | 94.3 | 8.8 | 0.22 ± 0.04 | 0.004 ± 0.04 | 3.2 |
| 11 | LIV | 66 | 58–78 | 102.1 | 14.7 | 0.026 ± 0.004 | 0.08 ± 0.06 | 5.5 |
| 11 | LIVP | 73 | 47–75 | 108.8 | 4.8 | 0.18 ± 0.03 | 0.13 ± 0.07 | 1.7 |
| 12 | LIV | 15 | 15–28 | 30.3 | 3.5 | 0.10 ± 0.02 | −0.08 ± 0.04 | 1.2 |
| 17 | SCFP | 38 | 18–57 | 28.2 | 5.1 | 0.22 ± 0.04 | −0.05 ± 0.11 | 2.0 |
| 17 | EPFP | 51 | 14–62 | 38.9 | 3.3 | 0.19 ± 0.04 | −0.08 ± 0.08 | 1.9 |
| 17 | EPF | 51 | 15–62 | 38.9 | 3.4 | 0.17 ± 0.03 | −0.09 ± 0.04 | 1.7 |
| 17 | FATP | 52 | 22–58 | 40.2 | 4.3 | 0.16 ± 0.04 | 0.10 ± 0.05 | 2.0 |
| 17 | SCF | 52 | 21–58 | 40.2 | 4.6 | 0.25 ± 0.04 | −0.08 ± 0.06 | 2.5 |
| 17 | FAT | 54 | 24–60 | 43.0 | 5.6 | 0.18 ± 0.03 | −0.08 ± 0.06 | 2.4 |
| 17 | LIV | 58 | 22–65 | 48.4 | 5.5 | 0.16 ± 0.02 | 0.02 ± 0.04 | 2.0 |
Liver weight (LIV), liver weight as a percentage at 8WK (LIVP), subcutaneous adipose pad weight (SCF), percentage subcutaneous adipose pad (SCFP), epididymal/perimetrial adipose pad weight (EPF), percentage epididymal/perimetrial adipose pad (EPFP), overall body fat (FAT), and percentage overall body fat (FATP).
Based on the QTL Express analysis.
95% confidence interval for QTL peak.
Relative to microsatellite megabase position on the Ensembl map.
In phenotypic SD units (± standard error). Positive values represent the increasing effect of the M16 allele.
In phenotypic SD units (± standard error), representing the heterozygous genotype in relation to the mean of the two homozygous genotypes.
Accounted for by the QTL effect.
Figure 2.—
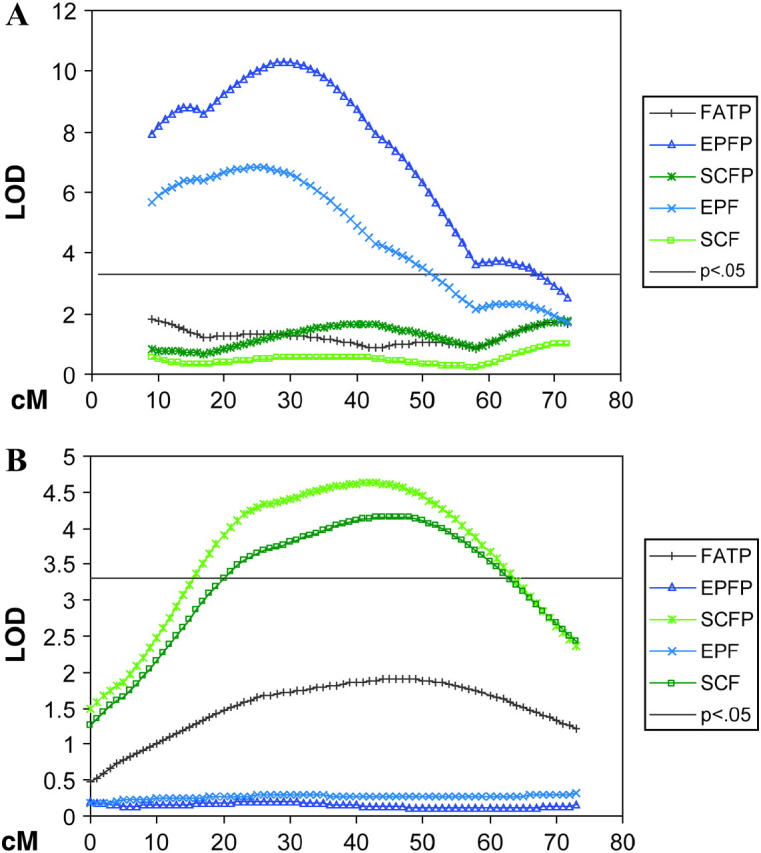
Chromosome maps for (A) MMU7 showing significant QTL for epididymal/perimetrial fat with lack of QTL for other fat traits and (B) MMU4 showing significant QTL for subcutaneous fat with lack of QTL for other fat traits. The x-axis represents the length of the chromosome in centimorgans. The y-axis is the LOD score with a 5% genome-wide threshold set at 3.3. Trait definitions can be found in Table 4.
Significant evidence was found for a total of 12 QTL affecting measures of energy intake (Table 5), likely representing nine unique loci on six chromosomes. Analysis of total intake adjusted for body weight (FIA) yielded five significant QTL, with the largest effect found on MMU11, explaining 4.7% of the residual variance. Three QTL were found for specific weekly intakes adjusted for body weight. The QTL on MMU11 for FI7A and FI8A appear to be at the same location as that found for FIA, likely representing effects of the same underlying gene(s). The QTL on MMU9 for FI5A is completely distal to the QTL for FIA, potentially representing age-specific regulation of feed intake (Figure 3). As expected, analysis of unadjusted feed intake data revealed only QTL in regions where QTL for growth were also identified (data not shown). We did see regions of the genome on chromosomes 4, 7, 10, 15, and 17 with QTL for growth/body composition/plasma metabolites and no QTL for FE, FI, or FIA. The region on MMU10 appears to be affecting only growth in regard to body and organ weight, while regions on chromosomes 4, 7, 15, and 17 appear to be affecting combinations of body composition, growth, and plasma metabolites (Figure 1). Four QTL, three significant and one suggestive, were found for feed efficiency; the QTL on MMU11 is additive and explains 3.0% of the residual variance for FE over the entire feeding period (Table 5). Two QTL for FE were identified for the first week of recorded energy intake (FE5). While the QTL Mfe5q2 and Mfeq1 potentially represent the same underlying gene, the presence of Mfe5q1 provides evidence for age-specific regulation of feed efficiency.
TABLE 5.
QTL for feed intake and feed efficiency mapped in the M16 × ICR F2 population
| Chromosome | Traita | Preliminary locus symbol for significant QTLb |
Position of QTL peak (cM)c |
C.I.d | Estimated position (Mb)e |
LOD | Additive effectf |
Dominance effectg |
% residual varianceh |
|---|---|---|---|---|---|---|---|---|---|
| 1 | FE | 21 | 1–90 | 38.2 | 2.9 | −0.16 ± 0.04 | 0.05 ± 0.05 | 1.8 | |
| 1 | FIA | Mfiq5 | 57 | 34–103 | 112.9 | 3.4 | 0.14 ± 0.04 | 0.12 ± 0.07 | 1.8 |
| 8 | FE5 | Mfe5q1 | 54 | 1–81 | 94.7 | 3.7 | −0.07 ± 0.05 | 0.17 ± 0.007 | 2.3 |
| 9 | FIA | Mfiq3 | 7 | 7–60 | 28.5 | 3.7 | −0.14 ± 0.05 | −0.16 ± 0.07 | 2.0 |
| 9 | FI5A | Mfi5q1 | 60 | 7–60 | 99.0 | 4.4 | −0.07 ± 0.04 | −0.14 ± 0.13 | 2.3 |
| 11 | FI7A | Mfi7q1 | 29 | 15–74 | 47.5 | 5.3 | −0.20 ± 0.05 | −0.20 ± 0.11 | 2.4 |
| 11 | FI8A | Mfi8q1 | 32 | 22–86 | 51.9 | 4.8 | −0.19 ± 0.05 | −0.06 ± 0.13 | 2.2 |
| 11 | FIA | Mfiq1 | 34 | 22–68 | 54.8 | 8.1 | −0.28 ± 0.05 | −0.21 ± 0.11 | 4.7 |
| 11 | FE5 | Mfe5q2 | 40 | 18–73 | 63.5 | 3.6 | 0.17 ± 0.05 | 0.02 ± 0.07 | 2.2 |
| 11 | FE | Mfeq1 | 50 | 18–73 | 80.3 | 4.9 | 0.21 ± 0.05 | 0.05 ± 0.11 | 3.0 |
| 12 | FIA | Mfiq4 | 35 | 17–63 | 60.6 | 3.7 | −0.09 ± 0.05 | −0.19 ± 0.07 | 2.0 |
| 13 | FIA | Mfiq2 | 54 | 26–54 | 107.5 | 4.4 | −0.12 ± 0.07 | 0.37 ± 0.14 | 2.4 |
Feed intake adjusted for body weight (FIA), feed intake adjusted for body weight for a specific weekly time period (FI5A, FI7A, FI8A), feed efficiency (FE), and feed efficiency for a specific time period (FE5).
Suggestive QTL were not assigned symbols.
Based on the QTL Express analysis.
95% confidence interval for QTL peak (in centimorgans).
Estimated relative to the microsatellite megabase position on the Ensembl map.
In phenotypic SD units (± standard error). Positive values represent the increasing effect of the M16 allele.
In phenotypic SD units (± standard error) representing the heterozygous genotype in relation to the mean of the two homozygous genotypes.
Accounted for by the QTL effect.
Figure 3.—

Chromosome map of MMU9 showing age-specific regulation of feed intake. The x-axis represents the length of the chromosome in centimorgans. The y-axis is the LOD score with a 5% genome-wide threshold set at 3.3. Trait definitions can be found in Table 5.
Several QTL for plasma hormone levels and blood glucose were identified (Table 6). Two QTL for GLUC were isolated to chromosomes 11 (significant) and 15 (suggestive). Both appear to be additive in nature with the M16 allele increasing glucose levels for the QTL on MMU11 and decreasing glucose levels for the QTL on MMU15. When the analysis of GLUC was run using only male data, to compare results with analyses for hormone levels, no significant QTL were detected; however, peaks were observed on chromosomes 1, 2, 10, and 11 with nonsignificant LOD scores of 2.1 to 2.4. Three significant QTL for leptin and three suggestive QTL for insulin were identified on chromosomes 2, 11, and 17 (Table 6). Evidence for QTL influencing both insulin and leptin were found in the same region on both MMU02 and MMU17. These regions are also consistent with QTL mapped for growth and fat.
TABLE 6.
QTL for plasma protein levels and blood glucose mapped in the M16 × ICR F2 population
| Chromosome | Traita | Preliminary locus symolb |
Position of QTL peak (cM)c |
C.I.d | Estimated position (Mb)e |
LOD | Additive effectf |
Dominance effectg |
% residual varianceh |
|---|---|---|---|---|---|---|---|---|---|
| 2 | LEP | Mlepq1 | 93 | 83–104 | 141.4 | 7.7 | 0.42 ± 0.07 | −0.05 ± 0.13 | 5.7 |
| 2 | LEPfg | Mlepfq1 | 93 | 82–101 | 141.4 | 3.7 | 0.25 ± 0.06 | −0.10 ± 0.11 | 2.8 |
| 2 | INS | 100 | 63–109 | 151.0 | 3.2 | 0.24 ± 0.07 | 0.21 ± 0.012 | 2.3 | |
| 11 | INS | 28 | 13–70 | 46.0 | 3.0 | 0.18 ± 0.07 | 0.39 ± 0.15 | 2.0 | |
| 11 | GLUC | Mglcq1 | 60 | 58–86 | 96.3 | 5.3 | 0.19 ± 0.04 | −0.02 ± 0.06 | 1.9 |
| 15 | GLUC | 42 | 14–49 | 78.1 | 3.1 | 0.14 ± 0.04 | 0.07 ± 0.06 | 1.1 | |
| 17 | LEP | Mlepq2 | 52 | 15–68 | 40.2 | 3.4 | 0.19 ± 0.05 | −0.16 ± 0.09 | 2.3 |
| 17 | INS | 55 | 7–72 | 44.3 | 2.9 | 0.16 ± .005 | −0.18 ± 0.009 | 1.9 |
Blood glucose (GLUC), plasma insulin (INS), plasma leptin (LEP), plasma leptin adjusted for fat (LEPfg), plasma tumor necrosis factor α (TNFα), and plasma interleukin 6 (IL6).
Suggestive QTL were not assigned symbols.
Based on the QTL Express analysis.
95% confidence interval for QTL peak (in centimorgans).
Estimated relative to microsatellite megabase position on the Ensembl map.
In phenotypic SD units (±standard error). Positive values represent increasing effect of the M16 allele.
In phenotypic SD units (±standard error) representing the heterozygous genotype in relation to the mean of the two homozygous genotypes.
Accounted for by the QTL effect.
QTL × sex interaction effects were analyzed for a sampling of traits including 8WK, GAIN3–6, and FAT, and no evidence for such interaction effects was detected (data not shown). However, QTL × sex interactions were prevalent for GLUC, a trait for which sexual dimorphism has previously been described in the M16 and ICR lines (Allan et al. 2004). These interaction effects were found on MMU1 (90 cM, LOD 3.6), MMU2 (82 cM, LOD 3.5), and MMU17 (16 cM, LOD 3.6).
Figure 1 summarizes the genomic mapping of direct and correlated responses to long-term selection for 3- to 6-week weight gain in mice, representing all QTL identified in the M16 × ICR F2 cross. The most extensive contributions to selection response were made by QTL on chromosomes 2, 6, 11, and 17, which yielded 72% of the 95 total QTL found in this study and 42% of the estimated 19 independent chromosomal regions harboring unique QTL. Moreover, these four chromosomes harbored all of the QTL found, representing a direct response to selection for 3- to 6-week weight gain. Extensive pleiotropy more than likely exists across the gamut of traits measured, although, on the basis of the locations of QTL peaks and confidence intervals, several chromosomal regions appear to harbor multiple QTL (Figures 4 and 5).
Figure 4.—

Chromosome maps for (A) MMU11 showing QTL curves for feed intake, percentage overall body fat, percentage gonadal/perimetrial adipose pad, percentage subcutaneous adipose pad, 3- to 6-week gain, and 8-week body weight and (B) MMU2 showing regions regulating fat and growth traits. The x-axis represents the length of the chromosome in centimorgans. The y-axis is the LOD score with a 5% genome-wide threshold set at 3.3. Trait definitions can be found in Tables 3–5.
Figure 5.—

Chromosome map of MMU17 showing two separate regions regulating fat and growth traits. The x-axis represents the length of the chromosome in centimorgans. The y-axis is the LOD score with a 5% genome-wide threshold set at 3.3. Trait definitions are in Tables 4 and 5.
Given the structured families created in the M16 × ICR F2 population, we were able to evaluate QTL within relatively large sibships to determine if QTL alleles were still segregating within the parental M16 and ICR animals. Results (not shown) indicate that detection of QTL and positions of detected QTL do vary across families, but this was found to be highly correlated with the level of informativeness of the DNA marker alleles within families. QTL effects were found in families with high marker informativeness, while detection was more transient in families with low marker informativeness. Genotyping of many additional and highly informative markers across the population is in progress and will enable a much more thorough evaluation of this issue.
DISCUSSION
By conducting a genome scan in a segregating F2 intercross between M16, a line that had undergone 27 generations of selection for increased 3- to 6-week weight gain, and ICR, a randomly selected control line for M16, we have attempted to map the genomic regions harboring loci that contributed to long-term direct and correlated responses to selection for murine growth. A large number of QTL were identified for various measures of body weight, feed intake, body composition, and endocrine status. The QTL representing direct response to selection were found on just four chromosomes, while those found for correlated responses were for the most part in those same four regions, as would be expected on the basis of models of either linkage or pleiotropy.
Growth and body composition:
Many of the locations of QTL for growth and body composition traits found in this M16 × ICR F2 intercross coincide with QTL positions from previous studies using the M16i line (Leamy et al. 2002; Rocha et al. 2004a,b) or a variety of other mouse crosses (see Pomp et al. 2004 and Snyder et al. 2004 for summaries). Relative to the earlier studies using the M16i line (a fully inbred line derived from an M16 full-sib mating), the present results are able to inform us regarding which previously identified QTL have made the largest contributions to selection response in M16. Because the majority of these growth and body composition QTL have already been assigned locus symbols (see http://www.informatics.jax.org/searches/marker_forms.html), we have assigned new symbols only to the loci detected in this study for traits related to energy consumption and hormone/metabolite levels. Once QTL are resolved at the gene level, the many symbols assigned to specific regions for similar or correlated traits can be coalesced and reduced as necessary.
It is interesting that Rocha et al. (2004a) found several more regions harboring QTL for growth traits in addition to what was detected in this study. Although the experiments had relatively similar power of detection in terms of informative meioses, there was greater phenotypic divergence in the M16i × L6 cross employed by Rocha et al. (2004a). While the L6 line was selected for a low 6-week body weight, the ICR line used as the base population for M16 originated from stock selected for fecundity and size (Hauschka and Mirand 1973). Furthermore, M16i represents a fully inbred line while M16 likely still segregates alleles at some QTL, although a more thorough evaluation of this will require denser genotyping (see results). Thus, several explanations exist for the discrepancy in detected QTL. First, some QTL found in the M16i × L6 cross may be present in the M16 × ICR cross but were not detected due to either smaller phenotypic divergence or ongoing segregation within M16. Such undetected QTL would have relevance to understanding the selection response in the M16 line and may help indicate why a relatively small proportion of the variation in the traits measured in the M16 × ICR cross was explained by the detected QTL. Second, and possibly unrelated to selection response in M16, QTL found previously but not identified in the current cross may represent the effects of alleles contributed by the L6 line.
QTL and selection response:
In mice, Horvat et al. (2000) performed a genome-wide QTL analysis using the high-fat (F) and low-fat (L) lines that had been divergently selected for 53 generations on the basis of the percentage of body fat. As in the present study, Horvat et al. (2000) also found evidence for four primary regions that contributed to long-term selection response, although the effects of the QTL that they detected were in general larger than those quantified in the M16 × ICR cross. This is likely a result of the use of divergent selection lines, as opposed to a selection line and its control, and hence of greater phenotypic divergence. Also, nearly twice as many generations of selection had taken place in the F and L lines relative to M16. Interestingly, none of the four regions contributing to selection response in this study and in that of Horvat et al. (2000) appear to overlap, although it should be noted that we did not consider MMUX in the current analysis. In an experiment of very similar nature (but smaller magnitude) to what we report here, Brockmann et al. (1998) searched for QTL influencing body weight and fatness in crosses between a high-body-weight selection line (DU6) and its unselected control line (DUKs). Significant QTL were found for body weight on MMU11 (in relatively close proximity to that found in this study); for abdominal fat weight on MMU4, MMU11, and MMU13; and for abdominal fat percentage on MMU3 and MMU4. Together, the detected QTL contributed about one-third of the phenotypic variance of body weight and abdominal fat weight in the F2 population.
Cumulatively, these experiments using QTL analysis to map genomic regions contributing to long-term selection response for growth and fatness in mice lead to several putative conclusions. First, selection from different base populations appears to operate, for the most part, on genetic variation located in different regions of the genome. This is interesting in that most long-term selection experiments for growth- and/or fat-related traits seem to lead to very similar phenotypic consequences (Eisen 1989). Second, although several QTL with significant effects can be localized when crossing divergently selected lines or a selection line and its control, a significant portion of selection response remains undetected at the genomic level. In a very large evaluation of the genetic architecture of response to very long-term selection for oil concentration in the maize kernel, Laurie et al. (2004) found evidence for >50 QTL combining to account for ∼50% of the genetic variance. They attributed the fact that not all the variation could be accounted for to several factors, including potential underestimation of QTL effects, confounding epistatic interactions, and additional QTL that remained undetected in their experiment. In support of the latter argument, Rocha et al. (2004a) concluded that while QTL effects for body weight in mice clearly do not conform with the uniform distribution proposed in the context of an infinitesimal model, they approximate an exponential model that “nonetheless maintains an infinitesimal quality.”
Although selection for 3- to 6-week weight gain was originally replicated (Eisen 1975), the replicates were crossed to form the existing single lines of M16 and ICR, and thus there is no mechanism to differentiate QTL representing selection response from those that may have arisen from random genetic drift. While the strong phenotypic changes originally observed in the M16 line shortly after selection was completed have been remarkably resilient even after ∼100 generations of relaxed selection (Allan et al. 2004), and while nearly all effects of M16 alleles at QTL found in this study were in the expected direction, it is still likely that genetic drift has had significant impact on gene frequency and genetic variance in M16 (see Walsh 2004). This may explain some of the genomic regions harboring QTL for a variety of correlated traits but lacking a QTL for 3- to 6-week weight gain. Alternatively, such regions may still represent direct responses to selection, but the experiment contained sufficient power to detect QTL for the correlated traits only.
While the QTL detected in this study are most likely the result of selection acting on genetic variation present in the original ICR base population, they may also have originated from new mutations that took place during selection (see Keightley 2004). Although new mutations influencing growth may also have arisen during the extended period of relaxed selection, there was no selection pressure to propagate such alleles. And since such mutations would have been equally likely in M16 and ICR, QTL with alleles of ICR origin that increase body weight would have been observed. Two examples of such QTL were found in this study.
Given that the QTL detected in this study for growth and fatness have, for the most part, been identified in previous crosses using M16i and given that an extensive comparison and contrasting of these with many other QTL reports was provided by Rocha et al. (2004a)(b; see also Figure 1 in Pomp et al. 2004), we will not repeat that endeavor here. In brief, MMU2 had significant QTL for almost all measured traits related to growth and body composition. The extreme contribution of regions of MMU2 derived from the M16 line to the biology of fat deposition and growth have been summarized recently by Jerez-Timaure et al. (2004)(2005). Multiple QTL appear to exist on MMU6, in agreement with several other reports (Cheverud et al. 2001; Masinde et al. 2002; Rocha et al. 2004a). The QTL with strongest effects were localized to MMU11. Previous studies have shown evidence for clustering of genes with variable gene expression to MMU11 in the same locations as QTL from this study. This supports the idea of having variation within multiple genes contribute to the effects localized under a single QTL peak (de Haan et al. 2002; Jerez-Timaure et al. 2005). The proximal half of MMU17 has been shown to include a number of QTL for traits related to fat and growth, as was verified in this study.
QTL and tissue-specific regulation:
Evidence for QTL with depot-specific regulation of fat mass, as found in the M16 × ICR cross on MMU4 and MMU7, is important when trying to understand the polygenic nature of adiposity in mammals. Microarray studies in rats comparing mRNA from visceral and subcutaneous fat found gene expression to be differentially regulated between the fat pads (Atzmon et al. 2002). Many of the genes found to be up- and downregulated were predominantly involved in glucose homeostasis, insulin action, and lipid metabolism. In humans, regional depot differences have been observed for gene expression, insulin sensitivity, and fatty acid metabolism (Montague et al. 1998; Vidal 2001; Wajchenberg et al. 2002). Others have mapped QTL for depot-specific fat deposition to the same regions of MMU4 (Moody et al. 1999) and MMU7 (Keightley et al. 1998; Taylor et al. 2001; Rocha et al. 2004b). Jerez-Timaure et al. (2005), in their fine mapping of QTL on MMU2, found a QTL for epididymal fat as a percentage of body weight with no effect on total percentage of body fat. Mehrabian et al. (1998) found similar results for MMU2 showing QTL contributing to specific fat depots.
QTL and age-specific regulation:
Examples of age-dependent QTL effects for body weight have been shown in many studies (e.g., Brockmann et al. 2004; Rocha et al. 2004a). In this study, growth was evaluated only from 3 to 8 weeks of age. Yet, we still see genetic regulation that is period specific within this narrow window of observation, which can be interpreted as evidence for different subsets of genes contributing to growth as ontogeny progresses. Results showing differences in cell number and cell size at different ages have been observed in several selection experiments in mice (Falconer et al. 1978; Atchley et al. 2000), including the M16 line (Eisen and Leatherwood 1978).
QTL for energy consumption:
A major objective of this study was to uncover evidence for QTL regulating energy consumption in mammals, a goal that has proven elusive in past studies. Greater success has been achieved in studies using birds. Van Kaam et al. (1999) found one QTL within a fixed-age interval that showed significant linkage for feed intake. de Koning et al. (2003) reported a QTL for residual feed intake on chromosome 4 in broiler lines. In mice, Moody et al. (1999) failed to detect QTL for feed intake in specific chromosomal regions harboring QTL for heat loss in a large mapping population (n = 560), where consumption was measured over a 14-day period beginning at 12 weeks of age in mice. More recently, Smith Richards et al. (2002) found QTL for macronutrient diet intake in mice with two QTL for total intake adjusted to body weight on MMU17 and MMU18; intake was measured over a 10-day period in mice ranging from 9 to 11 weeks of age.
In this study, we report significant evidence for a total of 12 QTL affecting measures of energy intake and efficiency of growth relative to feed consumption. Analysis of total intake adjusted for body weight (FIA) yielded five significant QTL, with the largest effect found on MMU11 explaining 4.7% of the residual variance. The success achieved using the M16 × ICR cross may be attributed to one or more of several possible explanations. Notably, this study used the largest sample size yet to be employed in the search for QTL regulating energy consumption. Perhaps more importantly, feed intake was measured at younger ages than in the past, specifically targeting periods of rapid growth as opposed to time points corresponding more to maintenance of body weight. This may also explain why higher correlations between feed intake and body weight were observed in this experiment relative to those reported by Smith Richards et al. (2002). The three QTL found in this study for intake at specific weekly intervals show, for the first time, age-dependent genomic regulation of feed intake and feed efficiency in a fashion similar to what has been widely observed for body weight.
QTL for endo-phenotypes:
A primary motivation for establishing this very large M16 × ICR F2 intercross population was to begin to integrate large-scale endo-phenotyping into QTL analysis for growth and body composition to combine the powers of functional and recombination analyses (e.g., Schadt et al. 2003; Pomp et al. 2004). Evaluation of segregating populations at the transcriptional and proteomic levels will greatly facilitate a more thorough understanding of response to selection for rapid growth rate, and the overall genetic architecture of complex traits such as body weight and adiposity. To this end, we collected and stored a large number of tissues from each of the nearly 1200 F2 mice, including hypothalamus, pituitary, liver, skeletal muscle, epididymal/perimetrial adipose, subcutaneous adipose, kidney, and blood. While the major undertaking of high-throughput evaluation of mRNA and proteomic phenotypes in the M16 × ICR F2 intercross is in progress using several of these tissues, we measured in this study the levels of several plasma proteins (insulin, leptin, TNFα, IL6) and a metabolite (glucose) relevant to growth and obesity.
Previously, we showed that M16 male mice have fasted blood glucose levels that classify them as type II diabetic (Allan et al. 2004). While only two QTL for blood glucose levels were found in this study, similar QTL have been previously reported in two mapping populations using mouse models for type II diabetes (Hirayama et al. 1999; Ueda et al. 1999). A possible explanation for finding only two significant QTL for blood glucose in the M16 × ICR F2 intercross may be related to the relatively brief (1.5-hr) fasting period used prior to glucose measurements. More importantly, strong interaction effects were detected between QTL for blood glucose levels and gender.
The QTL detected on MMU2 for insulin in this study are in agreement with previous reports (Mehrabian et al. 1998; Hirayama et al. 1999), while a study mapping QTL in recombinant inbred lines (SMXA; Anunciado et al. 2003) found a suggestive QTL for insulin levels in females on MMU17 that may correspond to what was found in the M16 × ICR cross. The suggestive evidence that we found for an insulin QTL on MMU11, proximal to the QTL seen for growth, fat, and glucose levels, supports a previous report by Leiter et al. (1998). For leptin levels, two QTL were identified in the same regions as those found for insulin. Colocalization of QTL for insulin and leptin levels would not be surprising, given the positive correlations between these traits. Robinson et al. (2000) have shown that most hyperinsulinemic (insulin-resistant) mouse models are also hyperleptinemic (leptin resistant).
All of the QTL found for insulin and leptin levels were trans in nature (i.e., the QTL regulating variation in levels of each protein are distinct from the structural loci coding for each protein). We were unable to detect QTL for TNFα and IL6. Differences in the M16 and ICR parental lines for levels of these proteins were significant but not large (Allan et al. 2004). The substantial standard error associated with measurement of these proteins, coupled with an apparent lack of correlation to growth and fat phenotypes in the M16 × ICR cross, likely explains our inability to detect QTL for these proteins. We are not aware of any findings of QTL for plasma levels of either TNFα or IL6 in mice in other experiments as well.
Summary:
By mapping QTL in a large F2 population resulting from an intercross between the M16 and ICR lines of mice, we have identified chromosomal regions harboring genes that likely contributed to direct and correlated responses to long-term selection for rapid growth rate in mice. The evaluation of QTL for food consumption represents the most extensive and successful analysis conducted to date of polygenic control of energy intake in a growing animal, although this still comprises a relatively poor understanding of this complex trait. We are currently conducting very dense genotyping and evaluating global gene expression across multiple tissues in this F2 population. Such additional data not only will provide significantly strengthened power to understand the nature and mechanisms of selection response for growth, but also will assist in identifying and prioritizing candidate genes underlying QTL for body weight, fatness, and traits related to energy balance.
Acknowledgments
The authors are appreciative of the efforts of Sara Olberding, Jeryl Hauptman, Nancy Jerez-Timaure, and Stephanie Wesolowski in assisting with mouse husbandry and phenotypic data collection and Barry Simpson in assisting with Luminex assays. We are grateful to Mark Thallman, Gary Rohrer, and Kathy Hanford for useful suggestions on statistical analyses. This research is a contribution of the University of Nebraska Agricultural Research Division (Lincoln, NE; journal series no. 14908).
APPENDIX
Microsatellite markers genotyped in the M16 × ICR F2 population
| Chromosome | Marker | cMa | cM | Mb | Ib | Chromosome | Marker | cMa | cM | Mb | Ib |
|---|---|---|---|---|---|---|---|---|---|---|---|
| 1 | D1Mit121c | 19.5 | 19.5 | 35.2 | 80 | 9 | D9Mit64c | 7.0 | 7.0 | 28.5 | 83 |
| D1Mit300 | 34.2 | 32.8 | 64.3 | 75 | D9Mit229 | 23.4 | 28.0 | 49.7 | 83 | ||
| D1Mit24 | 40.5 | 41.0 | 74.9 | 48 | D9Mit136 | 51.4 | 54.0 | 99.0 | 91 | ||
| D1Mit84 | 49.9 | 58.4 | 91.8 | 58 | 10 | D10Mit279c | 2.0 | 2.0 | 7.6d | 100 | |
| D1Mit200 | 69.6 | 73.0 | 150.3 | 64 | D10Mit3 | 13.4 | 21.0 | 28.9 | 75 | ||
| D1Mit36 | 83.0 | 92.3 | 169.3 | 33 | D10Mit31 | 29.5 | 36.0 | 68.0 | 44 | ||
| D1Mit293 | 107.5 | 109.6 | 192.9 | 92 | D10Mit132 | 46.0 | 47.0 | 83.8 | 46 | ||
| 2 | D2Mit467c | 27.3 | 27.3 | 35.8 | 90 | 11 | D11Mit152c | 13.0 | 13.0 | 24.1 | 72 |
| D2Mit472 | 45.3 | 38.3 | 68.0d | 80 | D11Mit4 | 43.2 | 37.0 | 68.2 | 50 | ||
| D2Mit274 | 76.2 | 52.5 | 114.2 | 60 | D11Mit213 | 57.8 | 55.0 | 94.2 | 50 | ||
| D2Mit353 | 90.5 | 63.4 | 138.0 | 65 | D11Mit69 | 85.4 | 71.0 | 120.7 | 82 | ||
| D2Mit210 | 117.3 | 105.0 | 174.7 | 80 | 12 | D12Mit153c | 15.0 | 15.0 | 30.3 | 85 | |
| 3 | D3Mit203c | 11.2 | 11.2 | 26.7 | 86 | D12Mit190 | 30.1 | 28.0 | 54.9 | 72 | |
| D3Mit230 | 37.3 | 38.3 | 83.0 | 69 | D12Mit141 | 73.5 | 55.0 | 105.2 | 55 | ||
| D3Mit75 | 44.3 | 49.0 | 100.7 | 88 | 13 | D13Mit186c | 24.0 | 36.0 | 58.8 | 79 | |
| D3Mit194 | 68.7 | 67.6 | 139.3 | 86 | D13Mit318 | 26.0 | 24.0 | 60.1 | 60 | ||
| D3Mit19 | 86.5 | 87.6 | 157.3d | 72 | D13Mit129 | 52.0 | 60.0 | 107.5 | 50 | ||
| 4 | D4Mit149c | 0.0 | 0.0 | 3.6 | 91 | 14 | D14Mit62c | 18.5 | 18.5 | 44.0 | 50 |
| D4Mit1 | 5.0 | 6.3 | 17.8 | 75 | D14Mit85 | 32.2 | 32.5 | 61.3 | 50 | ||
| D4Mit197 | 28.3 | 28.6 | 55.5 | 75 | D14Mit165 | 53.1 | 52.0 | 98.9 | 60 | ||
| D4Mit251 | 73.4 | 66.0 | 135.4 | 75 | D14Mit170 | 58.2 | 63.0 | 98.6 | 85 | ||
| 5 | D5Mit61c | 8.0 | 8.0 | 20.2 | 75 | 15 | D15Mit136c | 14.2 | 14.2 | 30.9 | 75 |
| D5Mit200 | 31.0 | 36.0 | 61.6d | 58 | D15Mit183 | 26.1 | 23.0 | 55.4 | 75 | ||
| D5Mit210 | 54.7 | 64.0 | 115.4 | 63 | D15Mit159 | 48.9 | 49.6 | 87.9 | 80 | ||
| D5Mit292 | 76.7 | 80.0 | 138.1 | 75 | 16 | D16Mit4c | 27.3 | 27.3 | 36.1 | 46 | |
| 6 | D6Mit350c | 19.0 | 19.0 | 43.6 | 61 | D16Mit139 | 42.3 | 43.1 | 65.9 | 60 | |
| D6Mit188 | 32.4 | 32.5 | 75.7 | 100 | D16Mit188 | 45.3 | 52.5 | 77.2 | 67 | ||
| D6Mit105 | 52.1 | 45.5 | 108.2 | 75 | 17 | D17Mit164c | 4.1 | 4.1 | 3.9 | 65 | |
| D6Mit255 | 64.2 | 60.3 | 125.6 | 92 | D17Mit175 | 48.8 | 17.7 | 35.9d | 95 | ||
| D6Mit14 | 82.6 | 71.3 | 145.4d | 71 | D17Mit180 | 58.9 | 29.4 | 49.6 | 45 | ||
| 7 | D7Mit22c | 8.0 | 8.0 | 15.4d | 91 | D17Mit119 | 73.2 | 38.5 | 65.3 | 61 | |
| D7Mit246 | 15.7 | 15.0 | 22.0d | 78 | D17Mit155 | 91.5 | 55.7 | 83.1 | 69 | ||
| D7Mit348 | 41.9 | 37.0 | 63.2 | 100 | 18 | D18Mit60c | 16.0 | 16.0 | 32.9 | 72 | |
| D7Mit130 | 57.0 | 51.6 | 97.1 | 72 | D18Mit142 | 52.5 | 47.0 | 75.9 | 86 | ||
| D7Mit255 | 71.0 | 60.0 | 112.4 | 63 | D18Mit4 | 59.7 | 57.0 | 84.6 | 95 | ||
| 8 | D8Mit155c | 1.0 | 1.0 | 5.0 | 88 | 19 | D19Mit78c | 5.0 | 5.0 | 7.3 | 67 |
| D8Mit258 | 22.1 | 15.0 | 32.8 | 90 | D19Mit40 | 30.8 | 25.0 | 24.6 | 60 | ||
| D8Mit205 | 35.3 | 30.0 | 55.0 | 92 | D19Mit8 | 54.2 | 47.0 | 46.1d | 94 | ||
| D8Mit248 | 51.3 | 43.0 | 92.0 | 94 | |||||||
| D8Mit121 | 81.9 | 67.0 | 123.1d | 100 |
Positions of markers in Kosambi centimorgans. First centimorgan column is from Cri-Map analysis; the second centimorgan column is from the MGD.
Marker informativeness as evaluated by QTL Express.
Positions of the first marker on each chromosome are from the MGD and thus will be the same for both columns.
Estimates are based on Ensembl map positions of genes shown to be tightly linked in the MGD.
References
- Allan, M. F., E. J. Eisen and D. Pomp, 2004. The M16 mouse: an outbred animal model of early onset polygenic obesity-induced diabetes (diabesity). Obes. Res. 12: 1397–1407. [DOI] [PubMed] [Google Scholar]
- Anunciado, R. V., M. Nishimura, M. Mori, A. Ishikawa, S. Tanaka et al., 2003. Quantitative trait locus analysis of serum insulin, triglyceride, total cholesterol and phospholipid levels in the (SM/J × A/J) mice. Exp. Anim. 52: 37–42. [DOI] [PubMed] [Google Scholar]
- Atchley, W. R., R. Wei and P. Crenshaw, 2000. Cellular consequences in the brain and liver of age-specific selection for rate of development. Genetics 155: 1347–1357. [DOI] [PMC free article] [PubMed] [Google Scholar]
- Atzmon, G., X. M. Yang, R. Muzumdar, X. H. Ma, I. Gabriely et al., 2002. Differential gene expression between visceral and subcutaneous fat depots. Horm. Metab. Res. 34: 622–628. [DOI] [PubMed] [Google Scholar]
- Brockmann, G. A., and M. R. Bevova, 2002. Using mouse models to dissect the genetics of obesity. Trends Genet. 18: 367–376. [DOI] [PubMed] [Google Scholar]
- Brockmann, G. A., C. S. Haley, U. Renne, S. A. Knott and M. Schwerin, 1998. Quantitative trait loci affecting body weight and fatness from a mouse line selected for extreme high growth. Genetics 150: 369–381. [DOI] [PMC free article] [PubMed] [Google Scholar]
- Brockmann, G. A., E. Karatayli, C. S. Haley, U. Renne, O. J. Rottmann et al., 2004. QTLs for pre- and postweaning body weight and body composition in selected mice. Mamm. Genome 15: 593–609. [DOI] [PubMed] [Google Scholar]
- Bunger, L., A. Laidlaw, G. Bulfield, E. J. Eisen, J. F. Medrano et al., 2001. Inbred lines of mice derived from long-term divergent selection on fat content and body weight. Mamm. Genome 12: 678–686. [DOI] [PubMed] [Google Scholar]
- Cheverud, J. M., T. T. Vaughn, L. S. Pletscher, A. C. Peripato, E. S. Adams et al., 2001. Genetic architecture of adiposity in the cross of LG/J and SM/J inbred mice. Mamm. Genome 12: 3–12. [DOI] [PubMed] [Google Scholar]
- Churchill, G. A., and R. W. Doerge, 1994. Empirical threshold values for quantitative trait mapping. Genetics 138: 963–971. [DOI] [PMC free article] [PubMed] [Google Scholar]
- Corva, P. M., and J. F. Medrano, 2001. Quantitative trait loci (QTLs) mapping for growth traits in the mouse: a review. Genet. Sel. Evol. 33: 105–132. [DOI] [PMC free article] [PubMed] [Google Scholar]
- de Haan, G., L. V. Bystrykh, E. Weersing, B. Dontje, H. Geiger et al., 2002. A genetic and genomic analysis identifies a cluster of genes associated with hematopoeitic cell turnover. Blood 100: 2056–2062. [DOI] [PubMed] [Google Scholar]
- de Koning, D. J., D. Windsor, P. M. Hocking, D. W. Burt, A. Law et al., 2003. Quantitative trait locus detection in commercial broiler lines using candidate regions. J. Anim. Sci. 81: 1158–1165. [DOI] [PubMed] [Google Scholar]
- Eisen, E. J., 1975. Population size and selection intensity effects on long-term selection response in mice. Genetics 79: 305–323. [DOI] [PMC free article] [PubMed] [Google Scholar]
- Eisen, E. J., 1989. Selection experiments for body composition in mice and rats: a review. Livest. Prod. Sci. 23: 17–32. [Google Scholar]
- Eisen, E. J., 2005 Testing quantitative genetic selection theory, pp. 1–50 in The Mouse in Animal Genetics and Breeding Research, edited by E. J. Eisen. Imperial College Press, London.
- Eisen, E. J., and J. M. Leatherwood, 1978. Effect of postweaning feed restriction on adipose cellularity and body composition in polygenic obese mice. J. Nutr. 108: 1663–1672. [DOI] [PubMed] [Google Scholar]
- Eisen, E. J., J. H. Bakker and J. Nagai, 1977. Body composition and energetic efficiency in two lines of mice selected for rapid growth rate and their F1 crosses. Theor. Appl. Genet. 49: 21–34. [DOI] [PubMed] [Google Scholar]
- Eisen, E. J., J. F. Hayes, C. E. Allen, H. Baker and J. Nagai, 1978. Cellular characteristics of gonadal fat pads, livers and kidneys in two strains of mice selected for rapid growth. Growth 42: 7–25. [PubMed] [Google Scholar]
- Falconer, D. S., I. K. Gauld and R. C. Roberts, 1978. Cell numbers and cell sizes in organs of mice selected for large and small body size. Genet. Res. 31: 287–301. [DOI] [PubMed] [Google Scholar]
- Green, P. K., and S. Crooks, 1990 Documentation for CRI-MAP, version 2.4. Washington School of Medicine, St. Louis.
- Hanrahan, J. P., E. J. Eisen and J. E. Legates, 1973. Effects of population size and selection intensity on short-term response to selection for postweaning gain in mice. Genetics 73: 513–530. [DOI] [PMC free article] [PubMed] [Google Scholar]
- Hauschka, T. S., and E. A. Mirand, 1973 The breeder: “HA(ICR)” Swiss mouse, a multipurpose stock selected for fecundity, pp. 319–331 in Perspectives in Cancer Research and Treatment, edited by G. P. Murphy, D. Pressman and E. A. Mirand. Alan R. Liss, New York.
- Hirayama, I., Z. Yi, S. Izumi, I. Arai, W. Suzuki et al., 1999. Genetic analysis of obese diabetes in the TSOD mouse. Diabetes 48: 1183–1191. [DOI] [PubMed] [Google Scholar]
- Horvat, S., L. Bünger, V. M. Falconer, P. Mackay, A. Law et al., 2000. Mapping of obesity QTLs in a cross between mouse lines divergently selected on fat content. Mamm. Genome 11: 2–7. [DOI] [PubMed] [Google Scholar]
- Jerez-Timaure, N. C., F. Kearney, E. B. Simpson, E. J. Eisen and D. Pomp, 2004. Characterization of QTL with major effects on fatness and growth on mouse chromosome 2. Obes. Res. 12: 1408–1420. [DOI] [PubMed] [Google Scholar]
- Jerez-Timaure, N. C., E. J., Eisen and D. Pomp, 2005. Fine mapping of QTL with major effect on weight and fat on distal mouse chromosome 2. Physiol. Genomics 21: 411–422. [DOI] [PubMed] [Google Scholar]
- Keightley, P. D., 2004. Mutational variation and long-term selection response. Plant Breed. Rev. 24(Pt. 1): 227–247. [Google Scholar]
- Keightley, P. D., K. H. Morris, A. Ishikawa, V. M. Falconer and F. Oliver, 1998. Test of candidate gene-quantitative trait locus association applied to fatness in mice. Heredity 81: 630–637. [DOI] [PubMed] [Google Scholar]
- Laurie, C. C., S. D. Shasalow, J. R. Ledeaux, R. McCarroll, D. Bush et al., 2004. The genetic architecture of response to long-term artificial selection for oil concentration in the maize kernel. Genetics 168: 2141–2155. [DOI] [PMC free article] [PubMed] [Google Scholar]
- Leamy, L. J., D. Pomp, E. J. Eisen and J. M. Cheverud, 2000. Quantitative trait loci for directional but not fluctuating asymmetry of mandible characters in mice. Genet. Res. 76: 27–40. [DOI] [PubMed] [Google Scholar]
- Leamy, L. J., D. Pomp, E. J. Eisen and J. M. Cheverud, 2002. Pleiotropy of quantitative trait loci for organ weights and limb bone lengths in mice. Physiol. Genomics 10: 21–29. [DOI] [PubMed] [Google Scholar]
- Leiter, E. H., P. C. Reifsnyder, K. Flurkey, H. J. Parke, E. Junger et al., 1998. NIDDM genes in mice: deleterious synergism by both parental genomes contributes to diabetogenic thresholds. Diabetes 47: 1287–1295. [DOI] [PubMed] [Google Scholar]
- Little, R. C., G. A. Milliken, W. W. Stroup and R. D. Wolfinger, 1996 SAS System for Mixed Models. SAS Institute, Cary, NC.
- Masinde, G. L., X. Li, W. Gu, J. Wergedal, S. Mohan et al., 2002. Quantitative trait loci for bone density in mice: the genes determining total skeletal density and femur density show little overlap in F2 mice. Calcif. Tissue Int. 71: 421–428. [DOI] [PubMed] [Google Scholar]
- Mehrabian, M., P. Z. Wen, J. Fisler, R. C. Davis and A. J. Lusis, 1998. Genetic loci controlling body fat, lipoprotein metabolism, and insulin levels in a multifactorial mouse model. J. Clin. Invest. 101: 2485–2496. [DOI] [PMC free article] [PubMed] [Google Scholar]
- Montague, C. T., J. B. Prins, L. Sanders, J. Zhang, C. P. Sewter et al., 1998. Depot-related gene expression in human subcutaneous and omental adipocytes. Diabetes 47: 1384–1391. [DOI] [PubMed] [Google Scholar]
- Moody, D. E., D. Pomp, M. K. Nielsen and L. D. Van Vleck, 1999. Identification of quantitative trait loci influencing traits related to energy balance in selection and inbred lines of mice. Genetics 152: 699–711. [DOI] [PMC free article] [PubMed] [Google Scholar]
- Pomp, D., 1997. Genetic dissection of obesity in polygenic animal models. Behav. Genet. 27: 285–306. [DOI] [PubMed] [Google Scholar]
- Pomp, D., and J. D. Murray, 1991. Single day detection of transgenic mice by PCR of the toe-clips. Mouse Genome 89: 279–280. [Google Scholar]
- Pomp, D., M. F. Allan, and S. R. Weslowski, 2004. Quantitative genomics: exploring the genetic architecture of complex trait predisposition. J. Anim. Sci. 82: E-Suppl: E300–E312. [DOI] [PubMed] [Google Scholar]
- Robeson, B. L., E. J. Eisen and J. M. Leatherwood, 1981. Adipose cellularity, serum glucose, insulin and cholesterol in polygenic obese mice fed high-fat or high carbohydrate diets. Growth 45: 198–215. [PubMed] [Google Scholar]
- Robinson, S. W., D. M. Dinulescu and R. D. Cone, 2000. Genetic models of obesity and energy balance in the mouse. Annu. Rev. Genet. 34: 687–745. [DOI] [PubMed] [Google Scholar]
- Rocha, J. L., D. Pomp, L. D. Van Vleck and M. K. Nielsen, 2001. Predictors of marker-informativeness for an outbred F2 design. Anim. Genet. 32: 365–370. [DOI] [PubMed] [Google Scholar]
- Rocha, J. L., E. J. Eisen, L. D. Van Vleck and D. Pomp, 2004. a A large-sample QTL study in mice. I. Growth. Mamm. Genome 15: 83–99. [DOI] [PubMed] [Google Scholar]
- Rocha, J. L., E. J. Eisen, L. D. Van Vleck and D. Pomp, 2004. b A large-sample QTL study in mice. II. Body composition. Mamm. Genome 15: 100–113. [DOI] [PubMed] [Google Scholar]
- Rocha, J. L., E. J. Eisen, F. Siewerdt, L. D. Van Vleck and D. Pomp, 2004. c A large-sample QTL study in mice. II. Reproduction. Mamm. Genome 15: 878–886. [DOI] [PubMed] [Google Scholar]
- SAS, 1990 SAS/STAT User's Guide. SAS Institute, Cary, NC.
- Schadt, E. E., S. A. Monks, T. A. Drake, A. J. Lusis, N. Che et al., 2003. Genetics of gene expression surveyed in maize, mouse and man. Nature 422: 297–302. [DOI] [PubMed] [Google Scholar]
- Seaton, G., C. S. Haley, S. A. Knott, M. Kearsey and P. M. Visscher, 2002. QTL express: mapping quantitative trait loci in simple and complex pedigrees. Bioinformatics 18: 339–340. [DOI] [PubMed] [Google Scholar]
- Smith Richards, B. K., B. N. Belton, A. C. Poole, J. J. Mancuso, G. A. Churchill et al., 2002. QTL analysis of self-selected macronutrient diet intake: fat, carbohydrate, and total kilocalories. Physiol. Genomics 11: 205–217. [DOI] [PubMed] [Google Scholar]
- Snyder, E. E., B. Walts, L. Perusse, Y. C. Chagnon, S. J. Weisnagel et al., 2004. The human obesity gene map: the 2003 update. Obes. Res. 12: 369–439. [DOI] [PubMed] [Google Scholar]
- Taylor, B. A., C. Wnek, D. Schroeder and S. J. Phillips, 2001. Multiple obesity QTLs identified in an intercross between the NZO (New Zealand Obese) and the SM (small) mouse strains. Mamm. Genome 12: 95–103. [DOI] [PubMed] [Google Scholar]
- Ueda, H., H. Ikegami, Y. Kawaguchi, Y. Kawaguchi, T. Fujisawa et al., 1999. Genetic analysis of late-onset type 2 diabetes in a mouse model of human complex trait. Diabetes 48: 1168–1174. [DOI] [PubMed] [Google Scholar]
- Ungerer, M. C., and L. H. Rieseberg, 2003. Genetic architecture of a selection response in Arabidopsis thaliana. Evolution 57: 2531–2539. [DOI] [PubMed] [Google Scholar]
- Valenzuela, R. K., S. N. Forbes, P. Keim and P. M. Service, 2004. Quantitative trait loci affecting life span in replicated populations of Drosophila melangoster. II. Response to selection. Genetics 168: 313–314. [DOI] [PMC free article] [PubMed] [Google Scholar]
- Van Kaam, J. B., M. A. Groenen, H. Bovenhuis, A. Veenendaal, A. L. Vereijken et al., 1999. Whole genome scan in chickens for quantitative trait loci affecting growth and feed efficiency. Poult. Sci. 78: 15–23. [DOI] [PubMed] [Google Scholar]
- Vidal, H., 2001. Gene expression in visceral and subcutaneous adipose tissues. Ann. Med. 33: 547–555. [DOI] [PubMed] [Google Scholar]
- Visscher, P. M., R. Thompson and C. S. Haley, 1996. Confidence intervals for QTL mapping by bootstrapping. Genetics 143: 1013–1020. [DOI] [PMC free article] [PubMed] [Google Scholar]
- Wajchenberg, B. L., D. Giannella-Neto, M. E. Da Silva and R. F. Santos, 2002. Depot-specific hormonal characteristics of subcutaneous and visceral adipose tissue and their relation to the metabolic syndrome. Horm. Metab. Res. 34: 616–621. [DOI] [PubMed] [Google Scholar]
- Walsh, B., 2004. Population- and quantitative-genetic models of selection limits. Plant Breed. Rev. 24(Pt. 1): 177–225. [Google Scholar]
- Zeng, Z-B., 1993. Theoretical basis for separation of multiple linked gene effects in mapping quantitative trait loci. Proc. Natl. Acad. Sci. USA 90: 10972–10976. [DOI] [PMC free article] [PubMed] [Google Scholar]
- Zeng, Z-B., 1994. Precision mapping of quantitative trait loci. Genetics 136: 1457–1468. [DOI] [PMC free article] [PubMed] [Google Scholar]