Abstract
Direct cell–cell communication is crucial for many processes in biology, particularly embryogenesis, interactions between hematopoetic cells, and in the nervous system. This communication is often mediated by the binding of receptors to cognate ligands at a cell–cell junction. One such interaction that is very important for the development of many immune responses is the binding of the αβ T cell receptor for antigen (TCR) on T lymphocytes with peptide–MHC complexes on other cells. In general, the stability (e.g., half-life) of TCR–peptide–MHC binding measured in solution correlates with functional responses. Several anomalies have been reported, however. For example, for some anomalous ligands, large changes in heat capacity can apparently substitute for a lack of stability in TCR–ligand interactions. Here, we show that, when there are significant conformational changes during receptor–ligand binding and the receptor/ligand have relatively rigid molecular subdomains, the difference between the half-life of this receptor–ligand complex at a cell–cell junction and that measured using soluble molecules is large. Thus, receptors/ligands with these specific molecular features do not follow correlations between stimulatory potency in the cellular environment and half-lives measured with soluble molecules. Our “first-principles” prescription for correcting the half-life measured in solution to obtain the pertinent value at a cell–cell junction illuminates the origin of correlations of T cell response with thermodynamic properties. Application of our ideas to diverse systems where receptor–ligand interactions occur across juxtaposed cells may help avoid debates about “anomalies” that may simply arise from receptor/ligand-specific differences between half-lives in solution and in the cellular environment.
Keywords: conformational changes, lymphocyte activation, receptor–ligand binding
Cellular responses resulting from the binding of receptors and ligands embedded in apposed cell membranes is ubiquitous (1–7). Ever since the seminal work of Bell (8), many authors have considered how receptor–ligand binding in the membrane environment will differ from the same interactions measured in solution (9–13). All of these studies consider the generic physical effects of confining receptors and ligands to two apposed cell membranes. Given the same cellular environment, these effects apply universally, regardless of the molecular characteristics of specific receptors and ligands. For example, elastic forces imposed by cell membranes reduce the half-life of all receptor–ligand complexes in a similar way (8). This previous work did not identify that differences between the binding characteristics of soluble receptors and ligands and the same molecules at a cell–cell junction could depend on specific molecular features of these species.
T lymphocytes (T cells) coordinate adaptive immune responses, and their activation requires the binding of T cell receptor for antigen (TCR) with peptide–MHC (pMHC) molecules expressed on antigen-presenting cells. The half-life of this binding interaction is often a good predictor of the ability of a particular pMHC molecule to stimulate T cell activation (14–18). However, many exceptions to this observation have been reported (19–26). Krogsgaard et al. (26) studied how T cells bearing the same TCR are stimulated by different peptides bound to a particular MHC protein. These data showed that, for most pMHC ligands, activation potential increased with the half-life of the TCR–pMHC complex (measured using soluble molecules and surface plasmon resonance). However, there were notable outliers, and these peptides stimulated T cells more efficiently than would be predicted from the measured TCR–pMHC half-lives. Krogsgaard et al. (26) also found that increases in a second parameter, change in heat capacity upon binding, which is often a measure of changes in conformation (27–30), correlated with the stimulatory ability of the anomalous ligands. Specifically, when T cell stimulation potency was graphed as a function of the product of half-life (measured using soluble molecules) and change in specific heat capacity upon TCR–pMHC binding, a good fit to all of the data were obtained. The origin of such a correlation is unknown.
Here, we show that, if there are significant conformational changes during receptor–ligand binding and the receptor/ligand has relatively inflexible molecular subdomains, the half-life of the complex will be longer at a cell–cell junction compared with that measured using soluble molecules. If intracellular signaling cascades that translate receptor–ligand binding to functional responses depend on the half-life (14–18, 31, 32), the relevant half-life is that in the cell membrane environment. Therefore, receptors/ligands with the molecular characteristics noted above will be more stimulatory than the shorter half-lives measured in solution would suggest. We derive a formula for the increased half-life of a receptor–ligand complex at a cell–cell junction, and it contains the change in heat capacity upon binding; it also fits experimental data on T cell activation very well. This formula could be used in diverse situations where biological response is predicated on the stability of receptor–ligand interactions that occur across cell membranes.
Model Development
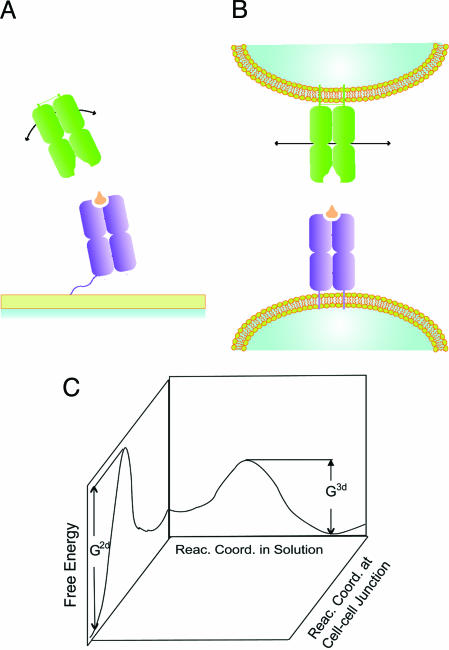
In standard measurements of protein–protein interactions using surface plasmon resonance, either the receptor or the ligand is immobilized on a surface using a flexible tether, and the other is in solution (26, 33, 34). If the tether is sufficiently long and flexible, both molecules can be considered to be in solution. Calorimetric measurements are carried out with both molecules in solution (26, 35, 36). The free energy cost associated with rigid-body motion (e.g., rotational motion leading to change in receptor/ligand orientation) in solution is small (Fig. 1A). Thus, these molecular motions can aid the conformational adjustments of molecular subdomains (37, 38) that are necessary for docking the receptor and ligand in the transition state for this chemical reaction. Fig. 1B shows that if the receptor and ligand are embedded in two-dimensional (2D) cell membranes, these motions are severely restricted and hence correspond to high free energy costs. Thus, docking of the receptor and ligand in the transition state may not follow the same temporal evolution of atomic coordinates as in solution. In other words, the reaction coordinate could change once receptors and ligands are embedded in the highly constrained environment of cell membranes.
Fig. 1.
Differences between binding in solution and the membrane environment. Schematic representation of the receptors and ligands binding in solution (A; 3D freedom) and at a cell–cell junction (B; constrained). Motions that can reorient receptors and ligands are facile in solution but highly constrained in the cell membrane environment. (C) This effect could make the reaction coordinate different at a cell–cell junction compared with that for binding of soluble molecules. G2d and G3d are the free energy barriers for the same reaction in the membrane environment and in solution, respectively, if different reaction coordinates in these environments correspond to different free energy barriers.
If membrane constraints do not allow the soft modes available in three-dimensional (3D) solution to aid the process of docking in to the transition state, upon close apposition of receptors and ligands, changes in the conformations of the molecular subdomains will play a more significant role in receptor–ligand binding (Fig. 1B). If these internal degrees of freedom are relatively flexible, then this effect will not lead to any appreciable change in the free energy barrier between the unbound and transition states compared with that in solution. However, if these internal degrees of freedom are relatively rigid, the free energy barrier will be higher in the membrane environment. This also implies that the free energy barrier associated with the reverse process (dissociation) will be higher (Fig. 1C), assuming that the final structure of a bound TCR–pMHC complex is the same in solution as in the membrane environment. Thus, there will be a concomitant increase in the half-life at a cell–cell junction. How is this increase in the half-life related to measurable properties of receptors/ligands?
We studied a simplified model that mimics the situation shown in Fig. 1 to carry out an exact statistical mechanical calculation and derive formulas that answer this question. We consider a minimal description of the relevant phenomena, rather than a detailed atomistic model of a specific receptor–ligand complex, because our purpose is to establish general principles and scaling relationships that are applicable to a wide variety of receptor–ligand systems in diverse cell types. In solution, receptors and ligands are brought in to close apposition necessary for binding to occur (“collisions”) by free diffusion. In the cell membrane environment, diffusion or convection in the planes of the membrane bring the receptor and ligand head-to-head (described for general systems in refs. 8 and 13) and shape changes perpendicular to the membrane surfaces then bring them in to close apposition (see Fig. 4 and Supporting Text, which are published as supporting information on the PNAS web site). We consider the situation after transport and membrane shape changes have brought a receptor and a ligand head-to-head and in to close apposition. On the short lateral length scale of a receptor/ligand, we may then consider the two membranes to be flat.
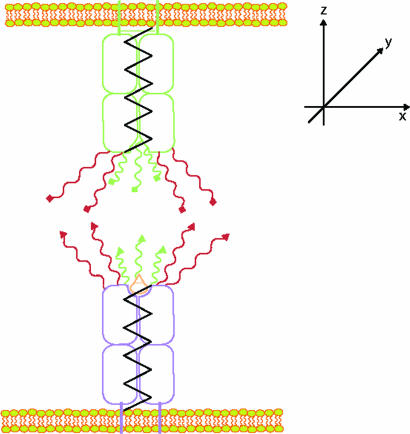
The simple model that we consider for receptor–ligand binding is shown in Fig. 2. The rigid-body motions leading to reorientation of the receptor or ligand are modeled by the motion of the shafts. These modes of motion will be very constrained in the membrane environment. The limit of free solution can be recovered in our model by allowing these motions to be relatively unconstrained. The receptors and ligands also have several internal parts that represent the molecular subdomains that undergo conformational adjustments in the process of binding. We separate these internal parts into two groups. The first group (colored red in Fig. 2) is comprised of those components that must dock with each other to acquire the structure of the transition state. The second group (colored green in Fig. 2) is comprised of those subunits that must also bind to complete complex formation.
Fig. 2.
Schematic representation of the model used to calculate the difference between half-life measured in solution and that at a cell–cell junction. The black springs represent the degrees of freedom associated with molecular reorientation; the molecular subdomains depicted in red bind to acquire the structure of the transition state, and those in green also bind to acquire the structure of the receptor–ligand complex.
We used this model to calculate the free energy barrier associated with forming and breaking receptor–ligand complexes. The half-life of the complex is proportional to exp[Gd/(kBT)], where Gd is the free energy barrier for dissociation (Fig. 1C), kB is Boltzmann’s constant, and T is absolute temperature. Thus, by computing the free energy barrier for cases where the rigid-body motions of receptors and ligands are constrained vs. that where they are relatively unconstrained, we can obtain the ratio of the effective half-life of receptor–ligand complexes at a cell–cell junction to that measured using soluble molecules.
To obtain analytical formulas for the pertinent free energies, we simplified the model further in a way that still captures the essential biological phenomena. We assume that conformational adjustments that occur during association involve relatively modest deformations of individual chemical bonds. When deformations are modest, they mainly involve changes in dihedral angles that can be related to a few modes or degrees of freedom (39). The energetic costs of pushing or pulling on a molecular degree of freedom can then be treated as extending or compressing a spring [harmonic approximation (40–43)]. So, we consider the various parts of our model (Fig. 2) for receptor and ligand molecules to be connected by springs that can be deformed. The values of the spring constants define whether it is easy or difficult to deform a particular degree of freedom. Conformationally rigid subdomains correspond to a large value of the spring constant (stiff spring). For ease of displaying the formulas that we have derived, the spring constants that describe the relative rigidity of the individual molecular subdomains that bind in the transition state structure are set to be equal.
The way we determine the free energy barriers associated with receptor–ligand binding is to compute the partition functions in the free, bound, and transition states for our model system (44). The free energy barrier for receptor–ligand dissociation (directly related to half-life as noted above) is given by the following expression: Gd = −kBT ln[Z′/Z″], where Z′ and Z″ are the partition functions corresponding to the transition and bound states, respectively. A detailed derivation of the partition functions, free energy barriers, and half-lives is provided in Methods.
Results
The analysis presented in Methods ultimately leads to the following relationship between that half-life of a receptor–ligand complex in the cell–cell environment (t1/22d) and that measured using soluble molecules (t1/23d):
where B is a constant that increases with the rigidity of the molecular subdomains that undergo conformational adjustments en route to the transition state, A is a constant that is approximately equal to unity if most conformational changes occur en route to the transition state structure rather than in the final phase of complex formation, and ΔCp is the change in specific heat capacity upon formation of the receptor–ligand complex. For simplicity, we focus on the situation A ∼ 1, because experiments suggest that most conformational adjustments do occur in the association phase for TCR–pMHC binding (26).
Eq. 1 provides a prescription for relating receptor–ligand half-life in the cellular environment to molecule-specific quantities that can be measured in experiments carried out in solution. It makes clear that if the molecular subdomains involved in conformational adjustments are relatively flexible (small value of B), and hence easy to deform, differences in the half-life between a cell–cell junction and solution are negligible (because the exponential of a small number is approximately unity). However, if these degrees of freedom are not very flexible, the difference between the half-life in solution and at a cell–cell junction is directly related to the change in specific heat upon formation of a receptor–ligand complex.
These consequences of Eq. 1 are consistent with, and provide explanations for, experimental data on the response of T cells to different pMHC ligands (26). It is important to note that all measurements of half-life in this study were carried out with one of the receptor–ligand pairs in solution and the other tethered to a substrate in a way that may be equivalent to being in solution. The stimulatory response of T cells was measured with live T cells and immobilized pMHC molecules as in the in vivo situation where membrane constraints are important. As noted earlier, some pMHC ligands were more stimulatory than their half-lives in solution would warrant. Eq. 1 would suggest that these outliers have relatively inflexible molecular subdomains (large B) and a large negative change in specific heat capacity upon TCR–pMHC complexation because this would make the factor exp[−BΔCp] greater than unity. This would lead to a larger effective half-life of the TCR–pMHC complex at a cell–cell junction and a concomitant increase in its ability to stimulate signaling and gene transcription in T cells.
Two of the outliers, labeled K2-IEk and K3-IEk in ref. 26, are obtained by mutating residues on the wild-type peptide (called MCC-IEk). Consistent with Eq. 1, measurements show that TCR binding to K2-IEk and K3-IEk results in much larger negative changes in specific heat capacity compared with MCC. The crystal structure of K3-IEk shows that the conformation of the p5-Lys (a major contact residue, crucial for stimulation) is more rigid compared with that of MCC-IEk (26, 45). The p5-Lys in K3 engages a neighboring p3-Tyr, allowing the lysine residue to form extensive van der Waals contacts with the tyrosine residue. This stable conformation is harder to deform in order for the TCR to engage the amino group of the lysine. This structural feature indicates that, in accordance with Eq. 1, the relevant molecular subdomains that must undergo conformational transitions are relatively rigid in K3-IEk, and it has a large negative change in specific heat capacity upon binding. Thus, the effective half-life of the 2B4 TCR complex with this pMHC is larger at the cell–cell junction compared with measurements using soluble molecules. Hence, it is more stimulatory than measurements of half-life in solution would suggest.
It is interesting to note that another peptide, K5-IEk, also has a larger negative change in specific heat capacity upon binding compared with the wild-type (MCC) (26). Although the specific heat capacity change is smaller than for K3-IEk, one would still expect this peptide to be an outlier in correlations of T cell response to half-lives measured using soluble molecules. However, experimental data for this peptide fit such correlations reasonably well. Eq. 1 suggests that this implies that molecular subdomains in the K5-IEk peptide that are involved in binding TCR are more flexible than those of the K3-IEk peptide. The resulting small value of B (see Eq. 1) would make the effective half-life at a cell–cell junction similar to that measured in solution despite a relatively large negative change in specific heat capacity. Indeed the crystal structures show that the K5-IEk p5-Lys is less stable (more flexible) than K3-IEk p5-Lys because K5-IEk p5-Lys does not possess the extensive van der Waals contacts with a neighboring side chain (26).
The discussion above suggests that proper accounting of molecular flexibility effects results in a formula (Eq. 1) that relates the effective half-life at a cell–cell junction to that measured in solution and molecular thermodynamic properties. Our results also provide a mechanistic and thermodynamic underpinning for the finding that T cell response correlates with some combination of the half-lives of receptor–ligand complexes and thermodynamic properties measured in solution (26). To test the veracity of these ideas further, and to demonstrate the utility of Eq. 1, we assume that the T cell response strictly correlates with TCR–pMHC half-life at a cell–cell junction and use Eq. 1 to relate the half-life at a cell–cell junction to that measured using soluble molecules. This operation leads us to the following expression relating T cell responsiveness to measurable quantities:
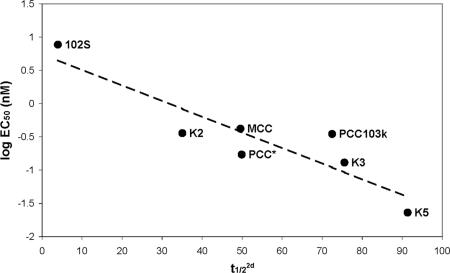
In Eq. 2, Pi are parameters that are fit to the experimental data. In addition to the specific molecular effects we have considered, the values of the parameters also are influenced by the effects of 2D confinement that apply generically to all systems (8). Fig. 3 shows that Eq. 2 fits experimental data for the response of 2B4 T cells to different ligands well. This correlation indicates that the origin of the anomalous behavior of some pMHC ligands [and the surprising correlation of T cell stimulation potential with changes in specific heat (26)] is that the effects of molecular flexibility on free energy changes that determine half-life are manifested differently at a cell–cell junction compared with that in solution.
Fig. 3.
Experimental data on the ability of different pMHC ligands to stimulate T cells fits Eq. 2 well. The ordinate is the logarithm of the concentration (EC50) of a particular ligand that yields 50% maximal production of the cytokine (IL-2) and is a measure of T cell activation potency. The abscissa is the half-life (t1/22d) at a cell–cell junction calculated using Eq. 2. Values of the half-life measured using soluble molecules were obtained from ref. 26. The various peptides (bound to IEk) that were studied are labeled. The values of the parameters that correspond to the best fit line are as follows: P1 = 0.7436, P2 = −0.0235, and P3 = −0.5107. The identity of each ligand is described in ref. 26.
Fig. 3 also demonstrates the utility of Eq. 1. Measurements of the half-life of receptor–ligand complexes at a cell–cell junction are technically very difficult. Eq. 1 provides a simple way to relate this half-life pertinent to cellular response to the half-life and thermodynamic properties in solution, quantities that are much simpler to measure.
Discussion
Cell–cell interactions mediated by receptor–ligand binding are crucial and ubiquitous in biology. Thus, there has been, and continues to be, much interest in understanding how receptor–ligand interactions are modulated in the unique environment of an intercellular junction (1–7). Here, we have described a facet that had not been understood before. Differences between the half-life of receptor–ligand complexes at a cell–cell junction and that measured using soluble molecules depends on the molecular characteristics of specific receptors and ligands. Compared with binding in solution, at a cell–cell junction, conformational adjustments leading to the transition state can be mediated by greater changes in the coordinates of molecular subdomains rather than changes in molecular orientation. This is because changes in molecular orientation are energetically facile in solution but are highly constrained in the cell membrane. This change in reaction coordinate raises the free energy of the transition state if the molecular subdomains that participate in binding are relatively inflexible. This in turn makes the free energy barrier for dissociation, and consequently the effective half-life, longer at a cell–cell junction compared with that measured using soluble molecules. Thus, receptors/ligands with relatively rigid molecular subdomains that undergo substantial conformational rearrangements during binding will be functionally more stimulatory than measurements with soluble molecules would suggest.
These ideas fit well with the experimental data on T cell activation and provide a unified framework that should extend to other receptor–ligand interactions across cell–cell interfaces as well (1–7). The prescription we have presented (Eq. 1) could be used in these diverse situations to incorporate the differential effects of molecular flexibility in the cellular environment and that in solution and enable correlation of cell response to the effective half-life in the cellular environment. This may obviate debates regarding “anomalies” that could be understood from this perspective alone. We hope that our finding will motivate the vigorous pursuit of experimental data on the theromodynamics of receptor–ligand binding and its relationship to functional responses in different cell types because these data are not available.
Further elaboration and understanding of the differing roles of molecular flexibility at a cell–cell junction and in solution may require detailed accounting of effects not included in this work [e.g., hydrophobic effects (46), issues related to differential ordering of water in bound and unbound molecules (47), etc.]. There is some evidence that such effects could be important. In Fig. 3, we used half-life data measured in solution at 25°C because direct measurements are available at that temperature. If we use values obtained by extrapolation to 37°C, the results are qualitatively the same, but MCC also becomes an outlier in correlations with half-life measured in solution, indicating that hydrophobic (or other) effects could be important for this peptide. Detailed atomistic simulations of parts of receptor–ligand complexes in water may prove useful in this regard (48).
Methods
Calculation of the Partition Functions.
A differential change in molecular coordinates is represented by
 |
where X, Y, and Z are the displacements of the orientational (shaft) degrees of freedom in the three spatial directions; xi, yi, and zi are displacements in three spatial directions of the n parts that correspond to the molecular subdomains that must dock in to a particular position to acquire the structure of the transition state; and xp, yp, and zp are displacements of the additional m parts that must be in particular positions in the final bound complex.
The partition function of the unbound state (Z) is given by
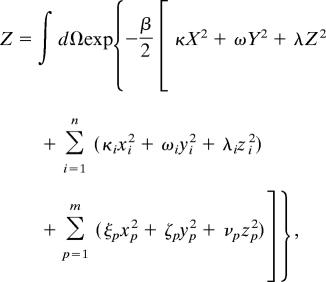 |
where κ(ω, λ), κi(ωi, λi), and ξp(ζp, νp) correspond to the spring constants that describe the relative flexibility characterizing motion of the external shaft, first group of internal molecular components, and second group of internal molecular components in the x (y, z) direction, respectively. β = 1/kBT, with T being absolute temperature and kB is Boltzmann’s constant.
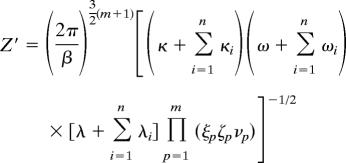
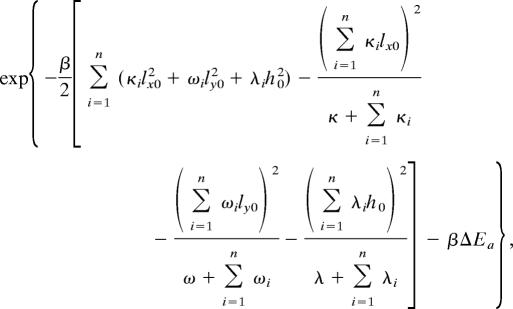
The partition function of the transition state (Z′) is given by
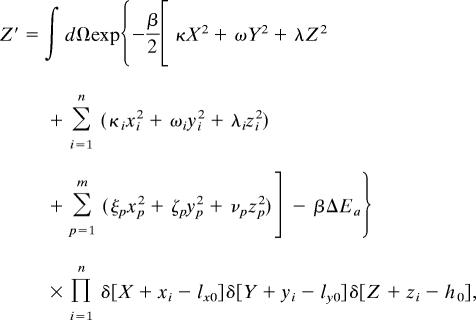 |
where lx0(ly0, h0) are the x (y, z) coordinates of the position that must be acquired by each of the n molecular components that bind in the transition state. This constraint is embodied in the δ-functions.
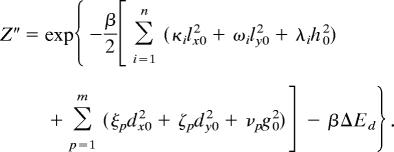
The partition function of the bound complex (Z″) is given by
 |
where dx0(dy0, g0) are the x (y, z) coordinates of the position that must be acquired by each of the additional m components that bind in the bound complex. This constraint is embodied in the δ-functions. The expressions for Z′ and Z″ also contain ΔEa and ΔEd, which are the changes in energy upon reaching the transition state from the initial state and reaching the final state from the transition state, respectively.
The Gaussian integrals in each of these expressions for the partition functions can be computed exactly, and the resulting formulas are shown below.
 |
 |
 |
 |
Calculation of the Free Energy Barriers and Half-Lives.
The difference in the free energy barrier for receptor–ligand dissociation in solution compared with a cell–cell junction is obtained by calculating this quantity for two different values of the spring constants (κ, ω, and λ) that define the degree to which the 3D movement of the receptor/ligand as a whole is constrained. We anticipate that the 3D movements of the entire molecule are essentially unconstrained in solution. So, binding in solution corresponds to a situation where the spring constants resisting rigid-body motion are smaller than those that resist the deformation of the internal molecular components that bind in the transition state and the bound complex. Conversely, at a cell–cell junction, the rigid-body movements are very constrained. Therefore, the molecular subunits that undergo conformational adjustments are more flexible than rigid-body motion in the membrane. Mathematically, we consider the following limit:
 |
Here, κ2d(ω2d, λ2d) and κ3d(ω3d, λ3d) are the spring constants that determine the penalties associated with deforming the external shafts in the x(y, z) direction, in the membrane environment and in solution, respectively. As noted above, for simplicity, we have all κi(ωi, λi) representing spring constants for the molecular subdomains to be equal to each other, and this value is denoted by κ0(ω0, λ0). We find that the difference between the free energy barrier for dissociation in solution and at a cell–cell junction is
where Gd2d and Gd3d are the free energy barriers for dissociation at a cell–cell junction and solution, respectively; n is the number of degrees of freedom (or molecular subdomains) that undergo conformational adjustments to acquire the structure of the transition state; and the quantities in the brackets are various spring constants that resist conformational deformations of the molecular subdomains.
It is important to recognize that the quantity, n, directly reflects the value of a measurable thermodynamic quantity, namely, the change in specific heat upon binding. This is because of the identity (40)
 |
where ΔG equals the free energy difference between the receptor–ligand complex and the unbound state, and m is the number of additional degrees of freedom (molecular subunits) that undergo conformational transitions subsequent to the formation of the transition state to acquire the structure of the bound state. We use the specific heat of complex formation, rather than just dissociation or association alone, because this quantity has been measured and used in correlating T cell response (26). Using the specific heat of complex formation, rather than that associated with dissociation or association alone, simply adds the factor of 3(m + 1)κ/2 in the equation above. If most conformational adjustments occur en route to the transition state (26), this factor is not significant.
These equations can be used to obtain the relationship between the effective half-life of a receptor–ligand complex in solution and that at a cell–cell junction. This is because the two quantities are related by the following relationship:
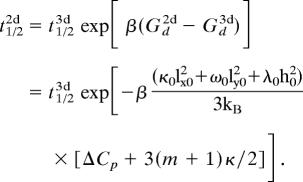 |
In writing the second equality above, we have used the formulas for the free energy barriers and that for the specific heat change upon binding.
Supplementary Material
Acknowledgments
We thank M. Karplus for insightful comments. S.Q. was supported by the QB3 Institute at the University of California, Berkeley. A.K.C. is supported by the National Institutes of Health and Defense Advanced Research Planning Agency, M.M.D. is supported by the National Institutes of Health and the Howard Hughes Medical Institute, and M.K. was supported by the Alfred Benzon Foundation and the Danish Medical Research Council.
Abbreviations
- pMHC
peptide–MHC
- TCR
T cell receptor for antigen.
Footnotes
See Commentary on page 4335.
References
- 1.Luscinskas F. W., Ma S., Nusrat A., Parkos C. A., Shaw S. K. Semin. Immunol. 2002;14:105–113. doi: 10.1006/smim.2001.0347. [DOI] [PubMed] [Google Scholar]
- 2.Pasquale E. B. Nat. Rev. Mol. Cell Biol. 2005;6:462–475. doi: 10.1038/nrm1662. [DOI] [PubMed] [Google Scholar]
- 3.Nagata S. Annu. Rev. Genet. 1999;33:29–55. doi: 10.1146/annurev.genet.33.1.29. [DOI] [PubMed] [Google Scholar]
- 4.Schwab M. E. Curr. Opin. Neurobiol. 2004;14:118–124. doi: 10.1016/j.conb.2004.01.004. [DOI] [PubMed] [Google Scholar]
- 5.Mckerracher L., Winton M. J. Neuron. 2002;36:345–348. doi: 10.1016/s0896-6273(02)01018-8. [DOI] [PubMed] [Google Scholar]
- 6.Huber A. B., Kolodkin A. L., Ginty D. D., Cloutier J.-F. Annu. Rev. Neurosci. 2003;26:509–563. doi: 10.1146/annurev.neuro.26.010302.081139. [DOI] [PubMed] [Google Scholar]
- 7.Carman C. V., Springer T. A. Curr. Opin. Cell Biol. 2003;15:547–556. doi: 10.1016/j.ceb.2003.08.003. [DOI] [PubMed] [Google Scholar]
- 8.Bell G. I. Science. 1978;200:618–627. doi: 10.1126/science.347575. [DOI] [PubMed] [Google Scholar]
- 9.Saterbak A., Lauffenburger D. A. Biotechnol. Prog. 1996;12:682–699. doi: 10.1021/bp960061u. [DOI] [PubMed] [Google Scholar]
- 10.Dustin M. L., Ferguson L. M., Chan P. Y., Springer T. A., Golan D. E. J. Cell Biol. 1996;132:465–474. doi: 10.1083/jcb.132.3.465. [DOI] [PMC free article] [PubMed] [Google Scholar]
- 11.Dustin M. L., Golan D. E., Zhu D. M., Miller J. M., Meier W., Davies E. A., van der Merwe P. A. J. Biol. Chem. 1997;272:30889–30898. doi: 10.1074/jbc.272.49.30889. [DOI] [PubMed] [Google Scholar]
- 12.Li P., Selvaraj P., Zhu C. Biophys. J. 1999;77:3394–3406. doi: 10.1016/S0006-3495(99)77171-7. [DOI] [PMC free article] [PubMed] [Google Scholar]
- 13.Delisi C., Wiegel F. W. Proc. Natl. Acad. Sci. USA. 1981;78:5569–5572. doi: 10.1073/pnas.78.9.5569. [DOI] [PMC free article] [PubMed] [Google Scholar]
- 14.Davis M. M., Boniface J. J., Reich Z., Lyons D., Hampl J., Arden B, Chien Y. H. Annu. Rev. Immunol. 1998;16:523–544. doi: 10.1146/annurev.immunol.16.1.523. [DOI] [PubMed] [Google Scholar]
- 15.Germain R. N., Stefanova I. Annu. Rev. Immunol. 1999;17:467–544. doi: 10.1146/annurev.immunol.17.1.467. [DOI] [PubMed] [Google Scholar]
- 16.Gascoigne N. R., Zal T., Alam S. M. Exp. Rev. Mol. Med. 2001;2001:1–17. doi: 10.1017/S1462399401002502. [DOI] [PubMed] [Google Scholar]
- 17.van der Merwe P. A. Immunity. 2001;14:665–668. doi: 10.1016/s1074-7613(01)00155-8. [DOI] [PubMed] [Google Scholar]
- 18.van der Merwe P. A., Davis S. J. Annu. Rev. Immunol. 2003;21:659–684. doi: 10.1146/annurev.immunol.21.120601.141036. [DOI] [PubMed] [Google Scholar]
- 19.Al-Ramadi B. K., Jelonek M. T., Boyd L. F., Margulies D. H., Bothwell A. L. J. Immunol. 1995;155:662–673. [PubMed] [Google Scholar]
- 20.Alam S. M., Travers P. J., Wung J. L., Nasholds W., Redpath S., Jameson S. C., Gascoigne N. R. Nature. 1996;381:616–620. doi: 10.1038/381616a0. [DOI] [PubMed] [Google Scholar]
- 21.Kersh G. J., Kersh E. N., Fremont D. H., Allen P. M. Immunity. 1998;9:817–826. doi: 10.1016/s1074-7613(00)80647-0. [DOI] [PubMed] [Google Scholar]
- 22.Sykulev Y., Vugmeyster Y., Brunmark A., Ploegh H. L., Eisen H. N. Immunity. 1998;9:475–483. doi: 10.1016/s1074-7613(00)80631-7. [DOI] [PubMed] [Google Scholar]
- 23.Baker B. M., Gagnon S. J., Biddison W. E., Wiley D. C. Immunity. 2000;13:475–484. doi: 10.1016/s1074-7613(00)00047-9. [DOI] [PubMed] [Google Scholar]
- 24.Degano M., Garcia K. C., Apostolopoulos V., Rudolph M. G., Teyton L., Wilson I. A. Immunity. 2000;12:251–261. doi: 10.1016/s1074-7613(00)80178-8. [DOI] [PubMed] [Google Scholar]
- 25.Kalergis A. M., Boucheron N., Doucey M. A., Palmieri E., Goyarts E. C., Vegh Z., Luescher I. F., Nathenson S. G. Nat. Immunol. 2001;2:229–234. doi: 10.1038/85286. [DOI] [PubMed] [Google Scholar]
- 26.Krogsgaard M., Prado N., Adams E. J., He X.-L., Chow D.-C., Wilson D. B., Garcia K. C., Davis M. M. Mol. Cell. 2003;12:1367–1378. doi: 10.1016/s1097-2765(03)00474-x. [DOI] [PubMed] [Google Scholar]
- 27.Spolar R. S., Record M. T. Science. 1994;263:777–784. doi: 10.1126/science.8303294. [DOI] [PubMed] [Google Scholar]
- 28.Privalov P. L., Jelesarov I., Read C. M., Dragan A. I., Crane-Robinson C. J. Mol. Biol. 1999;294:997–1013. doi: 10.1006/jmbi.1999.3285. [DOI] [PubMed] [Google Scholar]
- 30.Liggins J. R., Privalov P. L. Proteins. 2000;4(Suppl.):50–62. doi: 10.1002/1097-0134(2000)41:4+<50::aid-prot50>3.3.co;2-8. [DOI] [PubMed] [Google Scholar]
- 30.Myszka D. G., Sweet R. W., Hensley P., Brigham-Burke M., Kwong P. D., Hendrickson W. A., Wyatt R., Sodroski J., Doyle M. L. Proc. Natl. Acad. Sci. USA. 2000;97:9026–9031. doi: 10.1073/pnas.97.16.9026. [DOI] [PMC free article] [PubMed] [Google Scholar]
- 31.Sykulev Y., Brunmark A., Tsomides T. J., Kageyama S., Jackson M., Peterson P. A., Eisen H. N. Proc. Natl. Acad. Sci. USA. 1994;91:11487–11491. doi: 10.1073/pnas.91.24.11487. [DOI] [PMC free article] [PubMed] [Google Scholar]
- 32.Wilkinson J. C., Stein R. A., Guyer C. A., Beechem J. M., Staros J. V. Biochemistry. 2001;40:10230–10242. doi: 10.1021/bi010705t. [DOI] [PubMed] [Google Scholar]
- 33.Boniface J. J., Reich Z., Lyons D. S., Davis M. M. Proc. Natl. Acad. Sci. USA. 1999;96:11446–11451. doi: 10.1073/pnas.96.20.11446. [DOI] [PMC free article] [PubMed] [Google Scholar]
- 34.Wu L. C., Tuot D. S., Lyons D. S., Garcia K. C., Davis M. M. Nature. 2002;418:552–556. doi: 10.1038/nature00920. [DOI] [PubMed] [Google Scholar]
- 35.Willcox B. E., Gao G. F., Wyer J. R., Ladbury J. E., Bell J. I., Jakobsen B. K., van der Merwe P. A. Immunity. 1999;10:357–365. doi: 10.1016/s1074-7613(00)80035-7. [DOI] [PubMed] [Google Scholar]
- 36.Szwajkajzer D., Carey J. Biopolymers. 1997;44:181–198. doi: 10.1002/(SICI)1097-0282(1997)44:2<181::AID-BIP5>3.0.CO;2-R. [DOI] [PubMed] [Google Scholar]
- 37.Rudolph M. G., Wilson I. A. Curr. Opin. Immunol. 2002;14:52–65. doi: 10.1016/s0952-7915(01)00298-9. [DOI] [PubMed] [Google Scholar]
- 38.Rudolph M. G., Luz J. G., Wilson I. A. Annu. Rev. Biophys. Biomol. Struct. 2002;31:121–149. doi: 10.1146/annurev.biophys.31.082901.134423. [DOI] [PubMed] [Google Scholar]
- 39.Ma J., Karplus K. J. Proc. Natl. Acad. Sci. USA. 1998;95:8502–8507. doi: 10.1073/pnas.95.15.8502. [DOI] [PMC free article] [PubMed] [Google Scholar]
- 40.Hill T. L. An Introduction to Statistical Thermodynamics. Reading, MA: Addison–Wesley; 1960. [Google Scholar]
- 41.Go N., Scheraga H. A. Macromolecules. 1976;9:535–542. [Google Scholar]
- 42.Levy R. M., Karplus M. Biopolymers. 1979;18:2465–2495. [Google Scholar]
- 43.Brooks B., Karplus M. Proc. Natl. Acad. Sci. USA. 1983;80:6571–6575. doi: 10.1073/pnas.80.21.6571. [DOI] [PMC free article] [PubMed] [Google Scholar]
- 44.Van Kampen N. G. Stochastic Processes in Physics and Chemistry. Amsterdam: Elsevier Science; 2003. [Google Scholar]
- 45.Fremont D. H., Dai S., Chiang H., Crawford F., Marrack P., Kappler J. J. Exp. Med. 2002;195:1043–1052. doi: 10.1084/jem.20011971. [DOI] [PMC free article] [PubMed] [Google Scholar]
- 46.Chandler D. Nature. 2005;437:640–647. doi: 10.1038/nature04162. [DOI] [PubMed] [Google Scholar]
- 47.Anikeeva N., Lebedeva T., Krogsgaard M., Tetin S. Y., Martinez-Hackert E., Kalams S. A., Davis M. M., Sykulev Y. Biochemistry. 2003;42:4709–4716. doi: 10.1021/bi026864+. [DOI] [PubMed] [Google Scholar]
- 48.Michielin O., Karplus M. J. Mol. Biol. 2002;324:547–569. doi: 10.1016/s0022-2836(02)00880-x. [DOI] [PubMed] [Google Scholar]
Associated Data
This section collects any data citations, data availability statements, or supplementary materials included in this article.


