


Abstract
Transposons are widely employed as tools for gene disruption. Ideally, they should display unbiased insertion behavior, and incorporate readily into any genomic DNA to which they are exposed. However, many transposons preferentially insert at specific nucleotide sequences. It is unclear to what extent such bias affects their usefulness as mutagenesis tools. Here, we examine insertion site specificity and global insertion behavior of two mini-transposons previously used for large-scale gene disruption in Saccharomyces cerevisiae: Tn3 and Tn7. Using an expanded set of insertion data, we confirm that Tn3 displays marked preference for the AT-rich 5 bp consensus site TA[A/T]TA, whereas Tn7 displays negligible target site preference. On a genome level, both transposons display marked non-uniform insertion behavior: certain sites are targeted far more often than expected, and both distributions depart drastically from Poisson. Thus, to compare their insertion behavior on a genome level, we developed a windowed Kolmogorov–Smirnov (K–S) test to analyze transposon insertion distributions in sequence windows of various sizes. We find that when scored in large windows (>300 bp), both Tn3 and Tn7 distributions appear uniform, whereas in smaller windows, Tn7 appears uniform while Tn3 does not. Thus, both transposons are effective tools for gene disruption, but Tn7 does so with less duplication and a more uniform distribution, better approximating the behavior of the ideal transposon.
INTRODUCTION
Transposons are widely used tools in biology, frequently utilized for insertion mutagenesis, large-scale gene disruption studies and gene tagging (1). Transposon-mediated gene disruption experiments and promoter traps rely on promiscuous, undirected and pseudo-random insertion of the transposon. An optimal transposon should display neither sequence bias nor preferential insertion, and should be equally likely to integrate at any genomic point to which it is exposed. In actuality, many transposons have a native proclivity for certain sequence features, and tend to favor specific insertion sites. Therefore, when employing transposons as genomic tools, it makes sense to select one that approximates ideal behavior: characterized by promiscuous and unbiased insertion, yielding a uniform distribution.
Despite their widespread use, studies analyzing the insertion bias of transposons remain rare. In 1995, Davies and Hutchison (2) examined Tn3 insertion specificity across 223 sites, uncovering a 19 bp consensus sequence. Recently, several studies have shown the importance of DNA flexibility to transposon insertion (3–5). In this work, we directly compare two transposons acting upon the same genomic DNA. We examine the insertion specificity of mini-Tn3 and mini-Tn7 in a Saccharomyces cerevisiae genomic library, explore insertion site specificity and employ a windowed Kolmogorov–Smirnov (K–S) analysis to characterize their distribution at a chromosomal and genomic level.
Previously, we reported the use of large-scale shuttle mutagenesis to generate S.cerevisiae genomic insertion libraries with two distinct bacterial transposon systems (6). The Tn3 insertion library was created via in vivo mutagenesis in Escherichia coli of a plasmid-based library of yeast genomic DNA. Despite screening over 150 000 unique Tn3 insertions, this process yielded 10 174 sequence alleles affecting only 2553 distinct yeast genes, <50% of the ∼5800 predicted total genes. The second insertion library was generated with the same genomic DNA library, using a modified bacterial Tn7 transposon, which exhibits minimal target site selectivity (7). Whereas wild-type Tn7 incorporates into specific genomic sites in E.coli, our Tn7 transposon uses a modified transposase, which catalyzes nonspecific insertion into a wide-range of genomic sites in vivo and in vitro (8). This mini-Tn7 transposon was used to perform in vitro mutagenesis on the yeast plasmid genomic library, this time yielding 7176 insertion alleles affecting 2613 genes (9).
Previous work has shown that Tn3 incorporates preferentially at the relatively strong AT-rich 5mer consensus site TA[A/T]TA (2,9), whereas the modified Tn7 employed here has virtually no consensus sequence driving preferential insertion (7). While neither transposon achieved full genomic coverage in S.cerevisiae, these large datasets permit a careful analysis and comparison of insertion site specificity and global insertion behavior of the multipurpose Tn3 and mini-Tn7 transposons. Here, we compare the insertion behavior of the Tn3 and Tn7 transposons to determine which best minimizes insertion bias, and carries the greatest potential for random and promiscuous insertion into a large genetic library.
In this comparative analysis of Tn3 and Tn7 insertion performance, we find that both transposons display non-uniform insertion behavior that departs from the ideal Poisson distribution. To analyze this behavior in biologically meaningful terms, we apply a windowing procedure, assigning a binary score to insertions in a given region and analyzing genomic distributions with the Kolmogorov–Smirnov (K–S) test. This windowed K–S analysis reveals that, when considering large sequence windows, Tn3 and Tn7 distributions are both indistinguishable from uniform; in smaller windows however, Tn7 appears uniform while Tn3 does not. Thus, Tn7 is more promiscuous and displays less biased insertion behavior overall—behavior likely due to its lack of strong target site preference. These results carry implications for the design and execution of large-scale gene disruption studies, and the windowed K–S test employed here is a useful approach for assessing distributions of sites of interest on a genome level.
MATERIALS AND METHODS
Insertion sets
Transposon insertion sets were compiled as tab-delimited text documents, recording the unique experimental insertion identifier, the sequence adjacent to the transposon insertion (obtained by sequencing outwards from the incorporated transposon), the exact chromosomal coordinate of the insertion (obtained by local BLAST (10) run on the aforementioned sequence against SGD S.cerevisiae full chromosomal DNA, release 4/13/2005 (11); BLAST cutoff E-value e = 1 × 10⁻⁸, no filtering of low-complexity regions) and the chromosome of insertion.
Normalized insertion set
Some analyses demand that we consider equal-sized sets of insertions. For these analyses, a subset of 8556 Tn3 insertions was selected at random from the full set, to be compared alongside the 8556 Tn7 insertions. This subset is referred to as Tn3_8556.
Insertion points and flanking regions
The transposon insertion point was identified from sequence recovered from successful insertion strains, and designated as the genomic nucleotide immediately 5′ of the incorporated Tn sequence. For analysis of insertion regions, a 41 nt region was taken for each recorded insertion, comprising the insertion point and ±20 bp flanking region.
Multiple sequence alignments of a conserved ±20 bp region surrounding each insertion point were generated with scripts coded in Perl. Consensus sequences were visualized with Sequence Logo analysis using WebLogo (12,13).
RDN1 locus omitted from chromosome XII
For genomic distribution studies, a genomic region was excluded: chromosome XII:460 000–465 999. This short 6 kb region was hyper-enriched for insertions in both transposons, containing 1333 Tn3 and 578 Tn7 insertions and an abundance of duplicate insertions. This region corresponds to the RDN25 locus, which due to our method of BLAST assignment of insertion sequence to chromosomal coordinates, actually represents all insertions occurring in the highly repeated RDN1 locus (a ∼1–2 Mb segment on the right arm of chromosome XII, consisting of 100–200 tandem copies of a 9.1 kb repeat and containing primarily rRNA genes). This region is not fully mapped, so all insertions recorded in the RDN1 area are assigned by BLAST to the RDN25 locus.
K–S test
The K–S test is a method to determine the likeliness that two given distributions are the result of the same process, or parent distribution.
To test a given distribution against another using K–S, we plot cumulative insertions versus chromosomal / genomic coordinate, and mark the distance D at which the two lines exhibit the greatest separation.
QK–S, which is used to calculate the significance of the D statistic, is:
Probability (D > observed) = QK–S:
| 1 |
where:
| 2 |
QK–S is a monotonic function with the limiting values QK–S (0) = 1 and QK–S (∞) = 0.
In the case of testing one distribution versus uniform, the effective number of observations Ne is simply N, the number of insertions in the region being examined; to test Tn3 versus Tn7, Ne becomes:
| 3 |
Where N1 is the number of Tn3 insertions in the region of interest, and N2 is the number of Tn7 insertions.
Software was created in Perl to process and perform windowing and statistical analyses on these insertions, and graph the results.
RESULTS
Expanding the insertion site collection
We considered an expanded set of 12 109 Tn3 and 9134 Tn7 insertions, versus the 10 174 Tn3 and 7176 Tn7 used in our earlier studies (6,9). Additional insertions considered included those for which sequencing yielded two or more BLAST (10) hits to yeast genomic sequence, which may include insertions into duplicated loci. We excluded any insertion reported at a site with no BLAST match in the yeast genome, since these likely represent sequencing errors or contamination. (All insertions are shown in Supplementary Figure S1.)
Insertions frequently occur at identical genomic coordinates
A substantial fraction of all Tn3 and Tn7 transposon insertions are duplicates: specifically, 21.4% of Tn3 insertions occurred at an identical genomic coordinate to another Tn3 insertion, whereas 10.7% of Tn7 insertions were duplicates (Table 1).
Table 1.
Unique and duplicate insertions
| Tn3 | Tn7 | |
|---|---|---|
| Tn insertions (total) | 12 109 | 9134 |
| Tn insertions (unique) | 9519 | 8156 |
| % unique | 78.6% | 89.3% |
| Tn insertions (duplicate) | 2590 | 978 |
| % duplicate | 21.4% | 10.7% |
Total, unique and duplicate insertion counts and frequencies for Tn3 and Tn7 in the S.cerevisiae genomic DNA library.
Tn3 preferentially inserts at TA[A/T]TA 5mer; Tn7 displays little sequence bias
To examine insertion specificity of the two transposons, we compiled the 41 nt regions surrounding each insertion, assembled sequence alignments for all Tn3 and Tn7 insertions, and produced Sequence Logo (13) consensus diagrams. These were produced for the entire insertion set, and hotspots (loci at which multiple transposon insertions were recorded). For Tn3, 3792 duplicate insertions exist, spread across 1202 unique genomic sites (1202 original + 2590 additional = 3792 total duplicate). Tn7 yields 1716 duplicate insertions at 738 unique sites (738 original + 978 additional = 1716 total duplicate).
Tn3 preferentially incorporates at sites displaying the TA[A/T]TA 5mer. (The final A of this consensus is situated at position 0, the position immediately 5′ of transposon incorporation). The consensus sequence also demonstrates a slight preference for a T/C at position −7 (Figure 1b). The Tn7 transposon displays virtually no sequence bias beyond a slight preference to insert with A or T at position −2 (2 nt 5′ of transposon insertion) (Figure 1d).
Figure 1.

Tn3 and Tn7 Sequence Logos: Whole genome and hotspots. (a) Tn3 hotspot Sequence Logo, calculated using the 1202 target sequences that harbor multiple insertions. (b) Modified Sequence Logo for Tn3 insertion site, calculated using all 12 109 genomic insertions. Consensus sequence: [T/C]xxTA[A/T]TA. Nucleotides colored red are enriched more than 4% in hotspot consensus, while nucleotides colored grey do not differ significantly. (c) Tn7 hotspot Sequence Logo, calculated using the 738 target sequences that harbor multiple insertions. (d) Modified Sequence Logo for Tn7 insertion site, calculated using all 9134 genomic insertions. Consensus sequence: [A/T]. No nucleotides are enriched more than 4% in Tn7 hotspot consensus.
At duplicate insertion sites, Tn3 consenus is enhanced; Tn7 remains weak
The 1202 duplicate Tn3 insertion sites display a stronger [T/C]xxTA[A/T]TA consensus sequence than the master set of Tn3 insertion sites. (Figure 1a). Several consensus positions are strengthened in hotspots, shown in red in Figure 1b. (Relative enrichment values for each position were calculated by subtracting the hotspot consensus from the overall consensus, as shown in Supplementary Figure S2.)
Among Tn7 duplicate insertion sites the central T/A preference remains, but no further consensus emerges (Figure 1c).
Inter-chromosomal variation
For all genomic distribution studies, the RDN1 genomic region was excluded (see Materials and Methods). This reduced the total number of insertions to 10 776 Tn3 and 8556 Tn7. To compare the insertion behavior of Tn3 and Tn7 between chromosomes, we scored the number of insertions on all chromosomes. The results are given in Table 2.
Table 2.
Tn3 and Tn7 insertion distribution across chromosomes
| Chromosome | Size (kb) | Tn3 insertions | Tn3/10 kb | Tn7 insertions | Tn7/10 kb |
|---|---|---|---|---|---|
| I | 230 | 283 | 12.3 | 170 | 7.4 |
| II | 813 | 642 | 7.9 | 563 | 6.9 |
| III | 317 | 265 | 8.4 | 258 | 8.1 |
| IV | 1531 | 1116 | 7.3 | 976 | 6.4 |
| V | 577 | 708 | 12.3 | 483 | 8.4 |
| VI | 270 | 293 | 10.9 | 178 | 6.6 |
| VII | 1090 | 1020 | 9.4 | 867 | 8.0 |
| VIII | 563 | 488 | 8.7 | 341 | 6.1 |
| IX | 439 | 427 | 9.7 | 311 | 7.1 |
| X | 745 | 1036 | 13.9 | 528 | 7.1 |
| XI | 666 | 414 | 6.2 | 352 | 5.3 |
| XII | 1078 | 1072 | 9.9 | 876 | 8.1 |
| XIII | 924 | 722 | 7.8 | 666 | 7.2 |
| XIV | 784 | 687 | 8.8 | 533 | 6.8 |
| XV | 1091 | 830 | 7.6 | 772 | 7.1 |
| XVI | 948 | 773 | 8.2 | 682 | 7.2 |
| GENOME | 12 070 | 10 776 | 8556 |
Tn3 and Tn7 insertions recorded for each S.cerevisiae chromosome, and in the genomic library as a whole. Differences in insertion density between chromosomes are statistically significant within each set (Tn3 X2 = 490, DF = 15, P = 6 × 10−95; Tn7 X2 = 99, DF = 15, P = 2 × 10⁻¹⁴) and Tn3, Tn7 distributions are statistically different from one another (Tn3 X2 = 60.3, DF = 15, P = 2 × 10⁻⁷; Tn7 X2 = 75.9, DF = 15, P = 4×10⁻¹⁰).
Noticeable variation in insertion density exists between chromosomes for each transposon, and this variation is statistically significant (Tn3 χ2 = 490, DF = 15, P = 6 × 10−95; Tn7 χ2 = 99, DF = 15, P = 2 × 10⁻¹⁴). Further, the Tn3 and Tn7 distributions are significantly different from one another as determined by χ2 analysis, comparing each distribution against the sum of the two (Tn3 χ2 = 60.3, DF = 15, P = 2 × 10⁻⁷; Tn7 χ2 = 75.9, DF = 15, P = 4 × 10⁻¹⁰).
To directly compare insertion density between chromosomes, we considered the TN3_8556 subset of randomly selected Tn3 insertions, to yield a total insertion set of equal size to the Tn7 set. The range of variation between chromosomal insertion densities in these equal-sized sets is shown in Figure 2. Inter-chromosomal variation in insertion density is more pronounced in the case of Tn3; in other words, Tn7 insertions are distributed more uniformly between chromosomes.
Figure 2.
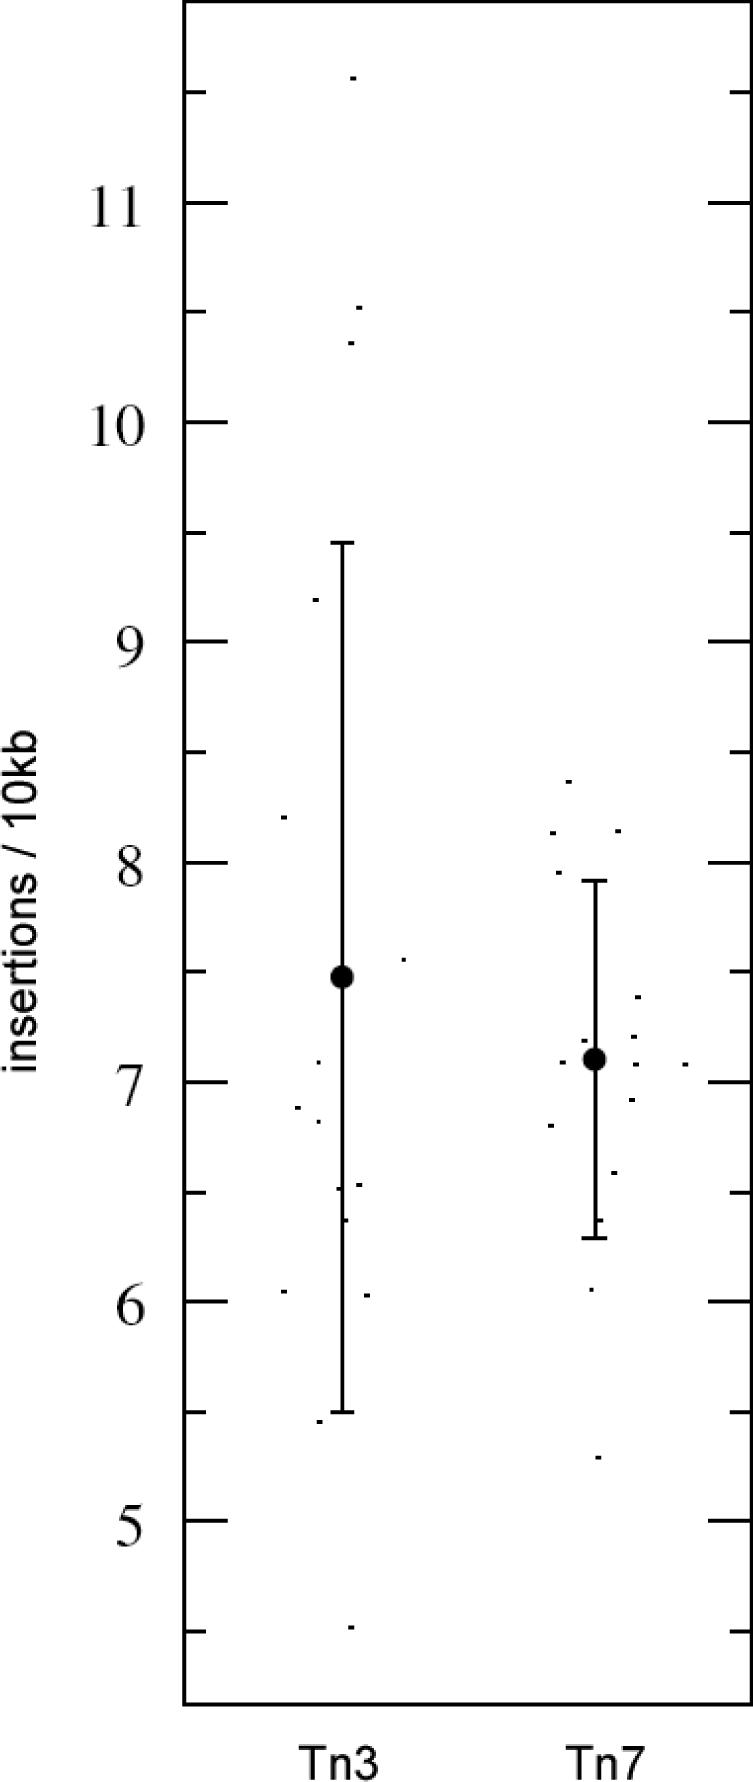
Plot displaying distribution of average insertions per 10 kb for each of the sixteen S.cerevisiae chromosomes. An equal number (8556) of Tn3 and Tn7 insertions were considered. Error bars represent ±σ.
Insertion behavior versus Poisson
We compared the distributions of the Tn3_8556 and Tn7 insertion sets in 0.5, 1 and 3 kb sequence windows. The distribution of hits among these windows is shown in Figure 3, superimposed in each case upon a Poisson distribution.
Figure 3.

Comparison of normalized (8556 insertions each) sets of Tn3 and Tn7. Plots show number of windows (log scale) at each size (a) 3 kb, (b) 1 kb, (c) 0.5 kb that contain a given number of insertions, overlaid with a Poisson distribution.
K–S analysis
We characterized insertion behavior through K–S analysis of genomic insertion distributions. For each transposon, a cumulative distribution was plotted and the maximum distance (D) of this distribution from uniform (the diagonal) was calculated. Given the number of observations N, the significance of this deviation, the P-value, was calculated in the form of a K–S tail probability QK–S. A QK–S > 0.05 indicates that the null hypothesis cannot be disproved, and the distribution of insertions is indistinguishable from a uniform distribution.
The genomic K–S tail probability values are QK–S = 0.00 for Tn3, and QK–S = 0.05 for Tn7. The cumulative distribution is shown in Figure 4.
Figure 4.

Cumulative insertions across entire genome (12.1 Mb). Distribution of all Tn3 (red, 10 776 insertions) and Tn7 (green, 8556 insertions) insertions across all sixteen chromosomes: (a) Insertions were tallied and the cumulative count (y) was plotted against chromosomal coordinate (x). Horizontal plateaus represent cold-spots, long stretches of genomic material with no scored insertions; steep vertical areas represent hotspots, with many insertions clustered in a localized area. For the region shown, the Tn3 insertion patterns differs significantly from expected (uniform, shown as diagonal) with QK–S = 0.00, whereas Tn7 is indistinguishable from uniform (QK–S = 0.05).
The K–S analyses were repeated on a subset of Tn3 and Tn7 insertions representing only unique insertions (i.e. no site hit more than once). The exclusion of duplicate insertions did not significantly alter distribution profiles or QK–S statistics (data not shown).
Windowed K–S analysis
The DNA sequence for each chromosome was divided into regions of a given size, and a binary score assigned to each: 1 to any region containing one or more insertions, and 0 to a region devoid of insertions (see schematic, Figure 5).
Figure 5.

Windowing procedure for K–S. (a) Transposon insertions (green) lie along a stretch of genomic sequence (blue). (b) Dividing this sequence into eight equally-sized windows and assigning a binary value to insertions in this region yields a more uniform insertion density; half of all possible windows contain at least one insertion. (c) Region divided into four windows; now, only one window contains no insertions (‘cold-spot’). (d) As windows grow in length, the insertion distribution approaches uniform.
Figure 6 illustrates the cumulative distribution of Tn3 and Tn7 insertions for chromosome I at six distinct window sizes.
Figure 6.

Insertion behavior at various window sizes, chromosome I (230 kb). Distribution of all Tn3 (red) and Tn7 (green) insertions across chromosome I, at different window sizes as shown. Notice the y-axis of total counts per chromosome is changed between windows, since multiple insertions within any window count as a single insertion event. As window size is increased, both Tn3 and Tn7 distributions appear more uniformly distributed. (a) No windowing: QK–S(Tn3) = 0.00, QK–S(Tn7) = 0.00. (b) Window = 100 bp: QK–S(Tn3) = 0.00, QK–S(Tn7) = 0.00. (c) Window = 200 bp: QK–S(Tn3) = 0.00, QK–S(Tn7) = 0.00. (d) Window = 500 bp: QK–S(Tn3) = 0.00, QK–S(Tn7) = 0.01. (e) Window = 1000 bp: QK–S(Tn3) = 0.06, QK–S(Tn7) = 0.10. (f) Window = 3000 bp: QK–S(Tn3) = 0.56, QK–S(Tn7) = 0.53.
Since window size clearly affects insertion distribution, we computed QK–S for these six window sizes. Figure 7 presents the QK–S statistics for a single insertion distribution viewed at various window sizes. The QK–S = 0.05 threshold is shown by a dotted line; any point above this threshold represents a distribution of transposon insertions which is not significantly different from uniform.
Figure 7.

Whole genome QK–S versus window size. K–S tail probabilities (QK–S) for Tn3 (red) and Tn7 (green) at various window sizes. Points correspond to the genomic QK–S values at each window size. The QK–S = 0.05 threshold is shown as a dotted line; points above this line are distributions indistinguishable from uniform, whereas points below this line correspond to distributions significantly different from uniform.
In addition to testing each distribution against uniform, we also performed a two-sided K–S to test the Tn3 distribution against that of Tn7. Results showed that with no windowing, Tn3 and Tn7 distributions are significantly different from one another on all but two chromosomes (VII and XIV), while at window = 300 bp they are indistinguishable on all chromosomes (data not shown).
Differential targeting: sequence analysis
To explore possible sequence causes for the distinct insertion behavior of Tn3 and Tn7, the genome was partitioned into 12 075 windows of 1 kb each. These were scored according to whether Tn3 or Tn7 insertions were found within each kilobase of sequence. Four subsets (None, Tn7 only, Tn3 only, Both) were generated, as well as three randomly selected subsets of 1500 windows each.
The relative population of windows targeted by Tn3 and Tn7 is given in Figure 8a. GC content, and incidence of the TA[A/T]TA 5mer per 1 kb of sequence across these subsets is given in Figure 8b. Dinucleotide frequencies in the four main subsets is given in Figure 8c. The total dinucleotide and trinucleotide counts within the 1 kb regions comprising all subsets were evaluated against expected counts by χ2 analysis; significant differences were found within the four main subsets, and two of the three randomly selected subsets (Figure 8d).
Figure 8.

(a) Distribution of dinucleotide frequencies assessed across 1 kb windows. Four genomic subsets are shown. From left to right: none (windows in which neither Tn3 nor Tn7 insertions are found: 7225 windows total); Tn7 only (windows in which only Tn7 insertions are found: 2045 windows total); Tn3 only (windows in which only Tn3 insertions are found: 1258 windows total); Both (windows in which both Tn3 and Tn7 insertions are found: 1547 windows total). (b) Table of GC content and incidence of TA[A/T]TA 5mers/1 kb in these subsets and in the genome as a whole. (c) Venn diagram illustrating complementarity in coverage of 1 kb windows (12 075 windows total). (d) Results of X2 test on dinucleotide and trinucleotide counts in each of the four main subsets and three randomly selected subsets.
Library bias assessment
To characterize regions of the yeast genomic library that were ignored by both Tn3 and Tn7, we tabulated all insertion points for both Tn3 and Tn7, and recorded all contiguous regions above 6 kb in size lacking any insertion of either type. Since the average size of fragments in our library is 3 kb, any single insertion was taken to suggest that a 6 kb region (extending 3 kb upstream and downstream from the insertion) was potentially present in the library (Figure 9).
Figure 9.

Schematic illustration of excluded regions. A schematic illustration of the first ∼100 kb of chromosome XII: regions possibly underrepresented in our genomic library were identified as contiguous, extended cold-spots of at least 6 kb where neither Tn3 nor Tn7 insertions occurred. These regions are shown in yellow, above. Tn3 insertions are shown in red, Tn7 insertions are green.
Table 3 gives the results of these analyses. On a genomic scale, 135 regions of 6 kb or greater contain neither Tn3 nor Tn7 insertions. These regions total 1 329 147 bp, or over 10% of the yeast genome. The average length of these regions is 9846 bp, the average percent of bases in these regions encoding known genes is 59.7%, and the longest contiguous cold region is a 22 184 bp span situated on chromosome II (coordinates 425 089–447 273). These are the regions most likely underrepresented in our genomic library.
Table 3.
Regions >6 kb devoid of insertions
| Lacking Tn3 | Lacking Tn7 | Lacking both Tn3 and Tn7 | |
|---|---|---|---|
| Number of regions (>6 kb) | 286 | 271 | 135 |
| Total size (bp) | 3 113 779 | 3 379 358 | 1 329 147 |
| Average length (bp) (>6 kb) | 10 849 | 12 424 | 9846 |
| Shortest region (bp) (>6 kb) | 6001 | 6022 | 6081 |
| Longest region (bp) (>6 kb) | 30 031 | 46 875 | 22 184 |
| Average % coding | 60.90% | 63.60% | 59.70% |
Analysis of contiguous regions 6 kb or greater, bearing no Tn3, no Tn7 or neither Tn3 nor Tn7 insertions.
DISCUSSION
Earlier studies on transposon specificity have focused largely on consensus site analysis and local sequence effects. We have taken a broader view and incorporated such approaches with statistical analysis of transposon incorporation on a genomic scale, using two large insertion datasets. By applying K–S analyses to the insertion distributions of Tn3 and Tn7 transposons, we have characterized their behavior and assessed their performance as genomic tools.
Examining our expanded insertion set, we first confirmed the results of earlier studies, which indicated the distinct preference of the Tn3 transposon to insert at the TA[A/T]TA 5mer sequence. Our results confirm that the mini-Tn3 transposon exhibits a marked preference for this 5mer, and we show here that this consensus is stronger when considering sites of multiple Tn3 insertion. The mini-Tn7 transposon, in contrast, displays virtually no sequence preference, and its [T/A] consensus site remains weak when considering sites of multiple insertion. These data suggest that mini-Tn7 target selection is not driven by sequence preference, and emphasize the importance of the core TA[A/T]TA motif to Tn3 incorporation. These results agree with our earlier work on a somewhat smaller dataset (9) and earlier studies by Davies and Hutchison (2).
Comparing the efficacy of Tn3 and Tn7 acting upon the same genomic library, the 9134 recorded Tn7 insertions compare very favorably in terms of genomic coverage with the larger set of 12 109 Tn3 insertions. Tn7 covered roughly the same genomic region as Tn3 (∼9 Mb) with 25% fewer insertions, due to the reduced rate of duplicate insertions. Thus, a larger number of Tn3 insertions are required to achieve equivalent genomic coverage to Tn7 in this system. The low duplicate insertion rate of Tn7 minimizes waste and enables greater coverage on a per-unit basis.
Transposon incorporation is not a Poisson process
The high degree of duplicate insertion exhibited by both transposons shows that transposon incorporation is not a stochastic process, and does not fit to a Poisson distribution. In other words, even when using a transposon with negligible sequence bias, such as Tn7, fully 10% of recorded insertions are exact duplicates. Not every genomic 5mer is equally likely to play host to an insertion event.
We believe the appropriate null distribution for comparison at these window sizes is a Poisson, as opposed to a normal distribution. It is not plausible to take the normal distribution as the null distribution when <5 insertions are expected per window. If we consider 1 kb windows, we expect on average 1 insertion per window, and so the majority of the distribution will be concentrated on the values 0 and 1. The Poisson distribution is the standard null distribution to model such behavior, whereas the normal is only applicable for ∼10 events per window and up.
We compared the distributions of an equal number of Tn3 and Tn7 insertions in 0.5, 1 and 3 kb sequence windows. While neither distribution matches a Poisson, the difference in Tn3 and Tn7 behavior is nonetheless apparent: Tn3 leaves more windows untouched while also yielding more windows with an unusually high number of insertions. Tn7 is more uniform in its distribution, and comes closer to approximating the ideal process at every window size. Thus, Tn7 behavior is closer to uniform than Tn3, though both are still quite distinct from a true random-incorporation process.
Inter-chromosomal variation
Statistically significant differences exist in insertion density between chromosomes for both Tn3 and Tn7. Given the large number of insertions scored in this assay, even minute deviations from expectation appear highly significant; however, these differences may still reflect mere sampling error or library bias, and may not be biologically meaningful.
Several factors likely contribute to the observed variation in chromosomal insertion density: library bias, target site enrichment and transposition cold-spots. Chromosome XI, for instance, exhibits the lowest insertion density for both Tn3 and Tn7 (Tn3: 6.2 insertions/10 kb, Tn7: 5.3 insertions/10 kb), and as such is possibly underrepresented in the genomic library. Chromosome X, in contrast, displays the highest insertion density observed for Tn3 (13.9 insertions/10 kb) but only an average insertion density for Tn7 (7.1 insertions/10 kb). This is further illustrated by the raw insertion counts for this chromosome: 1036 Tn3 insertions were scored, while only 665 were expected assuming equal distribution of insertions. This single large discrepancy contributes nearly half the departure of the overall χ2 statistic for Tn3 across all chromosomes. In contrast, 528 Tn7 insertions were scored on chromosome X, exactly identical to the 528 expected given uniform distribution; accordingly, chromosome X makes no contribution to the χ2 statistic for Tn7.
Since chromosome X is particularly attractive to Tn3 incorporation, we might expect it to be enriched in the AT-rich target sites favored by Tn3. In fact, the GC content for chromosome X is 38%, equal to that of genome as a whole, and the incidence of TA[A/T]TA sites is 4.10 kb, indistinguishable from the genome-wide average of 4.13 kb. Thus, we are unable to explain inter-chromosomal differences in such broad terms as chromosomal GC content or incidence of target motifs.
K–S analysis
The K–S test permits us to assess whether two distributions are likely to have been generated by the same process. The K–S test is applicable to un-binned distributions that are functions of a single independent variable, a good approximation for genomic transposon insertion.
Tn7 insertions are more evenly distributed in the genome. The QK–S values are striking: Tn3 (QK–S = 0.00) is significantly different from uniform, while Tn7 (QK–S = 0.05) sits athwart the threshold at which the distribution cannot be significantly distinguished from uniform. This difference is evident upon viewing the cumulative distribution. On a genomic scale, the sequence preference of Tn3 translates to a definite global insertion bias, whereas Tn7 exhibits a distribution that cannot be statistically distinguished from uniform by this test.
Windowed K–S analysis
Typically, the ultimate goal of genomic transposon mutagenesis is the disruption of every gene in a given genome. Therefore, we are satisfied if we manage to achieve transposon incorporation once or twice per coding region, a span which in S.cerevisiae is roughly equivalent to ∼1000 nt.
Windowed K–S analyses assigns a binary score (1 = hit, 0 = no hit) to insertions in a given window, and thereby accounts for the fact that transposon disruption need not hit every nucleotide of genomic sequence to be considered successful. Maintaining entirely uniform insertion density is not particularly important, so long as at least one successful insertion and disruption occurs per kilobase. Hotspots or duplicate insertions within a gene are also not especially important: such additional insertions are wasteful and do not enhance performance, but do not detract from the fact that the gene has already been successfully disrupted.
Therefore, on the genomic level, 1–2 insertions per kilobase should suffice to disrupt most coding regions in S.cerevisiae. This translates to an effective window size of 500 bp: within every 500 bp genomic window, we demand at least one transposon insertion event. Our windowed K–S analysis shows that both Tn3 and Tn7 insertion distributions are indistinguishable from uniform at window sizes of 300 bp or greater. Therefore, even a transposon with marked sequence bias can still be an effective tool for large-scale gene disruption.
Because transposon insertion density varies between chromosomes, skewed distributions are more apparent at the chromosomal level. Considering chromosomes one at a time is equivalent to examining small regions of the overall genomic distribution, and performing a K–S test against uniform on each one. It can therefore occur that a departure from uniform is significant in the context of a chromosome, but not significant against the backdrop of the much larger genomic tableau. Smaller sequence windows tend to yield greater departure from uniform distribution.
Still, examining chromosomal distributions offers an appealing way to assess the effects of varying window size. Consider the cumulative distribution of Tn3 and Tn7 across chromosome I (Figure 6). Considering all insertions (effective window size = 1 bp), both Tn3 and Tn7 display non-uniform distribution across chromosome I. Increasing the window size renders the distribution of insertions more uniform, and at a window size of 1000 bp, neither distribution is distinguishable from uniform.
TA[A/T]TA 5mers occur frequently throughout the S.cerevisiae genome
Given its pronounced sequence bias, the relative promiscuity of Tn3 at windows larger than 300 bp is at first glance surprising. We might expect that a marked preference for a 5mer insertion site would lead to biased insertion behavior observable up to 1 kb windows. To examine this, Tn3 insertion frequency was correlated with the frequency of the occurrence of its consensus 5mer in the genome. The TA[A/T]TA 5mer is strongly enriched in the genome as a whole: of the 1024 possible 5mer sequences, TAATA and TATTA rank 64th and 66th, respectively.
If nucleotides were randomly distributed throughout the genome, we would expect one TA[A/T]TA 5mer to occur per 512 bp of sequence, yielding over 24 000 sites that exactly match the consensus sequence for Tn3 incorporation. In actuality however—largely because the S.cerevisiae genome is 62% AT—these sites are strongly enriched, occurring over 50 000 times in the yeast genome, or roughly four times per kilobase of sequence. Thus, it is not surprising that Tn3 displays uniform insertion behavior at windows of 300 bp and above, since we expect one TA[A/T]TA 5mer in every 250 bp of sequence.
Differential targeting: sequence analysis
Considering the distinct insertion behavior of Tn3 and Tn7, we might ask whether any useful complementarity exists between these transposons, and whether, in hopes of achieving full genomic coverage, we might be advised to employ both systems. To address this question, we divided the genome into windows of 1 kb, and classified these according to whether Tn3, Tn7, both, or neither transposon inserted in a given window. We thus generated four categories of 1 kb windows suitable for comparison, along with three randomly-chosen subsets.
Overall, little overlap exists between the windows targeted by Tn3 and those targeted by Tn7. In the genome, 60% of 1 kb windows were not hit at all. A total of 27% of windows were hit by one of Tn3 or Tn7, and only 13% were hit by both. This suggests there is value to combine Tn3 and Tn7 to achieve maximum coverage, at least by this metric.
In terms of di- and trinucleotide frequencies, we observe significant difference between the sequence windows in the four main subsets, and also within two of the three randomly selected subsets. This demonstrates that virtually any genomic subset can differ significantly from expectation, given the high number of counts present. Therefore, we are hesitant to draw any substantial biological conclusions from the di- and trinucleotide distributions in the four main subsets, despite their differences.
Broadly, this analysis suggests that some observable difference exists between large sequence regions targeted by Tn3 and those targeted by Tn7 (although because randomly selected subsets are also significantly different, we are unable to draw strong statistical conclusions). Thus, sequence complementarity is apparent between Tn3 and Tn7 at the 1 kb level, though it is difficult to say how much of the differential genomic coverage observed stems from true sequence preference and how much results from sampling differences.
Curiously, the TA[A/T]TA consensus site is not enriched in subsets containing Tn3 insertions, and is in fact found somewhat less often than elsewhere. This is interesting considering the demonstrated preference of Tn3 to incorporate at these sites. However, one must remember that the TA[A/T]TA 5mer occurs roughly four times per kilobase of sequence, whereas Tn3 insertions number roughly one per kilobase. The occurrence of the TA[A/T]TA 5mer is therefore not limiting at this level of Tn3 coverage; it is present in 4× excess in virtually all 1 kb windows, including those not hit by Tn3. In windows hit by both transposons, the GC content is higher (41% GC as opposed to 38% genome-wide; the GC content of randomly selected subsets is constant at 38%). This may account for the scarcity of AT-rich motifs, such as the TA[A/T]TA 5mer, in these windows. Tn3 may therefore favor ‘stand-out’ TA[A/T]TA sites situated in regions of relative GC-richness, while Tn7 may prefer AT-rich regions in general, without specific demand for this 5mer. The T/C at position −7 in the Tn3 consensus appears to indicate a preference for TA[A/T]TA 5mers occurring within regions not entirely devoid of GC.
Assessing bias in the genomic library
Significant efforts have focused on creating transposons well-suited to large-scale mutagenesis by removing sequence specificity in hopes of erasing insertion bias. Indeed, the mini-Tn7 transposon system was developed specifically to circumvent sequence bias present in native Tn7 and yield a promiscuous transposition tool. It is assumed that fully eliminating sequence preference in the transposon will eradicate hotspots and yield a promiscuous and unbiased insertion distribution. So, given its lack of clear target sequence preference, what causes Tn7 to exhibit a 10% duplicate insertion rate?
Clearly, other factors besides mere sequence preference are at work in shaping the insertion behavior of transposons. Previous work has shown that genomic features such as GC content do not appear to explain this bias (9). Other local analyses (such as DNA flexibility) may shed light on this question.
Another possibility is bias within the genomic library exposed to transposon mutagenesis. To generate the plasmid genomic library for these transposon studies, the S.cerevisiae genome was partitioned into regions of roughly 3 kb, and with no easy way to assess the relative populations of these fragments on a large-scale, a 3 kb cold spot devoid of insertions could represent a fragment underrepresented in the genomic library. Since the same library was employed in both Tn3 and Tn7 experiments, an overlay of the two insertion profiles reveals regions where neither Tn3 nor Tn7 insertions are found—regions likely to be underrepresented in the library. Conversely, regions of several kilobases displaying far greater hotspot density than surrounding regions may be overrepresented, or may contain sequences that are heavily duplicated in the yeast genome (such as is the case for the excluded tandem repeat rRNA regions on chromosome XII).
CONCLUSION
We have examined the insertion behavior of two transposons acting upon the same genomic library, both at the local sequence level and in terms of their genomic insertion distributions. Overall, both Tn3 and Tn7 display biased insertion behavior, and both depart markedly from the ideal Poisson distribution. Our windowed K–S analysis allows us to consider these distributions in biologically meaningful terms. We find that differences in transposon insertion site preference do translate to a discernable difference in global insertion distribution: Tn7 is generally more uniform in its distribution than Tn3.
For effective large-scale gene disruption in microbial organisms, we might demand 1–2 successful transposon insertions per kilobase of genomic DNA. Despite their differing degrees of local sequence bias, both Tn3 and Tn7 are capable of delivering this level of disruption: the insertion profiles of Tn3 and Tn7 are indistinguishable from uniform at sequence windows of 300 bp and higher. Thus, both transposons are effective tools for gene disruption. Still, Tn7 does so with less duplication, minimal sequence bias and a more uniform distribution, meaning fewer insertions are needed to provide coverage equivalent to that obtained with Tn3.
The markedly non-uniform insertion distribution of these transposons remains puzzling. It might be argued that Tn3 displays a non-uniform insertion distribution because of its preference to insert at the TA[A/T]TA 5mer sequence; however, because it displays virtually no target site preference (its consensus shows a preference for T or A at a single position), the same argument does not apply to Tn7. In general, our results suggest that transposon bias is governed by more than simple target site preference: DNA flexibility, genomic library bias and other factors likely contribute to the non-uniform insertion behavior exhibited by these transposons.
SUPPLEMENTARY DATA
Supplementary Data are available at NAR online.
Acknowledgments
The authors are indebted to Joel Rozowsky for discussion and thoughtful comments on this manuscript, and Michael L. Schwartz for his contributions to our background research into the use of transposons as genomic tools. This work was supported by NIH grant #CA77808 to Michael Snyder. Funding to pay the Open Access publication charges for this article was provided by National Institutes of Health Protein Structure Initiative 5P50GM62413.
Conflict of interest statement. None declared.
REFERENCES
- 1.Des Etages S.A., Kumar A., Snyder M. Transposons as tools. In: Brenner S., Miller J.H., editors. Encyclopedia of Genetics. San Diego, CA: Academic Press; 2001. pp. 2034–2040. [Google Scholar]
- 2.Davies C.J., Hutchison C.A., IIIrd Insertion site specificity of the transposon Tn3. Nucleic Acids Res. 1995;23:507–514. doi: 10.1093/nar/23.3.507. [DOI] [PMC free article] [PubMed] [Google Scholar]
- 3.Pribil P.A., Haniford D.B. Target DNA bending is an important specificity determinant in target site selection in Tn10 transposition. J. Mol. Biol. 2003;330:247–259. doi: 10.1016/s0022-2836(03)00588-6. [DOI] [PubMed] [Google Scholar]
- 4.Pribil P.A., Wardle S.J., Haniford D.B. Enhancement and rescue of target capture in Tn10 transposition by site-specific modifications in target DNA. Mol. Microbiol. 2004;52:1173–1186. doi: 10.1111/j.1365-2958.2004.04046.x. [DOI] [PubMed] [Google Scholar]
- 5.Liu G., Geurts A.M., Yae K., Srinivasan A.R., Fahrenkrug S.C., Largaespada D.A., Takeda J., Horie K., Olson W.K., Hackett P.B. Target-site preferences of sleeping beauty transposons. J. Mol. Biol. 2005;346:161–173. doi: 10.1016/j.jmb.2004.09.086. [DOI] [PubMed] [Google Scholar]
- 6.Ross-Macdonald P., Coelho P.S., Roemer T., Agarwal S., Kumar A., Jansen R., Cheung K.H., Sheehan A., Symoniatis D., Umansky L., et al. Large-scale analysis of the yeast genome by transposon tagging and gene disruption. Nature. 1999;402:413–418. doi: 10.1038/46558. [DOI] [PubMed] [Google Scholar]
- 7.Biery M.C., Stewart F.J., Stellwagen A.E., Raleigh E.A., Craig N.L. A simple in vitro Tn7-based transposition system with low target site selectivity for genome and gene analysis. Nucleic Acids Res. 2000;28:1067–1077. doi: 10.1093/nar/28.5.1067. [DOI] [PMC free article] [PubMed] [Google Scholar]
- 8.Stellwagen A.E., Craig N.L. Gain-of-function mutations in TnsC, an ATP-dependent transposition protein that activates the bacterial transposon Tn7. Genetics. 1997;145:573–585. doi: 10.1093/genetics/145.3.573. [DOI] [PMC free article] [PubMed] [Google Scholar]
- 9.Kumar A., Seringhaus M., Biery M.C., Sarnovsky R.J., Umansky L., Piccirillo S., Heidtman M., Cheung K.H., Dobry C.J., Gerstein M.B., et al. Large-scale mutagenesis of the yeast genome using a Tn7-derived multipurpose transposon. Genome Res. 2004;14:1975–1986. doi: 10.1101/gr.2875304. [DOI] [PMC free article] [PubMed] [Google Scholar]
- 10.Altschul S.F., Madden T.L., Schaffer A.A., Zhang J., Zhang Z., Miller W., Lipman D.J. Gapped BLAST and PSI-BLAST: a new generation of protein database search programs. Nucleic Acids Res. 1997;25:3389–3402. doi: 10.1093/nar/25.17.3389. [DOI] [PMC free article] [PubMed] [Google Scholar]
- 11.Cherry J.M., Adler C., Ball C., Chervitz S.A., Dwight S.S., Hester E.T., Jia Y., Juvik G., Roe T., Schroeder M., et al. SGD: Saccharomyces Genome Database. Nucleic Acids Res. 1998;26:73–79. doi: 10.1093/nar/26.1.73. [DOI] [PMC free article] [PubMed] [Google Scholar]
- 12.Crooks G.E., Hon G., Chandonia J.M., Brenner S.E. WebLogo: a sequence logo generator. Genome Res. 2004;14:1188–1190. doi: 10.1101/gr.849004. [DOI] [PMC free article] [PubMed] [Google Scholar]
- 13.Schneider T.D., Stephens R.M. Sequence logos: a new way to display consensus sequences. Nucleic Acids Res. 1990;18:6097–6100. doi: 10.1093/nar/18.20.6097. [DOI] [PMC free article] [PubMed] [Google Scholar]