

Abstract
The detection of adaptive evolution at the molecular level is of interest not only as an insight into the process of evolution but also because of its functional implications for genes of interest. Here, we present the first genomics approach to detecting positive selection operating on the Bos taurus lineage, an important domestic species. This analysis led to the identification of the T-cell and natural killer (NK) cell receptor cluster of differentiation 2 (CD2) as having a strong signal of selection. Further detailed investigation of CD2 revealed that this gene was subject to positive selection during the evolution of a number of mammalian lineages. Moreover, we show that selection has operated primarily on the extracellular domain of CD2 and discuss the implications of this for an important regulator of the adaptive immune response.
THE detection of positive selection in genes of interest is important not only for understanding the process of evolution, but also because these signatures of selection can provide us with real insight into the functional significance of these molecules. Indeed, evidence for adaptive evolution has been provided for a number of important molecules involved in a range of processes, including reproduction (Swanson et al. 2001), development (Fares et al. 2003), taste (Shi et al. 2003), and particularly, the immune system (Hughes and Yeager 1998; Filip and Mundy 2004; Lynn et al. 2004). Although these and other studies have been informative in understanding the evolution of individual genes, the abundance of sequence information for many species now provides us with the opportunity not only to investigate the effects of natural selection on a gene-by-gene basis but also to use a systematic genomics approach. Whereas some recent studies have tended to focus on human-primate divergence (Clark et al. 2003; Gimelbrant et al. 2004), here we fit models of evolution by maximum likelihood to >3000 orthologous genes from four mammalian species to search for evidence of positive selection in the bovine lineage.
The analysis presented here is the first reported systematic approach to the study of positive selection at the molecular level in this important domestic species. In this article we use a bovine gene data set generated from clustered expressed sequence tags (ESTs), since a gene data set from the genome project is currently unavailable. Although this data set is not without errors, our approach has nevertheless proven to be a powerful method in the detection of positive selection in this species. In particular, we have identified a strong signature of selection in cluster of differentiation 2 (CD2), a T-cell and natural killer (NK) cell-surface protein of considerable importance in the mammalian immune response (Davis et al. 2003). More detailed analysis of this molecule has confirmed the signature of selection identified using the genomics approach and has revealed that positive selection has operated primarily in the extracellular domain of this molecule, raising important questions regarding its function.
MATERIALS AND METHODS
Generating a bovine and porcine gene data set:
As the complete cow and pig genome sequences have yet to be published, alternative sources of sequence information must be utilized to generate bovine and porcine gene data sets. Fortunately, large collections of ESTs are now available for these species. A total of 335,668 bovine and 272,260 porcine ESTs and mRNAs were downloaded from GenBank (http://www.ncbi.nlm.nih.gov). Both of the data sets were masked for repetitive sequences using RepeatMasker (http://repeatmasker.org) and cleaned of vector and poly(A) contaminants using SeqClean (http://www.tigr.org/tdb/tgi/software/). Following this process 332,076 bovine and 270,260 porcine sequences were available for clustering. The ESTs were clustered and assembled into consensus sequences using the TIGR gene indices clustering tools (TGICL) (Pertea et al. 2003). The sequences for each cluster were postprocessed with ESTScan (Iseli et al. 1999). ESTScan predicts potential coding regions in sequences of low quality, such as ESTs, using a method that can automatically correct for frameshift errors. Bovine and porcine protein sequences were also translated from the coding sequences.
Orthologous genes:
To examine for evidence of positive selection using the method employed in this study, orthologous gene data sets must be compared. A total of 19,624 human and 24,573 mouse protein and corresponding coding sequences were downloaded from the Kyoto Encyclopedia of Genes and Genomes database (http://www.genome.jp/kegg/). To identify human-mouse-cow-pig orthologs, a four-way reciprocal best-hit approach was applied. Essentially this involved a BLASTP (Altschul et al. 1997) all-against-all search with an E-value cutoff of e-10. The reciprocal best hit was identified for each species. Whenever the “next-best” match was within e-10 of the best hit, this gene was excluded from the analysis altogether. The four-way reciprocal best hit was then identified. Once orthologous gene data sets had been generated, protein sequences for each data set were aligned using T-Coffee (Notredame et al. 2000). Alignments of the corresponding coding sequences were carried out, maintaining the gaps in the protein alignment.
Variable selective pressure on the bovine lineage:
One of the most stringent methods to detect positive selection is a comparison of the rate of nonsynonymous substitutions (dN) to the rate of synonymous substitutions (dS). The ratio between these rates (ω = dN/dS) is a reliable measure of the selective pressure acting on a protein-coding gene. If amino acid changes are selectively neutral, they will be fixed at the same rate as synonymous mutations and ω = 1. If nonsynonymous mutations are slightly deleterious, then ω < 1. Finally, if the amino acid changes are selectively advantageous, then they will be fixed at a higher rate and ω > 1 (see, for review, Yang 2002).
To test for evidence of positive selection in the bovine lineage, each alignment was fitted to three models by maximum likelihood. The first model, the one-ratio model, assumes an equal ω-ratio for all branches in the phylogeny. This was compared by likelihood-ratio test (LRT) to a second model, the two-ratio model, which allows ω to vary only in the bovine lineage. Twice the log-likelihood difference between the two models was compared to a χ2 distribution with N − 1 d.f., where N is the number of branches in the phylogeny (Yang 1998; Yang and Nielsen 1998). Similarly, the two-ratio model was also compared by LRT to a third model; the free-ratio model, which assumes an independent ω-ratio for each branch. In cases in which the two-ratio model was significantly better than the one-ratio model, the free-ratio model was not significantly better, and the bovine lineage had ω > 1, this was evidence of positive selection specifically in this lineage. The models are implemented in the CODEML program in PAML v3.13 and ω-ratios are estimated by maximum likelihood (Yang 1997). In many cases the cow and pig data sets consist of partial sequences. Still, these sequences may be analyzed, as a parameter in the models may be set to ignore regions of the alignments with missing or gapped data. It should be noted that a recent study looking at human-chimp-mouse orthologs implemented slightly different models, which detect positive selection at individual sites along specific lineages (Clark et al. 2003). The models applied in the Clark et al. (2003) study have since been criticized for an unacceptably high false-positive rate and were not used in our analysis (Zhang 2004).
CD2 sequences:
Coding sequences and corresponding protein sequences for CD2 from nine species—Homo sapiens, human (NM_001767); Pan troglodytes, common chimpanzee (AY445034); Macaca mulatta, rhesus monkey (AY445037); Papio anubis, olive baboon (AY445035); Mus musculus, mouse (NM_013486); Rattus norvegicus, rat (NM_012830); Equus caballus, horse (X69884); Sus scrofa, pig (NM_213776); and Felis catus, cat (AB062551)—were downloaded from GenBank. The complete coding sequences for Bos taurus (cow) CD2 was obtained by sequencing as detailed below.
RNA isolation:
A total of 200 ml of B. taurus blood was obtained and treated with heparin. Within 3 hr of the blood being drawn, peripheral blood mononuclear cells were isolated on a Percoll (Amersham Biosciences) gradient using a standard protocol (Ulmer et al. 1984) and stored immediately in TriReagent (Sigma, St. Louis) at −80°. Total RNA was extracted using an optimized protocol combining the TriReagent, DNase treatment (RQ1 RNase-Free DNase, Promega, Madison, WI), and RNeasy (QIAGEN, Chatsworth, CA) methods.
cDNA synthesis:
RNA processing, reverse transcription and 5′-RACE were carried out using the FirstChoice RLM-RACE kit (Ambion, Austin, TX). The gene-specific primer sequences for the 5′-RACE outer and inner PCRs were 5′-AGTTAATTTCAGGTCCTGAGAGCA-3′ and 5′-TCTGCCACTATATCACTTCTTGGA-3′, respectively. The entire coding sequence of CD2 was amplified from cDNA in a series of overlapping nested and seminested PCRs. Details of PCR primers and annealing temperatures are outlined in supplementary Table 1 at http://www.genetics.org/supplemental/. All PCRs were carried out in a total reaction volume of 50 μl and contained 1.5 mm MgCl2, 0.2 mm each dNTP, 0.4 μl each primer, 1× PCR buffer, containing 20 mm Tris HCl (pH 8.4) and 50 mm KCl, and 1.25 units platinum Taq (Invitrogen, San Diego). Outer PCRs contained 1.0 μl of cDNA and inner PCRs contained 2.0 μl of the outer PCR product. Cycling conditions for all PCRs were 94° for 3 min followed by 30 cycles of 94° for 30 sec, Ta for 30 sec, and 72° for 1 min, and a final extension step at 72° for 7 min. PCR products were visualized on 2% agarose gels and purified for sequencing using JET QUICK spin columns (GENOMED GmbH). PCR products were sequenced in forward and reverse directions (MACROGEN). The sequence was submitted to GenBank under accession no. AY841149.
Detecting positive selection in CD2 lineages:
CD2 protein sequences were aligned using the T-Coffee program (supplementary Figure 1 at http://www.genetics.org/supplemental/) (Notredame et al. 2000). An alignment of the coding sequences was carried out maintaining the gaps in the protein alignment. A neighbor-joining tree was inferred from the coding sequence alignment using MEGA v2.1 (Kumar et al. 2001) (supplementary Figure 2 at http://www.genetics.org/supplemental/). One thousand bootstrap replicates were carried out to test the significance of each node in the tree. Branches leading to nodes with <50% bootstrap support were collapsed. To test the hypothesis that there are variable selective pressures on different lineages in the CD2 phylogeny, it is appropriate to compare two models implemented in CODEML by LRT, the one-ratio model and the free-ratio model (see above). Where the free-ratio model is significantly better than the one-ratio model and lineages have ω-values > 1, this is evidence of positive selection in these lineages (Yang 1998; Yang and Nielsen 1998). Supplementary Figure 3 at http://www.genetics.org/supplemental/ presents the distribution of bovine dN/dS values as calculated under model 1.
Amino acid sites under positive selection in CD2:
Models of variable selective pressures among amino acid sites were used to test for the presence of sites under positive selection (ω > 1) and to identify them. The six recommended models (M0, M1, M2, M3, M7, and M8) implemented in the CODEML program of the PAML package were tested (Yang et al. 2000; Anisimova et al. 2002). Model M0 is an evolutionary model whereby all the amino acid sites have a single ω-value. M1 is the neutral model and assumes two classes of sites (conserved, ω = 0; neutral, ω = 1) in the protein. M2 adds a third class of site with ω as a free parameter, allowing for sites with ω > 1. M3 uses a general discrete distribution with three classes of site, with the proportions (p0, p1, and p2) and the ω-ratios (ω0, ω1, and ω2). Model M7 uses a β-distribution of sites between the intervals ω = 0 and ω = 1. M8 adds an extra class of sites to the M7 model, allowing for sites with ω > 1.
From these models, three LRTs compare M0 with M3, M1 with M2, and M7 with M8. Models M2, M3, and M8 are tests of positive selection among sites. Posterior Bayesian probabilities of site classes were calculated for each amino acid site (Nielsen and Yang 1998). If the ω-ratios for some site classes are >1, sites with high posterior probabilities for those classes are likely to be under positive selection. For this analysis any columns in the DNA alignment that had gaps were removed.
RESULTS
To generate bovine and porcine gene data sets, ESTs and mRNAs were clustered and assembled into 32,553 and 32,069 consensus sequences, respectively. From these, 22,320 cow and 22,062 pig coding sequences were predicted. A four-way reciprocal best-hit approach was applied to identify 3190 human-mouse-cow-pig orthologous genes. To test the hypothesis of variable selective pressure on the bovine lineage, coding sequence alignments for each orthologous data set were fit to three models and compared by LRT (see above). A total of 211 genes were determined to show significant acceleration in the ω-ratio on the bovine lineage; however, only 6 genes had ω > 1 (supplementary Table 2 at http://www.genetics.org/supplemental/). Of these, one immune gene, CD2, showed the strongest signal of positive selection. CD2 is an abundant cell-surface protein that is expressed in T cells and NK cells. Interaction between CD2 and its counter-receptor CD58 (CD48 in rodents) in antigen-presenting cells quantitatively enhances T-cell antigen recognition and lowers the threshold for T-cell activation (Davis et al. 2003). Given the importance of CD2 in the adaptive immune response and the fact that the models implemented are sensitive to low numbers of sequences (Anisimova et al. 2001), we investigated CD2 in more detail to verify our prediction of positive selection.
A neighbor-joining phylogenetic tree of the CD2 gene from 10 species was reconstructed from the coding sequence alignment. This tree was consistent with the known mammalian phylogeny (Madsen et al. 2001; Murphy et al. 2001). The topology was used in the subsequent analyses to detect adaptive evolution. To test for variable ω-ratios among phylogenetic lineages, the one-ratio model was compared to the free-ratio model using the LRT (Yang 1998). The free-ratio model was found to be significantly better than the one-ratio model (P < 0.05), supporting the hypothesis of variable selective constraints across the phylogeny (details of the LRT are in the supplementary material at http://www.genetics.org/supplemental/). The branch leading to the artiodactyls had ω > 1, as did the bovine and porcine lineages themselves, indicative of positive selection in these lineages (Figure 1). The bovine lineage shows the strongest evidence of positive selection with ω = 1.41. To confirm that the value of ω in the bovine lineage is significantly >1, a model in which the ω-value in the cattle lineage was free to vary was compared to a model in which it was fixed to 1. A LRT revealed that the value was indeed significantly >1 (P < 0.001).
Figure 1.—

Phylogeny of CD2. Branch lengths were estimated by maximum likelihood under the free-ratio model, which assumes an independent ω-value for each branch. ω-values are shown for each branch, with values >1 in boldface type. Branches with no ω-values shown had values equal to infinity.
To test the hypothesis of variable selective pressure among amino acid sites, six different models—model M0 (one-ratio) and M3 (discrete), M1 (neutral) and M2 (selection), and M7 (β) and M8 (β and ω)—were compared by LRT (Table 1) (Anisimova et al. 2002). All three models (M2, M3, and M8) that allow for selection were significantly favored over the other models (P < 0.001 in each test; Table 2) and predicted the presence of sites with ω > 1. M2 predicts only two sites subject to positive selection (Table 2). This model is known to be very conservative and frequently fails to detect positive selection. The null model M1 does not account for sites where 0 < ω < 1 and M2 may be forced to account for such sites (Anisimova et al. 2002). M3 detects a large number of sites; however, this model is known to overpredict sites subject to positive selection when there are a large number of neutral sites (Anisimova et al. 2002).
TABLE 1 .
Amino acid sites subject to positive selection in CD2
|
Model |
No. of parameters |
Parameters |
ℓ |
dN/dS |
Positively selected sites |
|---|---|---|---|---|---|
| M0: one ratio | 1 | ω = 0.7853 | −5712.56 | = ω | |
| M1: neutral | 1 | p0 = 0.203, ω0 = 0 | −5658.05 | 0.7974 | |
| p1 = 0.797, ω1 = 1 | |||||
| M2: selection | 3 | p0 = 0.187, ω0 = 0 | −5633.99 | 1.1777 | 22, 89 |
| p1 = 0.636, ω1 = 1 | |||||
| p2 = 0.177, ω2 = 3.053 | |||||
| M3: discrete | 5 | p0 = 0.515, ω0 = 0.2511 | −5614.51 | 0.9678 | 11, 14, 20–23, 38, 48, 50, 58, 62–64, 66–69, 73, 76, 83, 85, 87, 89, 95, 104, 112, 116, 121, 123, 125, 127, 136, 137, 140, 148–150, 153–155, 157, 159, 166, 168, 174, 176, 179, 181–183, 185, 187, 195, 206, 210, 212, 239, 242, 282, 322 |
| p1 = 0.459, ω1 = 1.5353 | |||||
| p2 = 0.027, ω2 = 5.022 | |||||
| M7: β | 2 | p = 0.368, q = 0.210 | −5641.42 | ||
| M8: β and ω | 4 | p0 = 0.591, p = 2.43, q = 5.040 | −5616.05 | 14, 21, 22, 48, 50, 64, 67, 69, 89, 95, 123, 136, 149, 150, 153, 154, 159, 168, 174, 239 | |
|
p1 = 0.409, ω = 1.805 |
TABLE 2 .
LRTs to detect adaptive evolution
|
Models |
2Δℓ |
χ2 value |
d.f. |
P-value |
|---|---|---|---|---|
| M1 vs. M2 | 2(−5658.05–5633.99) | 48.12 | 2 | <0.001 |
| M0 vs. M3 | 2(−5712.56–5614.51) | 196.10 | 4 | <0.001 |
| M7 vs. M8 |
2(−5641.42–5616.05) |
50.74 |
2 |
<0.001 |
M8 is the most accurate of the models (Anisimova et al. 2002) and predicts 20 amino acid sites to have ω > 1, with Bayesian posterior probabilities >0.99 (Table 1). Suzuki and Nei (2002) found that M8 was susceptible to local minima and that a range of different initial ω-values resulted in different sites being predicted to be subject to positive selection (false positives). To ensure that this was not the case in our data set, we performed this test and found that the same sites were predicted under M8 regardless of the initial ω-value used, indicating that our analysis was robust. Recently, Wong et al. (2004) have shown that the results obtained by Suzuki and Nei (2002) may have been inaccurate due to the use of an earlier problematic version of the CODEML program.
Interestingly, all but 2 of the 20 sites predicted to be under positive selection in model M8 are located in the extracellular domain of CD2 (Figure 2). A comparison of the distribution of these sites to a Poisson distribution revealed that the clustering of the sites in the extracellular domain was statistically significant (P < 0.01). It should be noted that Suzuki and Nei (2002) have predicted that M8 has a false-positive rate of between 10 and 14% in their data set. Even if we accept that our data set is subject to the same false-positive rate, 16 of the sites in the extracellular domain are likely to be true positives and the location of this number of sites in the extracellular domain is still significant (P < 0.01). The sites predicted to be subject to positive selection have been plotted on the structure of the extracellular domain of human CD2 (Jones et al. 1992) (Figure 3).
Figure 2.—
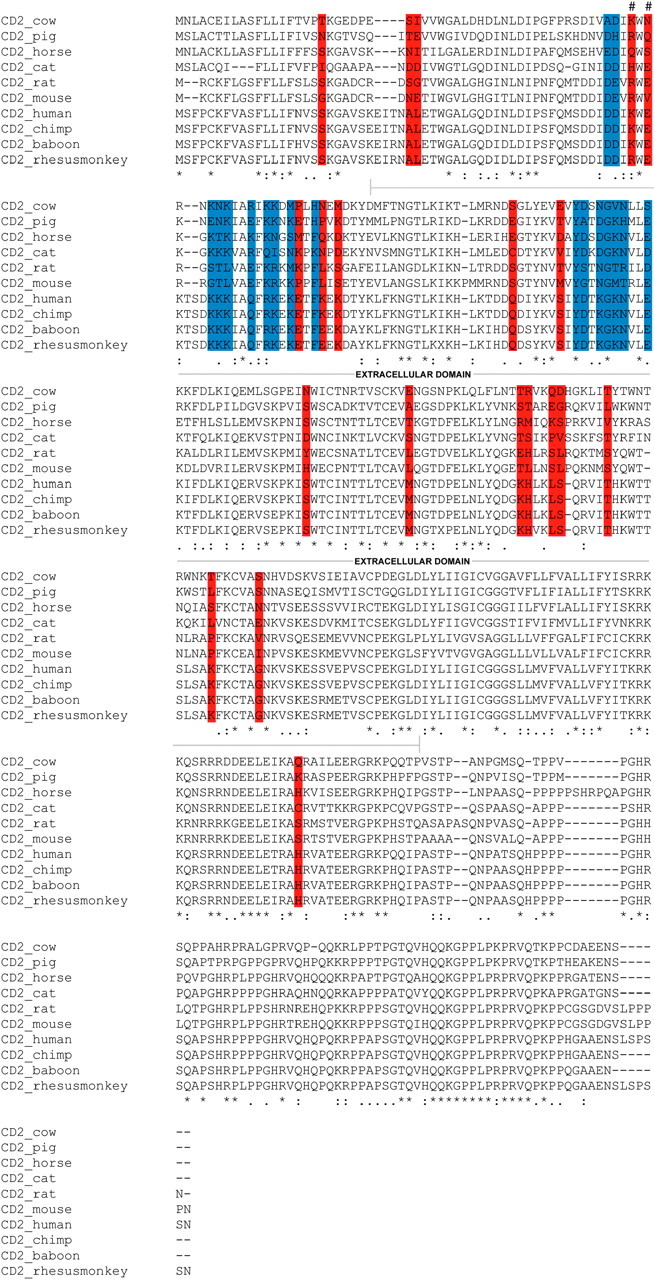
Multiple sequence alignment of CD2 sequences showing amino acid sites predicted to be under positive selection by model M8 (shown in red). Sites shown in blue are involved in CD58 and/or CD48 binding. Sites involved in CD58/CD48 binding and subject to positive selection are denoted by #. Note that all but two of the sites under positive selection are located in the extracellular domain of CD2.
Figure 3.—
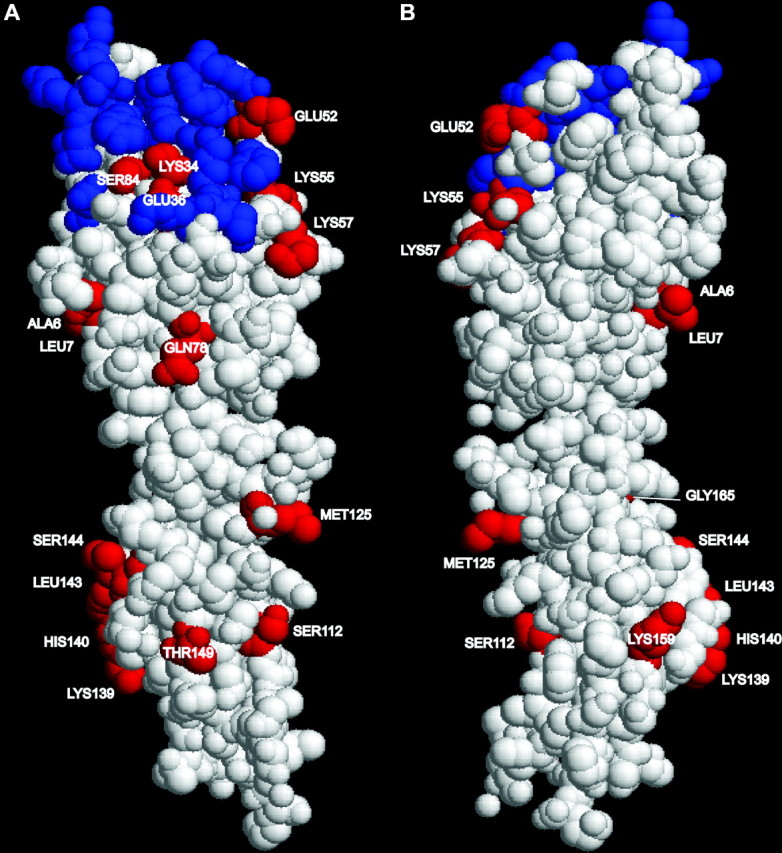
The three-dimensional structure of human CD2 extracellular domain [Protein Data Bank (PDB) http://www.rcsb.org/pdb/entry=1HNF]. Sites shown in red are those sites predicted to be under positive selection (model 8). The sites are labeled according to the numbering scheme used in the PDB file (ALA6 corresponds to site 14 in Table 1). Sites known to be involved in CD58 binding are shown in blue. A and B show two opposite faces of the CD2 molecule. The structure was displayed using RasMol V2.7.2.1.1 (http://www.openrasmol.org/software/rasmol/).
For the free-ratio model to detect ω > 1 on particular lineages, the average ω-value must be >1 over the entire sequence. From the site-specific models we have determined that most of the sites subject to positive selection are located in the extracellular domain of CD2. To test the hypothesis that additional lineages could be found to have ω > 1 if only this region were analyzed, the LRT of the one-ratio model compared to the free-ratio model was repeated considering only the extracellular domain. This test allowed us to detect evidence of positive selection in several additional lineages, apart from the artiodactyls. ω > 1 is detected on the artiodactyl (pig and cow), the perissodactyl (horse), and the carnivore (cat) branches (Figure 4). Again the bovine lineage shows the highest ω-value (ω = 2.56). The branch leading to the divergence of the primates also shows evidence of positive selection.
Figure 4.—

Phylogeny of CD2 extracellular domain. Branch lengths were estimated by maximum likelihood under the free-ratio model, which assumes an independent ω-value for each branch. ω-values >1 are in boldface type.
DISCUSSION
In this article, we have described a systematic approach to the identification of candidate genes that are likely to have undergone adaptive evolution in cattle. This analysis identified the T-cell and NK cell-surface protein CD2 as a promising candidate for further study. More detailed investigation has confirmed that CD2 has been under positive selection throughout the evolution of a number of mammalian lineages with the bovine lineage subject to the strongest positive selection. No evidence of positive selection was found in the primate and rodent lineages with respect to the lineage-specific models tested; rather, these lineages are subject to strong purifying selection. Interestingly, the power of the maximum-likelihood method for detecting positive selection was increased when only the extracellular domain was considered and evidence for positive selection was observed on the branch ancestral to the primates. This reveals the importance of testing the structural and functional domains of proteins separately, in addition to testing the entire sequence. We note that another leukocyte surface protein, CD45, which is involved in T- and B-cell activation, was subject to strong natural selection in cattle (Ballingall et al. 2001).
Of particular interest was the spatial arrangement of amino acid sites predicted to be subject to positive selection, as this could provide insight into the functionally significant regions of the molecule. In almost all cases, these sites were located in the extracellular domain of CD2. CD2 optimizes T-cell activation through interaction with its counter-receptor CD58 in humans, pigs, and cats (Selvaraj et al. 1987; Shimojima et al. 2002; Brossay et al. 2003), and CD48 in rodents (Kato et al. 1992; van der Merwe et al. 1995). Two of the amino acid sites predicted to be subject to positive selection (Lys34 and Glu36) are known to be involved in CD58 and CD48 binding (Somoza et al. 1993; Davis et al. 1998). A number of other sites under positive selection (Glu52, Lys55, Lys57, and Ser84) are close to the CD58/CD48-binding domain of CD2 (Somoza et al. 1993; Davis and van der Merwe 1996; Davis et al. 1998; Wang et al. 1999) and could be experimentally tested for involvement in CD58/CD48 binding. Antigen recognition by T cells is one of the essential steps in controlling the adaptive immune response. The interaction between CD2 and CD58/CD48 is pivotal in this process, lowering the threshold for T-cell activation (Bachmann et al. 1999). The use of different counter-receptors in different species is likely to have resulted in positive selection in CD2 to optimize the interaction with the counter-receptor.
Many of the sites under positive selection, however, are not located in the counter-receptor binding region and may be under selection for some other interaction or function not involving CD58 or CD48. So what other pressures are likely driving positive selection in the extracellular domain of CD2? We propose that interaction with a pathogen or a pathogen protein may also be responsible for driving positive selection in CD2. CD2 and other similar cell-surface proteins have low affinity for their counter-receptors (Dustin 1997; Dustin et al. 1997). This may be exploited by viruses, which can evolve a higher affinity for these receptors to invade the host cell (Wang 2002). Indeed, a number of similar receptors have been used by viruses in this manner. The T-cell coreceptor, CD4, is bound by HIV (Kwong et al. 1998) and the CD2 family member, the signaling lymphocyte-activation molecule (SLAM), is bound by the measles virus (Tatsuo et al. 2000). Although no such interaction has yet been described for CD2, at least one virus, the African swine fever virus, encodes a CD2 mimic protein (Dixon et al. 2004). Exploitation by one or several viruses could have imposed strong selective pressure on CD2 at different interval points in mammalian history. Further investigation of this molecule as a viral receptor may now be warranted.
The anticipated arrival of the complete bovine genome sequence assembly in the near future (http://www.hgsc.bcm.tmc.edu/projects/bovine/) will allow for the application of the method described here to almost all the genes in the genome. These and other studies are likely to identify many other genes that have been subject to positive selection in the bovine lineage and to provide key insights into the types of genes that have been selected for during the evolution of this important domesticated species. In particular, the identification of genes involved in the immune system is likely to be of considerable interest as these are candidate disease-resistance genes.
Acknowledgments
This material is based on works supported by Science Foundation Ireland under grant no. 02-IN.1-B256. Thanks go to Mario Fares, Department of Biology, National University of Ireland, Maynooth, for very helpful comments. A significant number of bovine and porcine ESTs used in this article were generated by U.S. Meat Animal Research Center (MARC) and National Institute of Agrobiological Services, respectively.
Footnotes
Sequence data from this article have been deposited with the EMBL/GenBank Data Libraries under accession no. AY841149.
Communicating editor: Z. Yang
References
- Altschul, S. F., T. L. Madden, A. A. Schaffer, J. Zhang, Z. Zhang et al., 1997. Gapped BLAST and PSI-BLAST: a new generation of protein database search programs. Nucleic Acids Res. 25: 3389–3402. [DOI] [PMC free article] [PubMed] [Google Scholar]
- Anisimova, M., J. P. Bielawski and Z. Yang, 2001. Accuracy and power of the likelihood ratio test in detecting adaptive molecular evolution. Mol. Biol. Evol. 18: 1585–1592. [DOI] [PubMed] [Google Scholar]
- Anisimova, M., J. P. Bielawski and Z. Yang, 2002. Accuracy and power of Bayes prediction of amino acid sites under positive selection. Mol. Biol. Evol. 19: 950–958. [DOI] [PubMed] [Google Scholar]
- Bachmann, M. F., M. Barner and M. Kopf, 1999. CD2 sets quantitative thresholds in T cell activation. J. Exp. Med. 190: 1383–1392. [DOI] [PMC free article] [PubMed] [Google Scholar]
- Ballingall, K. T., L. Waibochi, E. C. Holmes, C. H. Woelk, N. D. MacHugh et al., 2001. The CD45 locus in cattle: allelic polymorphism and evidence for exceptional positive natural selection. Immunogenetics 52: 276–283. [DOI] [PubMed] [Google Scholar]
- Brossay, A., F. Hube, T. Moreau, P. Bardos and H. Watier, 2003. Porcine CD58: cDNA cloning and molecular dissection of the porcine CD58-human CD2 interface. Biochem. Biophys. Res. Commun. 309: 992–998. [DOI] [PubMed] [Google Scholar]
- Clark, A. G., S. Glanowski, R. Nielsen, P. D. Thomas, A. Kejariwal et al., 2003. Inferring nonneutral evolution from human-chimp-mouse orthologous gene trios. Science 302: 1960–1963. [DOI] [PubMed] [Google Scholar]
- Davis, S. J., and P. A. van der Merwe, 1996. The structure and ligand interactions of CD2: implications for T-cell function. Immunol. Today 17: 177–187. [DOI] [PubMed] [Google Scholar]
- Davis, S. J., E. A. Davies, M. G. Tucknott, E. Y. Jones and P. A. van der Merwe, 1998. The role of charged residues mediating low affinity protein-protein recognition at the cell surface by CD2. Proc. Natl. Acad. Sci. USA 95: 5490–5494. [DOI] [PMC free article] [PubMed] [Google Scholar]
- Davis, S. J., S. Ikemizu, E. J. Evans, L. Fugger, T. R. Bakker et al., 2003. The nature of molecular recognition by T cells. Nat. Immunol. 4: 217–224. [DOI] [PubMed] [Google Scholar]
- Dixon, L. K., C. C. Abrams, G. Bowick, L. C. Goatley, P. C. Kay-Jackson et al., 2004. African swine fever virus proteins involved in evading host defence systems. Vet. Immunol. Immunopathol. 100: 117–134. [DOI] [PubMed] [Google Scholar]
- Dustin, M. L., 1997. Adhesive bond dynamics in contacts between T lymphocytes and glass-supported planar bilayers reconstituted with the immunoglobulin-related adhesion molecule CD58. J. Biol. Chem. 272: 15782–15788. [DOI] [PubMed] [Google Scholar]
- Dustin, M. L., D. E. Golan, D. M. Zhu, J. M. Miller, W. Meier et al., 1997. Low affinity interaction of human or rat T cell adhesion molecule CD2 with its ligand aligns adhering membranes to achieve high physiological affinity. J. Biol. Chem. 272: 30889–30898. [DOI] [PubMed] [Google Scholar]
- Fares, M. A., D. Bezemer, A. Moya and I. Marin, 2003. Selection on coding regions determined Hox7 genes evolution. Mol. Biol. Evol. 20: 2104–2112. [DOI] [PubMed] [Google Scholar]
- Filip, L., and N. I. Mundy, 2004. Rapid evolution by positive Darwinian selection in the extracellular domain of the abundant lymphocyte protein CD45 in primates. Mol. Biol. Evol. 21: 1504–1511. [DOI] [PubMed] [Google Scholar]
- Gimelbrant, A. A., H. Skaletsky and A. Chess, 2004. Selective pressures on the olfactory receptor repertoire since the human-chimpanzee divergence. Proc. Natl. Acad. Sci. USA 101: 9019–9022. [DOI] [PMC free article] [PubMed] [Google Scholar]
- Hughes, A. L., and M. Yeager, 1998. Natural selection at major histocompatibility complex loci of vertebrates. Annu. Rev. Genet. 32: 415–435. [DOI] [PubMed] [Google Scholar]
- Iseli, C., C. V. Jongeneel and P. Bucher, 1999 ESTScan: a program for detecting, evaluating, and reconstructing potential coding regions in EST sequences. Proceedings of the International Conference on Intelligent Systems for Molecular Biology, American Association for Artificial Intelligence, Menlo Park, CA, pp. 138–148. [PubMed]
- Jones, E. Y., S. J. Davis, A. F. Williams, K. Harlos and D. I. Stuart, 1992. Crystal structure at 2.8 A resolution of a soluble form of the cell adhesion molecule CD2. Nature 360: 232–239. [DOI] [PubMed] [Google Scholar]
- Kato, K., M. Koyanagi, H. Okada, T. Takanashi, Y. W. Wong et al., 1992. CD48 is a counter-receptor for mouse CD2 and is involved in T cell activation. J. Exp. Med. 176: 1241–1249. [DOI] [PMC free article] [PubMed] [Google Scholar]
- Kumar, S., K. Tamura, I. B. Jakobsen and M. Nei, 2001. MEGA2: molecular evolutionary genetics analysis software. Bioinformatics 17: 1244–1245. [DOI] [PubMed] [Google Scholar]
- Kwong, P. D., R. Wyatt, J. Robinson, R. W. Sweet, J. Sodroski et al., 1998. Structure of an HIV gp120 envelope glycoprotein in complex with the CD4 receptor and a neutralizing human antibody. Nature 393: 648–659. [DOI] [PMC free article] [PubMed] [Google Scholar]
- Lynn, D. J., A. T. Lloyd, M. A. Fares and C. O'Farrelly, 2004. Evidence of positively selected sites in mammalian alpha-defensins. Mol. Biol. Evol. 21: 819–827. [DOI] [PubMed] [Google Scholar]
- Madsen, O., M. Scally, C. J. Douady, D. J. Kao, R. W. DeBry et al., 2001. Parallel adaptive radiations in two major clades of placental mammals. Nature 409: 610–614. [DOI] [PubMed] [Google Scholar]
- Murphy, W. J., E. Eizirik, S. J. O'Brien, O. Madsen, M. Scally et al., 2001. Resolution of the early placental mammal radiation using Bayesian phylogenetics. Science 294: 2348–2351. [DOI] [PubMed] [Google Scholar]
- Nielsen, R., and Z. Yang, 1998. Likelihood models for detecting positively selected amino acid sites and applications to the HIV-1 envelope gene. Genetics 148: 929–936. [DOI] [PMC free article] [PubMed] [Google Scholar]
- Notredame, C., D. G. Higgins and J. Heringa, 2000. T-Coffee: a novel method for fast and accurate multiple sequence alignment. J. Mol. Biol. 302: 205–217. [DOI] [PubMed] [Google Scholar]
- Pertea, G., X. Huang, F. Liang, V. Antonescu, R. Sultana et al., 2003. TIGR gene indices clustering tools (TGICL): a software system for fast clustering of large EST datasets. Bioinformatics 19: 651–652. [DOI] [PubMed] [Google Scholar]
- Selvaraj, P., M. L. Plunkett, M. Dustin, M. E. Sanders, S. Shaw et al., 1987. The T lymphocyte glycoprotein CD2 binds the cell surface ligand LFA-3. Nature 326: 400–403. [DOI] [PubMed] [Google Scholar]
- Shi, P., J. Zhang, H. Yang and Y. P. Zhang, 2003. Adaptive diversification of bitter taste receptor genes in mammalian evolution. Mol. Biol. Evol. 20: 805–814. [DOI] [PubMed] [Google Scholar]
- Shimojima, M., Y. Nishimura, T. Miyazawa, K. Kato, K. Nakamura et al., 2002. A feline CD2 homologue interacts with human red blood cells. Immunology 105: 360–366. [DOI] [PMC free article] [PubMed] [Google Scholar]
- Somoza, C., P. C. Driscoll, J. G. Cyster and A. F. Williams, 1993. Mutational analysis of the CD2/CD58 interaction: the binding site for CD58 lies on one face of the first domain of human CD2. J. Exp. Med. 178: 549–558. [DOI] [PMC free article] [PubMed] [Google Scholar]
- Suzuki, Y., and M. Nei, 2002. Simulation study of the reliability and robustness of the statistical methods for detecting positive selection at single amino acid sites. Mol. Biol. Evol. 19: 1865–1869. [DOI] [PubMed] [Google Scholar]
- Swanson, W. J., Z. Yang, M. F. Wolfner and C. F. Aquadro, 2001. Positive Darwinian selection drives the evolution of several female reproductive proteins in mammals. Proc. Natl. Acad. Sci. USA 98: 2509–2514. [DOI] [PMC free article] [PubMed] [Google Scholar]
- Tatsuo, H., N. Ono, K. Tanaka and Y. Yanagi, 2000. SLAM (CDw150) is a cellular receptor for measles virus. Nature 406: 893–897. [DOI] [PubMed] [Google Scholar]
- Ulmer, A. J., W. Scholz, M. Ernst, E. Brandt and H. D. Flad, 1984. Isolation and subfractionation of human peripheral blood mononuclear cells (PBMC) by density gradient centrifugation on Percoll. Immunobiology 166: 238–250. [DOI] [PubMed] [Google Scholar]
- van der Merwe, P. A., P. N. McNamee, E. A. Davies, A. N. Barclay and S. J. Davis, 1995. Topology of the CD2–CD48 cell-adhesion molecule complex: implications for antigen recognition by T cells. Curr. Biol. 5: 74–84. [DOI] [PubMed] [Google Scholar]
- Wang, J., 2002. Protein recognition by cell surface receptors: physiological receptors versus virus interactions. Trends Biochem. Sci. 27: 122–126. [DOI] [PubMed] [Google Scholar]
- Wang, J. H., A. Smolyar, K. Tan, J. H. Liu, M. Kim et al., 1999. Structure of a heterophilic adhesion complex between the human CD2 and CD58 (LFA-3) counterreceptors. Cell 97: 791–803. [DOI] [PubMed] [Google Scholar]
- Wong, W. S., Z. Yang, N. Goldman and R. Nielsen, 2004. Accuracy and power of statistical methods for detecting adaptive evolution in protein coding sequences and for identifying positively selected sites. Genetics 168: 1041–1051. [DOI] [PMC free article] [PubMed] [Google Scholar]
- Yang, Z., 1997. PAML: a program package for phylogenetic analysis by maximum likelihood. Comput. Appl. Biosci. 13: 555–556. [DOI] [PubMed] [Google Scholar]
- Yang, Z., 1998. Likelihood ratio tests for detecting positive selection and application to primate lysozyme evolution. Mol. Biol. Evol. 15: 568–573. [DOI] [PubMed] [Google Scholar]
- Yang, Z., 2002. Inference of selection from multiple species alignments. Curr. Opin. Genet. Dev. 12: 688–694. [DOI] [PubMed] [Google Scholar]
- Yang, Z., and R. Nielsen, 1998. Synonymous and nonsynonymous rate variation in nuclear genes of mammals. J. Mol. Evol. 46: 409–418. [DOI] [PubMed] [Google Scholar]
- Yang, Z., R. Nielsen, N. Goldman and A. M. Pedersen, 2000. Codon-substitution models for heterogeneous selection pressure at amino acid sites. Genetics 155: 431–449. [DOI] [PMC free article] [PubMed] [Google Scholar]
- Zhang, J., 2004. Frequent false detection of positive selection by the likelihood method with branch-site models. Mol. Biol. Evol. 21: 1332–1339. [DOI] [PubMed] [Google Scholar]