

Abstract
Inbreeding depression is expected to play an important but complicated role in evolution. If we are to understand the evolution of inbreeding depression (i.e., purging), we need quantitative genetic interpretations of its variation. We introduce an experimental design in which sires are mated to multiple dams, some of which are unrelated to the sire but others are genetically related owing to an arbitrary number of prior generations of selfing or sib-mating. In this way we introduce the concept of “inbreeding depression effect variance,” a parameter more relevant to selection and the purging of inbreeding depression than previous measures. We develop an approach for interpreting the genetic basis of the variation in inbreeding depression by: (1) predicting the variation in inbreeding depression given arbitrary initial genetic variance and (2) estimating genetic variance components given half-sib covariances estimated by our experimental design. As quantitative predictions of selection depend upon understanding genetic variation, our approach reveals the important difference between how inbreeding depression is measured experimentally and how it is viewed by selection.
WHEN populations experience inbreeding, mean fitness tends to decline and the among-line variance in mean fitness increases (Darwin 1877, p. 442; Morton et al. 1956; Charlesworth and Charlesworth 1987; Byers and Waller 1999). Inbreeding increases homozygosity, causing a decline in mean fitness owing to the manifestation of recessive deleterious alleles, the reduction in frequency of heterozygotes at overdominant loci, or changes in gene interactions, such as additive-by-dominance and dominance-by-dominance epistasis (Crow and Kimura 1970, pp. 78–80). The among-line variance also increases owing to the segregation among lines of these genetic factors as well as the additive and additive-by-additive epistatic genetic variances (Cockerham and Weir 1968; Goodnight 1988).
Inbreeding depression (ID) is believed to play an important but complicated role in the evolution of mating systems (e.g., Holsinger 1988; Uyenoyama et al. 1993). For example, in the evolution of selfing and outcrossing in plants, inbreeding initially selects against selfing lineages by lowering mean fitness. However, if the genes responsible for ID are purged by selection from within or among some lineages, then the selective advantages of selfing may come to outweigh its initial disadvantages. The purging process is complicated because inbreeding has effects not only on mean fitness but also on the within-deme genetic variances and covariances of fitness traits. Thus, purging of ID depends upon the within- and among-line genetic variances.
Variation in ID σ2ID has been measured as part of studies investigating the relationship between ID and mating system (e.g., Kalisz 1989; Agren and Schemske 1993; Mutikainen and Delph 1998; Takebayashi and Delph 2000; reviewed in Byers and Waller 1999) and between ID and the short-term dynamics of purging (Pray and Goodnight 1995; Fowler and Whitlock 1999). In these latter studies, ID is considered a heritable trait and σ2ID is assumed to represent an opportunity for selection to act upon and reduce inbreeding load. The problem with this perspective is that inbreeding complicates the concept of heritability by changing the nature of the regression of parents on offspring. Indeed, Falconer (1985)(p. 337) states that the concept of breeding value, from which narrow sense heritability is measured, has “no useful meaning when mating is nonrandom.” Although the change in the parent-offspring regression can be predicted for particular cases (e.g., for selfing, see Wright and Cockerham 1986), the variance components affecting selective response in inbred populations are different from those contributing to σ2ID.
The response to selection with inbreeding has been addressed by a large body of theory describing trait variation among lines with inbreeding or the within-line covariance among traits with inbreeding (e.g., Cockerham 1971, 1983; Cornelius and Dudley 1976; Cockerham and Weir 1983, 1984; Cockerham and Matzinger 1985; Wright and Cockerham 1986; Cornelius 1988). Kelly (2004) noted that σ2ID includes several within-family covariances, e.g., the covariances between outbred relatives, between outbred and inbred relatives, and between inbred relatives. However, only the covariance between inbred relatives contributes to the among-line variance in the inbred phenotype. This distinction arises because ID is a group-level phenotype, defined as a difference between inbred and outbred mean phenotypes. The ID of an individual's progeny depends upon its own genotype as well as that of its mates. As a result, selection among individuals in an inbreeding population may not have a commensurate effect on ID. Differently put, trait evolution with inbreeding is different from the evolution of inbreeding depression.
This is not to say that inbreeding depression cannot evolve. However, a quantitative genetic model for the evolution of ID requires refinements to our current understanding of the genetic basis of ID. First, estimates of ID appropriate for predicting a response to selection must be made. For example, within-line replication of mates is critical for quantifying the genetic variation available for mitigating inbreeding depression. Nevertheless, within-line mate replication is seldom (if ever) employed in practice. Lynch and Walsh (1998)(p. 268) recommend that experimenters consider a replicated nonrandom mating system (i.e., inbreeding) in the context of similarly replicated panmixia: “A central problem is that inbreeding depression is not just a property of the individual, but of the prospective mates as well … the fitness of progeny from full-sib matings will depend upon which sibs are employed as mates …” and “… one would like an estimate of the fitness of outcrossed progeny averaged over all potential mates…” We argue that replication of mates is essential for assessing evolutionarily relevant variation in inbreeding depression, just as it is in experiments for estimating variation in breeding values. To assess the variation in inbreeding depression, we propose a modification to the classic paternal half-sib design.
Parent-offspring regressions require estimates of components of genetic variance. Thus, if we are to quantitatively understand the evolution of ID we need genetic variance estimates. In this way, the translation of the variation in inbreeding depression into genetic variance components serves two purposes. The first is interpretative: we may use the variation in inbreeding depression as a quantitative tool with which to estimate variance components. The second is predictive: by understanding how genetic variation generates variation in inbreeding depression, we may predict future σ2ID after selection and/or inbreeding.
In this article, we develop a general quantitative genetic framework for evaluating the genetic causes of σ2ID. Because the evolution of mating systems depends upon the trade-off between kinship and ID, the development of this theory is a necessary step in the quantitative study of the evolution of mating systems. Specifically, we introduce an experimental design (Figure 1) for analyzing the genetic components of σ2ID, when inbreeding is caused by either selfing or sib-mating. Our approach is a half-sib design, with sires mated to groups of related and unrelated dams. It permits ID to be defined for each sire as the difference between outbred and inbred dam means and addresses the need identified by Lynch and Walsh (1998)(pp. 268–269) for an ANOVA-based procedure for estimating the expected variation in ID: “… [genetic] variance in inbreeding depression can [presumably] be estimated using ANOVA approaches, treating differences between replicate pairs of inbred and outcrossed matings within lineages as the units of observations, but the procedures remain to be worked out.” We show that σ2ID consists of predictable components of genetic variance and is sensitive to type and duration of inbreeding. The variation in inbreeding depression can be caused by varying F, the probability of identity by descent, across lines. As we consider a design with invariant F, we do not consider this source of variation here.
Figure 1.—

Lineage-specific inbreeding depression with selfing and sib-mating. (A) Each selfing line begins with an outbred hermaphrodite at generation 0. Following g − 1 consecutive generations of selfing in which a single hermaphrodite is selected for crossing, a sire is simultaneously crossed to Mo outbred and unrelated females and to itself (the sire is the dam used to generate inbred progeny in generation g). With this design, related dam replication is not possible with selfing (the sire must be the dam for selfing to occur). (B) Each sib-mating line begins with two outbred and unrelated individuals at generation 0. Following g − 1 consecutive generations of sib-mating in which a single pair of siblings is selected for crossing, a sire is simultaneously crossed to Mo outbred and unrelated females and Mf sisters. The most recent ancestors through which inbred individuals may be made identical by descent are indicated by an asterisk. With selfing, this designation is given to only the sire. With sib-mating, it is given to both paternal grandparents (generation g − 2).
MATERIALS AND METHODS
The linear model:
Consider N independent lines, each containing one sire crossed to Mf related females and Mo unrelated and random-mated females. Each cross generates no outbred offspring or nf inbred offspring (Figure 1). Let ziokl represent the value of the phenotype of the lth outbred individual from the cross between the ith sire and the kth unrelated dam and, similarly, zifkl represent the value of the phenotype for an inbred offspring from the same sire but the kth related dam. We can decompose the phenotype of each outbred (o) and inbred (f) individual into fixed and random effects,
 |
1 |
where the terms in Equation 1 are defined in Table 1. We define inbreeding depression for some sire i to be the expectation of the phenotypic difference between outbred progeny io .. and inbred progeny if .., or in terms of genetic effects,
 |
2 |
Since we are interested in the variation in the differential effects of inbreeding across breeding individuals, we define the variation in inbreeding depression effects (IDE), i.e., those transmitted by sires, to be
 |
3a |
TABLE 1 .
Genetic effects on phenotypes
| Symbol | Parameter |
|---|---|
| μ | Mean of outbred and inbred populations |
| b | Mean inbreeding depression |
| sio | Effect of sire i when crossed to unrelated dams |
| sif | Effect of sire i when crossed to related dams |
| diok | Effect of dam k when crossed to unrelated sire i |
| difk | Effect of dam k when crossed to related sire i |
| eiokl | Deviation of individual l from the mean of cross sire i by unrelated dam k |
| eifkl | Deviation of individual l from the mean of cross sire i by related dam k |
Sire effects are defined in part by the hypothetical distribution of paternal gametes across the entire population relevant to that of the inbreeding treatment. For so this population is the entire pool of unrelated individuals but for sf this is only those individuals who share a specific type of relationship with the sire. In the case of sib-mating, the sire's gametes are imagined to be combined with an infinite number of full sisters. With selfing, however, the pool of appropriate mates is restricted to the hermaphroditic sire itself. In this case, no meaningful distinction can be made between inbred sire effects and related dam effects (see Equation 4). This is reflected in our definition for variation in inbreeding depression effects with selfing,
 |
3b |
The terms σ2(sf) and σ2(df) must be distinguished because the latter contains genetic components and special environmental components (maternal effects) not included in the former.
Adjusted estimator for the variance of inbreeding depression effects:
The variation of inbreeding depression may be estimated by taking, for each sire, the mean outbred phenotype and subtracting the mean inbred phenotype. From these differences, we find the total variation in inbreeding depression across sires. This will overestimate the variation in inbreeding depression effects because there will be contributions from dam and individual (error) effects. Replication at the level of dam (related and unrelated) and the offspring (inbred and outbred) within each line provides a statistical means for accounting for the extraneous variance components and allowing for unbiased estimates of σ2IDE. If there are N sires, Mo unrelated dams, Mf related dams, no outbred offspring, and nf inbred offspring, then
 |
4 |
The variance in inbreeding depression effects with dam effect variance has been measured in some experiments that do not replicate at the level of the dam (e.g., Pray and Goodnight 1995). This parameter contains variance components not relevant to a response to selection. We remove these components by running two separate analyses of variances (ANOVAs) on the outbred and inbred individuals. Each is a two-factor ANOVA with random dam effects nested within random sire effects. This is different from previous approaches (Johnston and Schoen 1994; Pray and Goodnight 1995) in which inbreeding level has been treated as a fixed effect. This alteration is desirable as Kelly (2004) points out that change in genetic variation with inbreeding will violate the assumptions of homoscedasticity upon which these early ANOVAs depend. Our dual-ANOVA approach makes no such assumption. Note that there are no shared aspects between the outbred and inbred individuals except for common alleles transmitted through the shared sires. Because the resulting covariance between outbred and inbred sire effects is a desired component of σ2IDE (Equation 3), no sort of joint ANOVA is more appropriate than the dual-ANOVA approach.
RESULTS
Interpretation of variance:
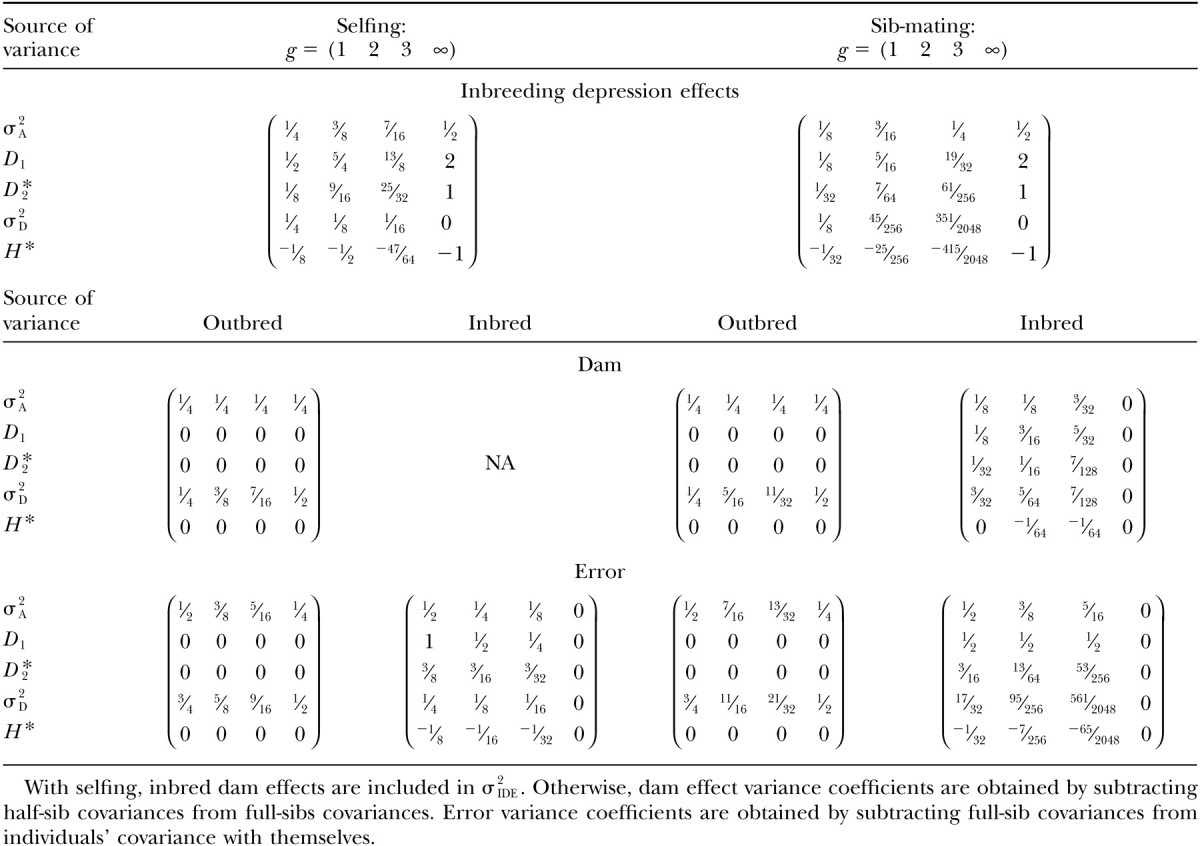
Interpretations of the parameters in Equation 4 are given in terms of genetic components described in Table 2. The variance terms in the ANOVAs can be expressed in terms of covariances between relatives; these are affected by the type and duration of inbreeding. Each of these covariances can be solved independently by Cockerham (1971) for selfing or by Cockerham (1983) for sib-mating. Alternatively, we may synthesize expressions that describe the appropriately weighted sums of these covariances and directly yield the variance components used to estimate σ2IDE. In the appendix, we derive formulas for variation in inbreeding depression effects as well as accessory variances (i.e., dam and error variances) in terms of genetic variance components. These formulas are summarized in Table 3. Variance components σ2A, D1, and D*2 all have nonzero coefficients and contribute to σ2IDE. We show below that D1 and D*2 are often the predominant contributors to the variance in inbreeding depression. In Table 4, we summarize the results for the first three generations of inbreeding and for inbreeding to complete homozygosity. This illustrates the rate with which the various components of variance change their contributions to σ2IDE with selfing relative to sib-mating.
TABLE 2 .
Definitions of genetic variance components
| Genetic parameter | General definition | k = 2 |
|---|---|---|
| σ2A: additive genetic variance |  |
2p1p2(a − d(p1 − p2)*)2 |
|
D1: covariance between additive and homozygous dominance deviations |
 |
2p1p2(p1 − p2)*(a − d(p1 − p2)*)d |
|
D*2: variance of homozygous dominance deviations |
 |
4p1p2p31 + p32 − p1p2d2 |
| σ2D: dominance variance |  |
4p21p22d2 |
|
H*: squared sum of homozygous dominance deviations |
 |
4p21p22d2 |
Parameters are defined in terms of allelic frequencies (pi), additive effects (αi), and dominance effects (δij) assigned to k arbitrary alleles segregating at a locus. Quantitative definitions follow Harris (1964) and Cockerham (1983). Notation for the two-allele case follows Falconer and Mackay (1996)(p. 118) and describes additive effects (a) and dominance deviations in the heterozygote (d). We use p1 to represent the frequency of the high-valued allele. We assume that this allele is dominant; otherwise the difference marked with * is reversed.
TABLE 3 .
Genetic composition of variation in inbreeding depression forg generations of inbreeding
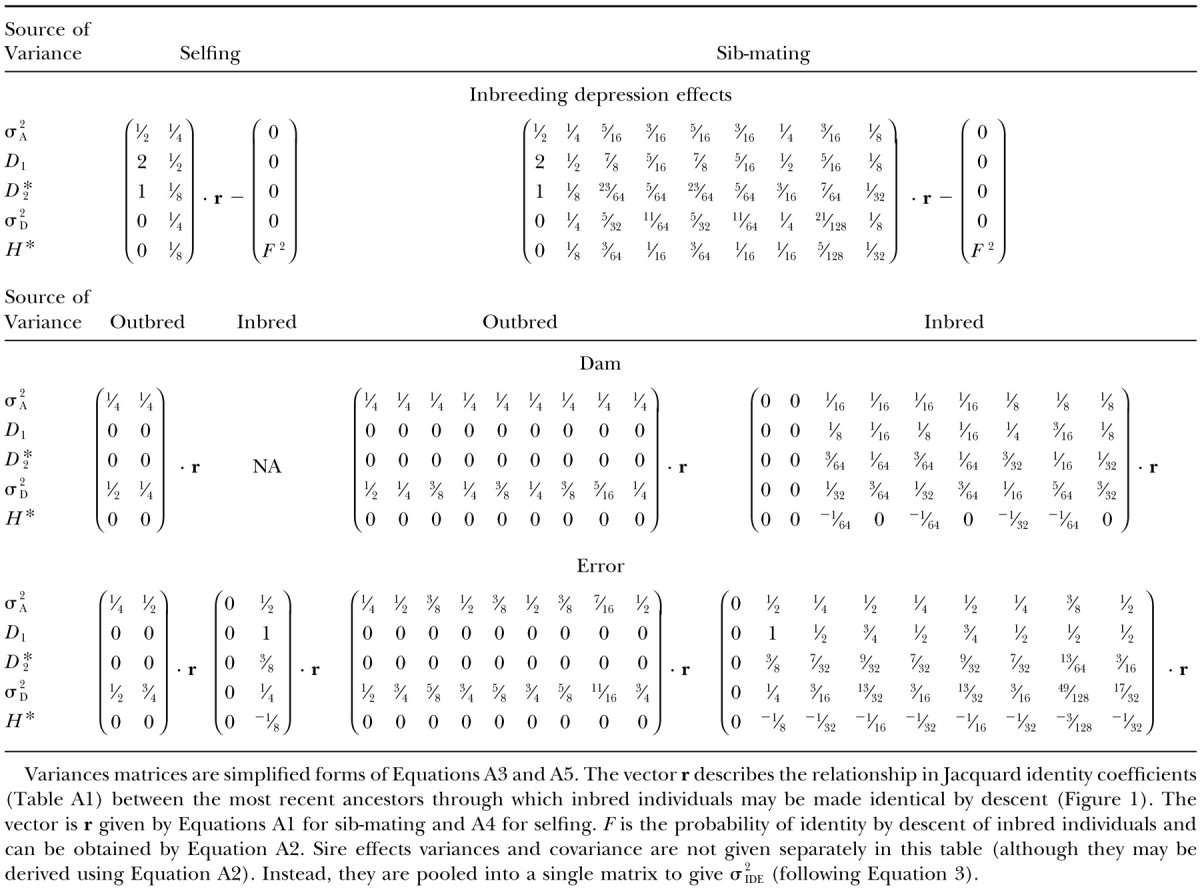
TABLE 4 .
Contributions to variation in ID forg generations of consecutive inbreeding
Expected magnitude of the variation in inbreeding depression effects at mutation-selection balance:
If genetic variation is maintained by mutation-selection balance, then the vector describing the components of σ2IDE can be approximated by three elements: σ2A, D1, and D*2. This follows from Table 2, last column, where we see that these components are roughly proportional to the frequency of the rare allele. In contrast, the remaining two components, σ2D and H*, are proportional to the square of that frequency and can be ignored. When genetic variation is maintained by the balance between mutation and purifying selection, we expect that p2 ≪ p1 when the effects of allele 1 are dominant to the effects of allele 2 (Charlesworth and Charlesworth 1987). To predict σ2IDE, we assume a per-locus mutation rate (μ), selective effect (s), and average degree of dominance (h). Below, we express results for the various variance components in terms of additive genetic equivalents, i.e., in multiples of σ2A that segregates in a random-mated population.
Complete dominance (h = 0):
Following Falconer and Mackay (1996)(p. 126) and Table 2 with complete dominance (i.e., d = a), we have proportional values,
 |
5 |
Although both D1 and D*2 > σ2A, D*2 ≫ D1 when p2 is small. If we replace the frequency of the rare allele, p2, with expectation in terms of mutational parameters μ and s, then we may approximate the variation in inbreeding depression effects by finding the contribution of D*2. With one generation of inbreeding, from Equation 5 and Table 4, we find the variation in inbreeding depression effects to be
 |
6 |
Thus, with complete dominance we expect enormous variation in inbreeding depression effects relative to σ2A, nearly all generated by nonadditive genetic variation.
Partial dominance:
Following the arguments above, we can approximate the value of variance components for partial dominance with rare alleles:
 |
7 |
With one generation of inbreeding, following Equation 7 and Table 4, the variance in inbreeding depression effects is
 |
8 |
Using h = 0.1 (suggested by Lynch and Walsh 1998, p. 286, as representative of viability in Drosophila), we expect σ2IDE to equal ∼6σ2A (six additive genetic variance equivalents) after one generation of selfing and a little > σ2A after one generation of sib-mating. If we reduce dominance (h = 0.3), then σ2IDE decreases relative to additive genetic variance (0.694σ2A and 0.236σ2A, respectively) as the sources of nonadditive genetic variation contributing to variation in inbreeding depression effects are lessened. Using Equation 7, we see how the proportional contribution of each type of genetic variance changes with dominance and inbreeding. These proportions are illustrated for the first 10 generations of inbreeding (and complete inbreeding following an infinite number of inbred generations) in Figure 2. With high dominance (h = 0.1), additive genetic variation is never an important source of variation in inbreeding depression effects. The relative contributions of σ2A, D1, and D*2 stabilize after a few generations of inbreeding.
Figure 2.—
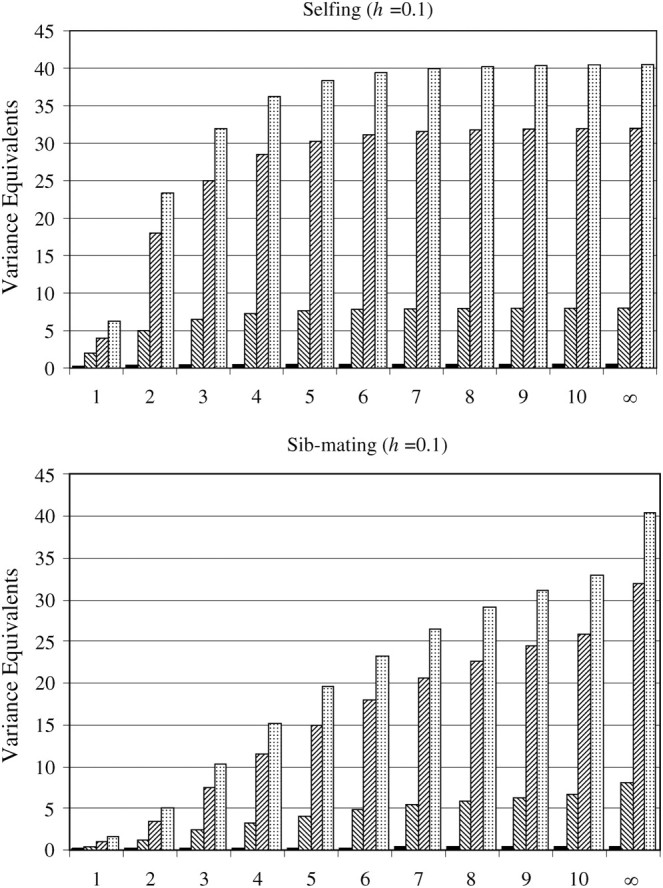

Important genetic components that contribute to the variation in inbreeding depression effects (assuming rare alleles). Increasing the number of consecutive generations of selfing or sib-mating (indicated by the x-axis) increases the total variation in inbreeding depression effects (given in units of additive genetic variance equivalents). This incremental change in σ2IDE diminishes with more generations of inbreeding and more quickly with more intense inbreeding (selfing). Low values of h (corresponding to increased dominance deviations in heterozygotes and increased mean inbreeding depression) give more inbreeding depression effect variance than do high values of h. Changes in σ2IDE with h are positively associated with the relative contribution of D*2 toward that variance. With low h, D*2 will tend to dominate σ2IDE, although D1 will still have some effect. In this case, additive genetic variation does not meaningfully contribute to the variation in inbreeding depression effects. At high values of h, all three variance components become relatively important.
Using variation in inbreeding depression to estimate genetic variance components:
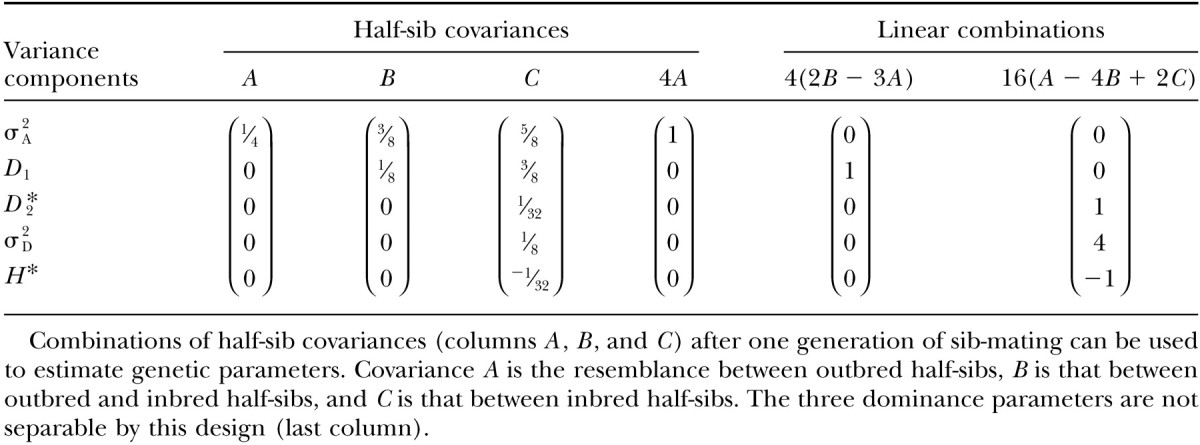
By contrasting the covariances between different sorts of relatives with selfing and sib-mating, it is possible to estimate the genetic parameters that contribute to variation in inbreeding populations (Cornelius and Dudley 1976; Wright and Cockerham 1986). The inbreeding depression design illustrated in Figure 1 provides us with a convenient collection of half-sib covariances with which to perform such an analysis. For sib-mating, we can describe the covariances between four kinds of half-sib relatives [outbred-outbred, σHS(O); outbred-inbred, σ(OF); and inbred-inbred half-sibs, σHS(F)] by using Equations A1–A3a and Table A2 (see appendix). These covariances consist of different weightings of genetic variances, so that linear combinations of these covariances can be used to isolate individual variance components. For example, with one generation of sib-mating, half-sib covariances and useful linear combinations thereof are given in Table 5. These can resolve additive genetic variance (by a conventional outbred paternal half-sib comparison), the covariance between additive and dominance deviations in homozygotes, and the dominance contribution toward among-line variance. As this design considers only one degree of inbreeding (at a constant F), it cannot decouple dominance parameters D*2, σ2D, and H* (Wright and Cockerham 1986) but in most cases (i.e., rare alleles) this composite estimate is dominated by D*2. Maximum-likelihood approaches are typically used to estimate variance components in inbred populations (e.g., Shaw et al. 1998; Edwards and Lamkey 2002; Kelly and Arathi 2003) but these analyses are probably not necessary when the inbreeding designs are balanced and not too complex.
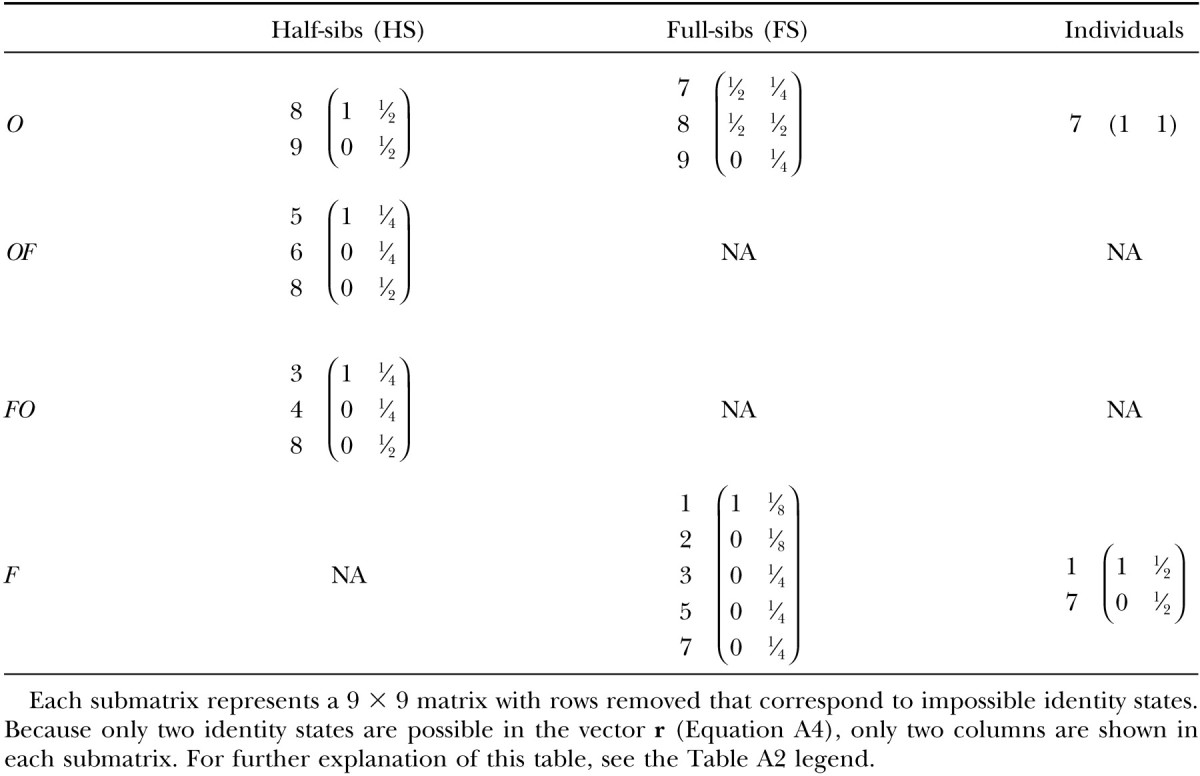
TABLE A2 .
Probability transition matrices (A) used to derive identity of relatives of generationgafter an arbitrary number of sib-mated generations
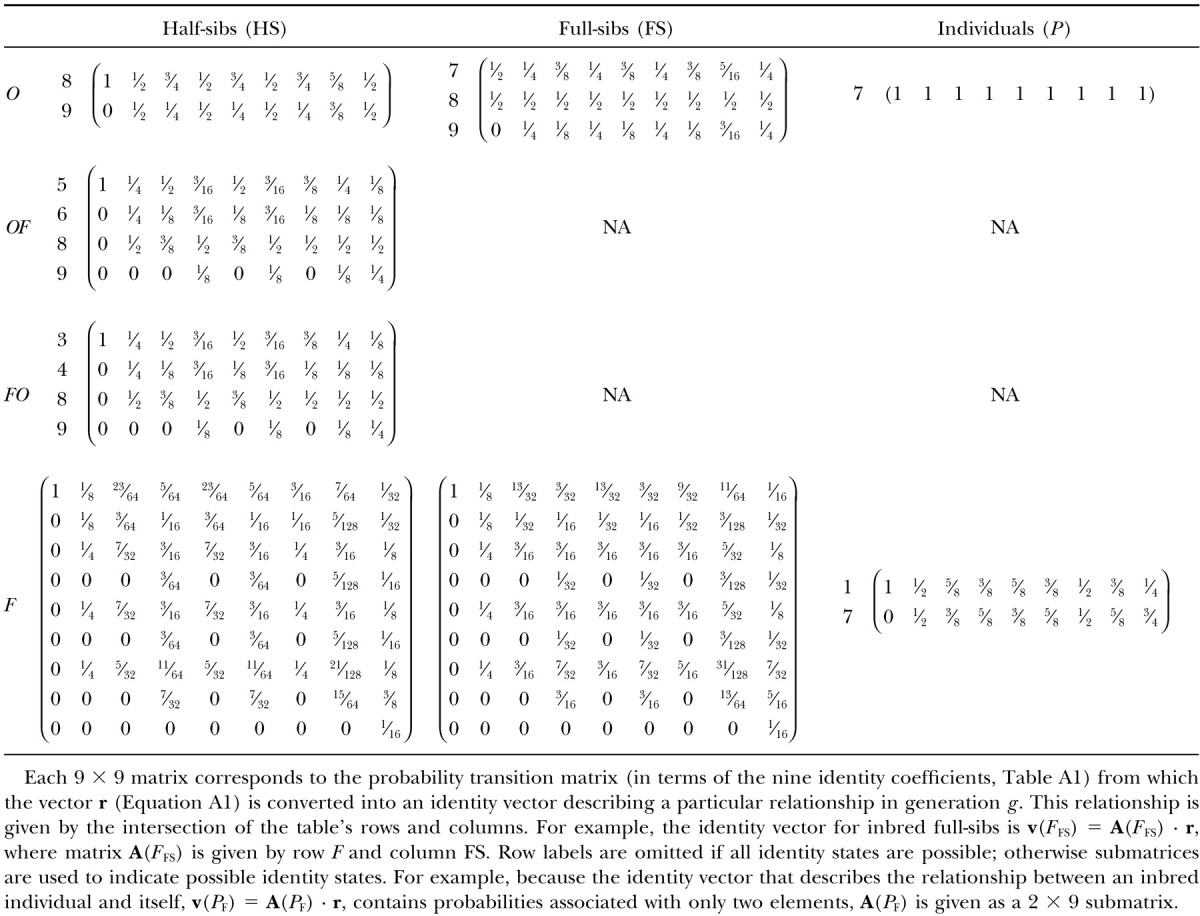
TABLE 5 .
Dissection of genetic variance using elements of the variation in inbreeding depression effects for one generation of sib-mating
DISCUSSION
By solving for probabilities specific to a given system of inbreeding, variation in inbreeding depression can be described in terms of genetic variance components. These variance components have been dealt with extensively by several authors with varying forms of notation (see Walsh and Lynch 2000, p. 298; Kelly 2004), often in the context of the joint effects of inbreeding and selection. These variance components may be estimated by using linear combinations of the variance and covariance of inbred and outbred paternal half-sib, i.e., sire effects. Because our model is general to the number of inbred generations, the theory is predictive and testable. For example, if genetic variance components were estimated after a single generation of sib-mating, the magnitude of variation in inbreeding depression could be predicted for any subsequent generation.
Usually lineage-specific inbreeding depression is measured on a scale relative to the outbred mean phenotype. For example, Lande and Schemske (1985) measure the mean family-level inbreeding phenotype after a period of inbreeding to degree f, as  ; this is the mean of the individual values of relative inbreeding depression for each family. In contrast, like Pray and Goodnight (1995), we consider inbreeding depression on an absolute scale,
  , and find that variation in inbreeding depression is caused by the stochastic segregation among sire lines of several genetic effects, including additive genetic variation. Thus, even in the absence of dominance, we can expect ID to vary among inbred lineages. Our analytical finding agrees with that demonstrated in population genetic simulations by Schultz and Willis (1995). However, Schultz and Willis (1995), like many other theoretical studies of mating-system evolution, use the relative measure of inbreeding depression that has been shown by Johnston and Schoen (1994) and Lynch and Walsh (1998)(p. 268) to generate biased estimates of mean inbreeding depression when estimated with limited numbers of offspring. We demonstrate below that even with an infinite number of offspring, the mean and variance of such relative measures of inbreeding depression are likely to be biased.
Consider the outbred and inbred family means,  o and
o and  f, and population means,
  and
and  . Following the methods of Lynch and Walsh (1998)(p. 818) for finding the expectation of a ratio,
 |
9 |
Given our results above, we can quantify the bias of this estimate for any case of regular inbreeding for the typical experimental study of inbreeding depression in plants conducted without replication of unrelated dams and with a single generation of selfing. In this case, additive genetic variance, dominance variance, and the covariance between additive and homozygous dominance deviations contribute toward the bias in ratio estimates of mean inbreeding depression,
 |
10 |
The estimate of variance in relative inbreeding depression is also biased. Following Lynch and Walsh (1998)(p. 818), mean inbreeding depression changes the way the variance is calculated:
 |
11a |
By expanding the numerator, we see that changes in population means with inbreeding affect the relative weightings of genetic variance components:
 |
11b |
Because of the weights of variance and covariance components on the right-hand side of Equation 11b, it is not likely that the variation in proportional inbreeding depression will closely resemble the variance of absolute inbreeding depression. Again, we reconsider the case of unreplicated dams and a single generation of selfing. From Table 4, we know that variation in inbreeding depression taken on the absolute scale is independent of population means:
 |
12 |
On the relative scale, however, variation in inbreeding depression is confounded by population mean phenotypes (Equation 11b), specifically
 |
13 |
These relative genetic variance component weightings are unbiased only when  , i.e., when there is no population inbreeding depression! Thus, the most commonly used experimental design yields biased estimates of both the mean and the variance of inbreeding depression. Furthermore, the estimates contain components of genetic variance irrelevant to the genetic causes of inbreeding depression and will result in nonzero estimates of
  even in the absence of net direction dominance. Finally, provided that phenotypes are normally distributed within an inbreeding class (or in the outbred population), we expect that the distribution of inbreeding depression across sires is normally distributed with mean equal to the average of all IDi (Equation 2) and variance given in Equation 4. In contrast, Johnston and Schoen (1994) report skew for simulated distributions of inbreeding depression, a result they attribute to “nonlinear functions of self- and outcrossed values.” Our Equations 10 and 13 model this nonlinearity for a single generation of selfing. For these reasons, we argue that relative measures of inbreeding depression are of dubious relevance to evolutionary genetics.
Intuitively, we expect that lineage-level selection would operate on an absolute scale without regard for a relative measure of inbreeding depression. For example, lines that enjoy a fitness advantage when outbred (relative to other outbred lines) and an advantage when inbred (relative to other inbred lines) will have high fitness regardless of the lines' proportional inbreeding depression. Alternatively, a line that performs poorly regardless of mating system is unlikely to thrive despite little proportional inbreeding depression. Lineage-specific fitness depends upon the outbred phenotype, the inbred phenotype, and the covariation between the two (weighted by the frequencies of the classes). Although not all absolute measures of lineage-specific inbreeding depression (e.g., Pray and Goodnight 1995) are indicative of lineage-specific fitness, they do have the advantage of providing information from which to draw quantitative genetic inferences as we have shown above. These inferences are important because they allow us to make quantitative predictions regarding the response to selection with inbreeding (Cornelius and Dudley 1976; Cockerham and Matzinger 1985).
Because of the genetic covariance between the outbred and inbred phenotypes, inbreeding depression will evolve as a by-product of natural selection in an outbreeding population, in the same way that hybrid inviability between populations evolves as a by-product of local adaptation within populations. When the genetic covariance is positive, selection within an outbreeding population will mitigate future inbreeding depression. Conversely, the outbred phenotype evolves as a correlated response to selection within inbreeding populations. When the genetic covariance is negative, selection within an inbreeding population could impede a later transition to outbreeding as a correlated response. Because both σ2A and D1 components exclusively contribute to the covariance between outbred and inbred phenotypes and D1 is positive with respect to fitness under the deleterious, recessive model of inbreeding depression, we expect the former: lineages that are good outcrossers are good inbreeders.
Although inbreeding depression is often thought of as a trait, it is useful to consider it to be a genetic effect, such as a sire effect. Genetic variation will generate a normal distribution of inbreeding depression effects, just as it will for any effect with a genetic basis and this distribution will have both a mean and a variance. Genetic models that translate the first moment of this distribution (mean inbreeding depression) into mean genetic effects (e.g., additive effects, dominance effects, etc.) have existed for the last half-century (Morton et al. 1956; Crow and Kimura 1970; Lynch 1991). These models are useful for understanding extant patterns of trait values, such as assessing the relative dominance (or epistatic) contributions toward some trait mean, but, because they do not inform us as to the relationship between genetic variation and inbreeding depression, they are not adequate for predicting response to selection (such as the mitigation of mean inbreeding depression by purging). In contrast, theory that explicitly links genetic variation to selection with inbreeding is well developed (Cornelius and Dudley 1976; Cockerham and Matzinger 1985; Wright and Cockerham 1986). The deficiency in current inbreeding theory is that the observable variation in inbreeding depression and the selectively relevant variation in genetic effects have not been reconciled. In other words, measurements of the variance in inbreeding depression have no quantitatively predictive value in regard to the response to selection with inbreeding. Our ANOVA-based approach for inferring the genetic architecture of inbreeding depression from variation in inbreeding depression bridges the empirically measurable and the theoretically useful.
Acknowledgments
We thank John Kelly, Bruce Walsh, Elizabeth Housworth, and two anonymous reviewers for comments on the article. This work was supported by National Science Foundation grant DEB 0206628.
APPENDIX
Sib-mating:
The vector r describes the relationship between the most recent common ancestral pair of all related inbred individuals of generation g (Figure 1, asterisks) in terms of Jacquard coefficients (Table A1). Note that all related outbred progeny are related to these grandparents through their common sire.
TABLE A1 .
Jacquard's condensed identity coefficients
| Jacquard coefficient | Probability that for individuals i and j |
|---|---|
| Δ1 | i1 = i2 = j1 = j2 |
| Δ2 | i1 = i2 ≠ j1 = j2 |
| Δ3 | i1 = i2 = j1 ≠ j2 or i1 = i2 = j2 ≠ j1 |
| Δ4 | j2 ≠ i1 = i2 ≠ j1 and j1 ≠ j2 |
| Δ5 | i1 ≠ i2 = j1 = j2 or i2 ≠ i1 = j1 = j2 |
| Δ6 | i2 ≠ j1 = j2 ≠ i1 and i1 ≠ i2 |
| Δ7 | i1 = j1 ≠ i2 = j2 or i1 = j2 ≠ j1 = i2 |
| Δ8 | Identity is shared between i and j through only one pair of alleles |
| Δ9 | No identity is shared between any alleles of i and j |
 |
A1 |
This vector summarizes all inbreeding prior to generation g − 2. This identity vector serves as a benchmark with which we generate a series of new identity vectors that describe all relationships within and between individuals of generation g. Five vectors correspond to siblings pairs: outbred full-sibs, v(OFS); outbred half-sibs, v(OHS); half-sibs in which one individual is outbred and the other is inbred, v(OF); the alternative, v(FO); inbred full-sibs, v(FFS); and inbred half-sibs, v(FHS). In addition, there are two vectors describing the resemblance within individuals: outbred individuals, v(O), and inbred individuals, v(F). All identity vectors for generation g can be derived by taking the product of r and the probability transition matrix A specific to the type of relationship (given in Table A2).
Once we have the identity vectors for all siblings and individuals in generation g (the various v vectors), we may translate them into variance components. For any v describing relatives i and j, the genetic covariance between them is σ(i, j) = T · v(i, j) − FiFjH* (Harris 1964; Cockerham 1971; Jacquard 1974), where
 |
and
 |
A2 |
Note that FiFj ≠ 0 if and only if both individuals are inbred. Because all inbred individuals are equally inbred in this design, we may define F such that F2 = FiFj.
We find sire, dam, and error effects variances for outbred and inbred cases by using combinations of these sibling and individual covariances. The sire effect variances are simply the half-sib covariances within outbred and inbred treatments. The covariance between outbred and inbred sire effects is the covariance between outbred and inbred half-sibs. The variation in inbreeding depression effects is a sum of these. Following from Equations 3a and A2,
 |
A3a |
Dam effect variances are the differences between full-sib and half-sib covariances. Outbred and inbred dam effect variances are
 |
A3b |
Error variance (the within-full-sib family variation) is found by subtracting the full-sib covariance from the covariance of individuals with themselves. For outbred and inbred cases, these are
 |
A3c |
All effect variances and covariances are simplified and summarized in Table 3.
Selfing:
Finding inbreeding depression, sire, dam, and error effect variances is simpler with selfing than with sib-mating. In this case, the vector r describes the identity shared within the hermaphrodite at generation g − 1 that sires both selfed and outcrossed individuals (Figure 1A, individual with two asterisks). This vector has zero probabilities for all identity states except Δ1 and Δ7.
 |
A4 |
As with sib-mating, we use this vector to generate identity vectors for all relationships within and between individuals of generation g. Because there is only one inbred family per sire, there are no inbred half-sibs. Consequently, we cannot decouple inbred sire and inbred dam effect variance. As indicated in Equation 3b, both terms are included in our definition of the variation in inbreeding depression effects. All identity vectors for generation g can be derived by taking the product of the vector r and the probability transition matrix A specific to the type of relationship and given in Table A3. We find resemblances between relatives (and within individuals) by using Equation A2 and find effect variances by taking sums and differences of these resemblances (as for sib-mating). Effect variances for selfing are simplified and summarized in Table 3. One important difference noted above is that the inbreeding depression effect variance now includes the inbred dam effect variance. For this reason, we use the covariance between inbred full-sibs rather than that between inbred half-sibs:
 |
A5 |
TABLE A3 .
Probability transition matrices (A) used to derive identity of relatives of generationgafter an arbitrary number of selfed generations
References
- Agren, J., and D. W. Schemske, 1993. Outcrossing rate and inbreeding depression in two annual monoecious herbs, Begonia hirsute and B. semiovata. Evolution 47 125–135. [DOI] [PubMed] [Google Scholar]
- Byers, D. L., and D. M. Waller, 1999. Do plant populations purge their genetic load? Effects of population size and mating history on inbreeding depression. Annu. Rev. Ecol. Syst. 30 479–513. [Google Scholar]
- Charlesworth, D., and B. Charlesworth, 1987. Inbreeding depression and its evolutionary consequences. Annu. Rev. Ecol. Syst. 18 237–268. [Google Scholar]
- Cockerham, C. C., 1971. Higher order probability functions of identity of alleles by descent. Genetics 69 235–246. [DOI] [PMC free article] [PubMed] [Google Scholar]
- Cockerham, C. C., 1983. Covariances of relatives from self-fertilization. Crop Sci. 23 1177–1180. [Google Scholar]
- Cockerham, C. C., and D. F. Matzinger, 1985. Selection response based on selfed progenies. Crop Sci. 25 483–488. [Google Scholar]
- Cockerham, C. C., and B. S. Weir, 1968. Sib mating with two linked loci. Genetics 60 629–640. [DOI] [PMC free article] [PubMed] [Google Scholar]
- Cockerham, C. C., and B. S. Weir, 1983. Variance in actual inbreeding. Theor. Popul. Biol. 23 85–109. [DOI] [PubMed] [Google Scholar]
- Cockerham, C. C., and B. S. Weir, 1984. Covariances of relatives stemming from a population undergoing mixed self and random mating. Biometrics 40 157–164. [PubMed] [Google Scholar]
- Cornelius, P. L., 1988. Properties of components of covariance of inbred relatives and their estimates in a maize population. Theor. Appl. Genet. 75 701–711. [Google Scholar]
- Cornelius, P. L., and J. W. Dudley, 1976. Genetic variance components and predicted response to selection under selfing and full-sib mating in a maize population. Crop Sci. 16 333–339. [Google Scholar]
- Crow, J. F., and M. Kimura, 1970 An Introduction to Population Genetics Theory. Alpha Editions, Edina, MN.
- Darwin, C., 1877 Different Forms of Flowers of Plants of the Same Species. J. Murray, London.
- Edwards, J. W., and K. R. Lamkey, 2002. Quantitative genetics of inbreeding in a synthetic maize population. Crop Sci. 42 1094–1104. [Google Scholar]
- Falconer, D. S., 1985. A note on Fisher's ‘average effect’ and ‘average excess’. Genet. Res. 46 337–347. [DOI] [PubMed] [Google Scholar]
- Falconer, D. S., and T. F. C. Mackay, 1996 Introduction to Quantitative Genetics, Ed. 4. Longman Scientific & Technical, Harlow, UK.
- Fowler, K., and M. C. Whitlock, 1999. The variance in inbreeding depression and the recovery of fitness in bottlenecked populations. Proc. R. Soc. Ser. B 266 2061–2066. [DOI] [PMC free article] [PubMed] [Google Scholar]
- Goodnight, C. J., 1988. Epistasis and the effect of founder events on the additive genetic variance. Evolution 42 441–454. [DOI] [PubMed] [Google Scholar]
- Harris, D. L., 1964. Genotypic covariance between inbred relatives. Genetics 50 1319–1348. [DOI] [PMC free article] [PubMed] [Google Scholar]
- Holsinger, K. E., 1988. Inbreeding depression doesn't matter: The genetic basis of mating-system evolution. Evolution 42 1235–1244. [DOI] [PubMed] [Google Scholar]
- Jacquard, A., 1974 The Genetic Structure of Populations. Springer-Verlag, New York.
- Johnston, M. O., and D. Schoen, 1994. On the measurement of inbreeding depression. Evolution 48 1735–1741. [DOI] [PubMed] [Google Scholar]
- Kalisz, S., 1989. Fitness consequences of mating system, seed weight, and emergence date in a winter annual, Colinsia verna. Evolution 43 1263–1272. [DOI] [PubMed] [Google Scholar]
- Kelly, J. K., 2004. Family level inbreeding depression and the evolution of plant mating systems. New Phytol. 165 55–62. [DOI] [PubMed] [Google Scholar]
- Kelly, J. K., and H. S. Arathi, 2003. Inbreeding and the genetic variance of floral traits in Mimulus guttatis. Heredity 90 77–83. [DOI] [PubMed] [Google Scholar]
- Lande, R., and D. W. Schemske, 1985. The evolution of self-fertilization and inbreeding depression. I. Genetic models. Evolution 39 24–40. [DOI] [PubMed] [Google Scholar]
- Lynch, M., 1991. The genetic interpretation of inbreeding depression and outbreeding depression. Evolution 45 622–629. [DOI] [PubMed] [Google Scholar]
- Lynch, M., and J. B. Walsh, 1998 Genetics and Analysis of Quantitative Traits. Sinauer Associates, Sunderland, MA.
- Morton, N. E., J. F. Crow and H. J. Muller, 1956. An estimate of the mutational damage in man from data on consanguineous marriages. Proc. Natl. Acad. Sci. USA 42 855–863. [DOI] [PMC free article] [PubMed] [Google Scholar]
- Mutikainen, P, and L. F. Delph, 1998. Inbreeding depression in gynodioecious Lobelia siphilitica: among-family differences override between-morph differences. Evolution 52 1572–1582. [DOI] [PubMed] [Google Scholar]
- Pray, L. A., and C. J. Goodnight, 1995. Genetic variation in inbreeding depression on the red flour beetle Tribolium castaneum. Evolution 49 176–188. [DOI] [PubMed] [Google Scholar]
- Schultz, S. T., and J. H. Willis, 1995. Individual variation in inbreeding depression: the roles of inbreeding history and mutation. Genetics 141 1209–1223. [DOI] [PMC free article] [PubMed] [Google Scholar]
- Shaw, R. G., D. L. Byers and F. H. Shaw, 1998. Genetic components of variation in Nemophila menziesii undergoing inbreeding: morphology and flowering time. Genetics 150 1649–1661. [DOI] [PMC free article] [PubMed] [Google Scholar]
- Takebayashi, N., and L. F. Delph, 2000. An association between a floral trait and inbreeding depression. Evolution 54 840–846. [DOI] [PubMed] [Google Scholar]
- Uyenoyama, M. K., K. E. Holsinger and D. M. Waller, 1993. Ecological and genetic factors directing the evolution of self-fertilization. Oxf. Surv. Evol. Biol. 9 327–381. [Google Scholar]
- Walsh, J. B., and M. Lynch, 2000 Evolution and Selection of Quantitative Traits (http://nitro.biosci.arizona.edu/zbook/volume_2/chapters/vol2_10.html).
- Wright, A. J., and C. C. Cockerham, 1986. Covariances of relatives and selection response in generations of selfing from an outcrossed base population. Theor. Appl. Genet. 72 689–694. [DOI] [PubMed] [Google Scholar]