Abstract
A 2D NMR method is presented for the measurement of the dipole-dipole interaction between a proton and a low-frequency nuclear spin species in the solid state under the magic angle spinning. It employs the time averaged nutation concept to dramatically reduce the required radio frequency (rf) power on the low γ nuclear channel and spin exchange at the magic angle is used to suppress 1H-1H dipolar interactions and chemical shifts. The flexibility in choosing the spinning speed, rf power and the scaling factor of the pulse sequence are of considerable importance for the structural studies of biological solids. The performance of the pulse sequence has been numerically and experimentally demonstrated on several solids.
1. Introduction
Heteronuclear dipole-dipole coupling measurements are an important aspect of solid-state NMR structure determination of biological solids. Several techniques have been used to recover the heteronucelar dipolar interaction between abundant (typically 1H) and rare (typically 13C or 15N) spins that are usually averaged out by the magic angle spinning (MAS) [1-7]. Polarization inversion spin exchange at the magic angle (PISEMA) [1,8-10] is one of the most frequently used methods to measure the dipolar coupling between a 1H nucleus and a low γ nucleus such as 13C or 15N. Excellent features of the PISEMA pulse sequence have also led to applications under MAS [1,9,11,12]. PISEMA suppresses homonuclear 1H spin-spin interactions, provides most of the heteronuclear dipolar coupling (about 81.6% under static and 57.7% under MAS), has a short cycle time, and avoids rotor synchronization and is independent of the spinning speed of the sample for studies under MAS. Another unique advantage of this sequence over Lee-Goldburg-cross-polarization (LG-CP) [1,10,13,14], flip-flop Lee-Goldburg-cross-polarization (FFLG-CP) [1,10,13] or spin exchange at the magic angle-cross-polarization (SEMA-CP) [1,10] is the sensitivity doubling due to the polarization inversion [1,8,10]. However, the main disadvantage of this sequence, particularly under MAS, is the high radio frequency (rf) power required in the low γ (or S nuclei) channel to satisfy the SEMA condition in the t1 period (Fig. 1) [1]. While fast sample spinning increases the sensitivity in general, it also increases the required rf power. For example, use of a 50 kHz 1H rf field produces an effective magic angle irradiation of 61.2 kHz during the SEMA sequence. This experimental condition requires a 61.2 ± 10 kHz rf field strength to spin-lock S spins under a spinning speed of 10 kHz. As a result, ∼1 kW for 15N or ∼500 W for 13C is essential to perform PISEMA experiments even when a low power (that is 50 kHz) is used for FFLG. Since the line narrowing efficiency and the scaling factor of PISEMA are 1H-offset dependent [1,15], it is important to use a higher rf field strength for the FFLG decoupling which further increases the rf power required in the PISEMA experiments. In addition, experiments on the power lossy wet biological solids or at a high magnetic field demand even more rf power [16]. We propose a technique to overcome this difficulty. This technique, polarization inversion spin exchange at the magic angle-magic angle spinning (PITANSEMA-MAS), combines the advantages of time averaged nutation (TAN) and SEMA concepts [17,18]. The efficiency of the sequence is examined numerically and experimentally on several solids. Our results suggest that the proposed PITANSEMA-MAS technique requires an order of magnitude less rf power to spin-lock the low γ nuclei than the PISEMA experiment.
Fig. 1.
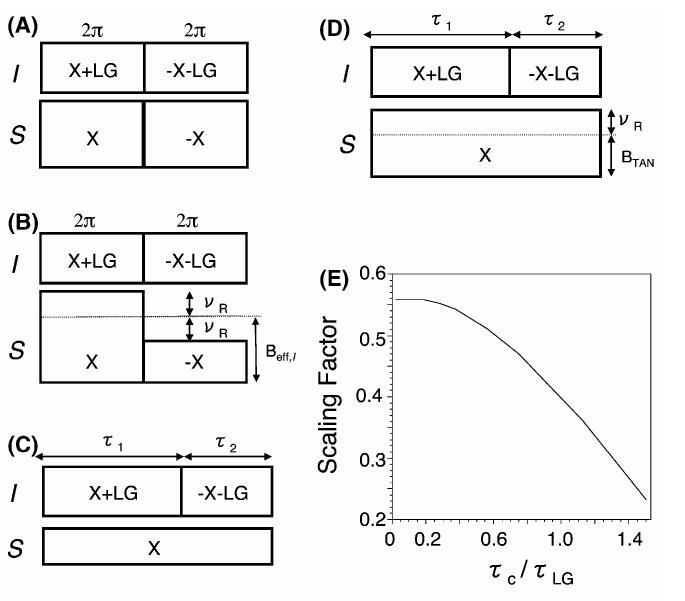
RF pulse sequences for the spin exchange at magic angle (SEMA) via the heteronuclear (I and S) dipolar coupling. (A) SEMA, (B) SEMA-MAS, (C) TANSEMA and (D) TANSEMA-MAS pulse sequences. (E) Variation of the scaling factor of the PITANSEMA-MAS as a function of τc/τLG for a time averaged factor, (τ1 - τ2)/τc, of 1/3; τc is a cycle time of TANSEMA-MAS and τLG is the 2π duration of the LG sequence. An rf field strength of 62.5 kHz for FFLG and an NH dipolar coupling of 10 kHz were used in the simulation. BTAN is the effective nutation field, νr is the spinning speed, and LG stands for Lee-Goldburg.
2. Method
RF pulse sequences for the spin exchange (or polarization transfer) via the heteronuclear (I and S) dipolar coupling are sketched in Fig. 1. The spin-locks suppress the chemical shift interactions of both nuclei, FFLG sequence suppresses the I-I dipolar interaction [19-22], and when the effective field strength of the spin-locks match (for example in the SEMA sequence given in Fig. 1A), spin exchange between the strongly coupled I and S nuclei are enabled. These sequences significantly suppress weak heteronuclear interactions and lead to a high-resolution dipolar-coupling spectrum [1,10,23]. In a 2D experiment like PISEMA, following the initial preparation of magnetization (i.e., cross polarization with - x phase spin-locks from I to S and a 35.3y° pulse to flip back the Ix magnetization to the magic angle), these sequences in Fig. 1 are employed in the t1 period. SEMA sequences for static and MAS conditions are given in Figs. 1A,B, respectively. To avoid the averaging of the heteronuclear dipolar interactions under fast MAS, in SEMA-MAS (Fig. 1B), the difference in the two spin-lock field strengths is matched to the spinning sidebands: Beff,I - Brf,S = nνr; where Beff,I is the effective spin-lock field strength, , in the I channel, Boff is the offset frequency, Brf,S is the rf field strength in the S channel, and νr is the spinning speed. The extent of recovered I-S dipolar coupling is higher when n =±1 sideband than n = ±2 or ±3. The splitting between the two singularities in a dipolar-coupled spectrum obtained using SEMA-MAS is DISM cos θm, where DIS is the I-S dipolar coupling and θm is the magic angle.
To reduce the required rf field strength in the S spin channel, the TAN and SEMA concepts were used to obtain the TANSEMA [17,18] sequence (Fig. 1C). In this sequence, the unequal τ1 and τ2 durations generate an effective nutation field (BTAN) in the I channel that is matched with the S spin-lock field strength: Brf,S = {(τ1 - τ2)/(τ1 + τ2)}Beff,I. This TANSEMA sequence for static experiments is modified for studies under MAS (TANSEMA-MAS) as shown in Fig. 1D. In TANSEMA-MAS, the matching condition for an effective spin exchange is given as {(τ1 - τ2)/(τ1 + τ2)}Beff,I - Brf,S = nνr with n = ±1. The values of τ1 and τ2 can be chosen to alter the scaling factor of the pulse sequence as shown in Fig. 1E. Supercycles can also be constructed to overcome some of the experimental problems, such as rf field inhomogeneity or offset, and to match the desired extent of recovered I and S dipolar coupling as explained for the static case [17]. This TANSEMA-MAS sequence (Fig. 1D) dramatically reduces the required rf power as compared to the sequence given in Fig. 1B.
3. Results and discussion
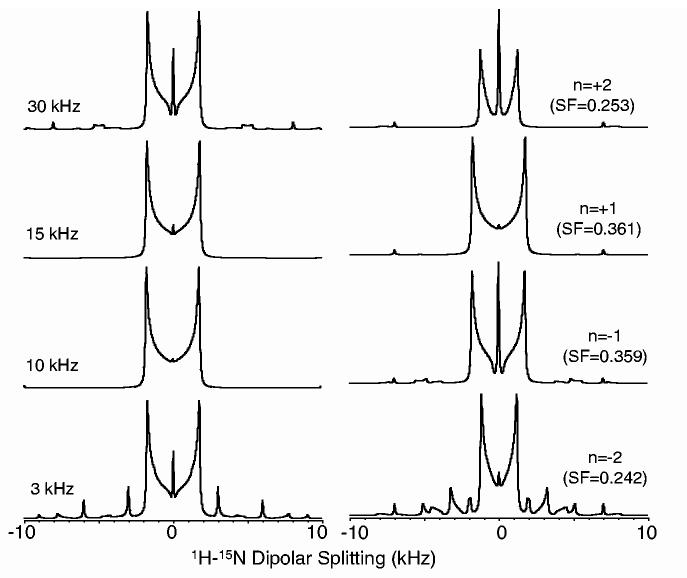
All experiments were carried out on a Chemagnetics/Varian Infinity 400 MHz and a Varian INOVA 800 MHz spectrometers at room temperature. A 5 mm HXY and a 2.5 mm HCN triple resonance probes were used in 400 and 800 MHz, respectively. Powder samples of n-acetyl-d,l-15N-valine (NAV), natural abundance d,l-alanine and 2-13C-leucine were used. All the experimental conditions are given in the figure caption. All simulations were carried out using Simpson [24] on a PC. Two spins (1H and 15N with a dipolar coupling constant of 9.8 kHz or 1H and 13C with a dipolar coupling constant of 20 kHz) and 376 crystallite orientations were considered in the simulations. All other parameters were as used in the experiments. Simulated 1H-13C dipolar coupling spectra obtained using the PITANSEMA-MAS sequence are given in Fig. 2 for various spinning speeds and for matching with the first (n = ±1) and second (n = ±2) sidebands. While the scaling factor of the sequence is independent of the spinning speed, it decreases with the increasing |n| value with an optimum lineshape for the n = ±1 condition. Sidebands can be seen for slow spinning speeds.
Fig. 2.
Simulated PITANSEMA-MAS spectra for various spinning speeds and spinning sideband-matching condition. Nutation angles of 1.5π and 0.75π with an NH dipolar coupling of 9.8 kHz were used. Scaling factor (SF) for each condition is given.
2D PITANSEMA-MAS experiments with various values of the scaling factor were carried out at many different spinning speeds. While the pulse sequence recovered 1H-15N dipolar coupling under various spinning speeds, the magnitude of the recovered interaction depended on the τi values (Fig. 1E). Sample spectra obtained from the NAV powder sample are compared with simulations in Fig. 3. These results indicate that the experimental and simulated results are in good agreement. Experimentally measured dipolar splittings for various experimental conditions (such as τi values, rf power and spinning speed) are identical. The spinning sidebands can be seen for spectra obtained with a large scaling factor. As shown in Fig. 3B, the resolution can be enhanced using a super cycle. Except for the scaling factor, the line shape obtained from a PITANSEMA-MAS experiment was similar to that obtained using PISEMA-MAS. However, it is important to note that the rf power used in a PITANSEMA-MAS experiment (at a 7 kHz spinning speed) was ∼11 times less than that of PISEMAMAS. This factor increased when the spinning speed increased, as a high rf power is essential to match the +1 spinning sideband. Use of +2 sidebands not only decreased the extent of recovered dipolar coupling but also increased the rf power needed in the experiment.
Fig. 3.
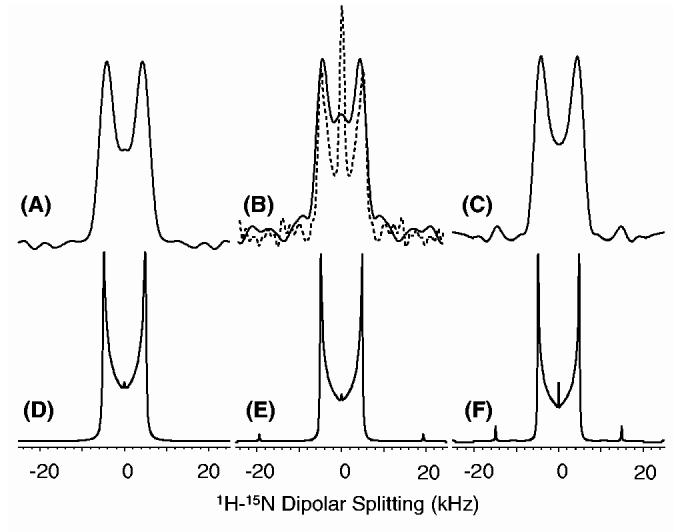
Experimental (A, B and C) and simulated (D, E and F) 1H-15N dipolar coupling spectral lines obtained using the 2D PITANSEMA-MAS sequence (Fig. 1D) under 7 kHz MAS. Experimental spectra were obtained from an n-acetyl-d,l-15N-valine powder sample. A 50 kHz rf field for the preparation period, a 62.5 kHz rf field with an offset of 44.19 kHz for FFLG in the t1 period, and a 62.5 kHz TPPM decoupling of protons during the 15N signal acquisition were used. Other experimental parameters include a 0.5 ms cross-polarization time, 64 t1 experiments, 4 scans and a 4 S recycle delay. (τ1, τ2) Values of (30.76 μs, 15.38 μs), (23.08 μs, 11.54 μs) and (15.38 μs, 7.69 μs) were used to obtain spectra (A and D), (B and E) and (C and F), respectively. Scaling factors of 0.232, 0.361 and 0.470 were used for (A and D), (B and E) and (C and F), respectively. The dashed line spectrum in B was obtained using 3-cycles while all other spectra (solid line) were obtained using 1-cycle of TANSEMA-MAS.
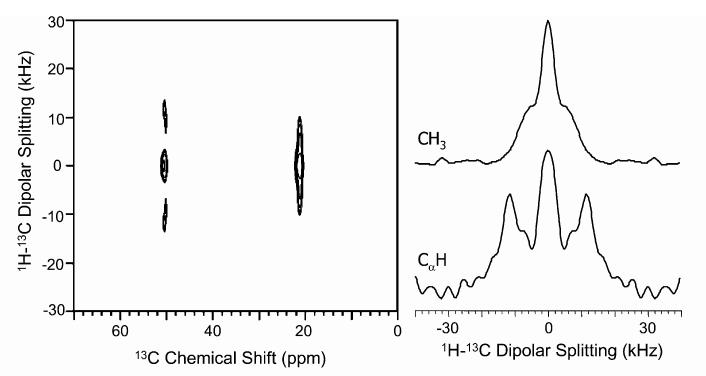
Similar experiments were also carried out on natural abundance alanine and 2-13C-leucine powder samples. A 2D PITANSEMA-MAS spectrum of alanine along with the dipolar coupling slices is given in Fig. 4. The dipolar coupling is measurable for both the sites even though a zero-frequency peak is present. The measured Cα-H dipolar coupling provides an accurate measurement of the bond length. The zero-frequency peak could be attributed to the 13C magnetization that does not participate in the spin exchange process during the t1 period of the sequence in addition to the contribution from the isotropic peak. The results obtained from alanine suggested that the sequence is efficient and can be used to measure internuclear distances in natural abundance samples. Therefore, this sequence can be applied to study biological and liquid crystalline materials that are sensitive to rf heat without the need for isotope enrichment.
Fig. 4.
2D Experimental PITANSEMA-MAS spectrum that correlates the 13C isotropic chemical shift and 1H-13C dipolar coupling of natural abundance d,l-alanine powder sample. The 1H-13C dipolar coupling slices extracted from the 2D spectrum are given for the methyl (21.4 ppm) and alpha (50.5 ppm) carbons. (τ1, τ2) Values of (23.08 μs, 11.54 μs) with a scaling factor of 0.36 were used. All other experimental conditions were as given in Fig. 3.
Experiments and simulations were performed on a 2-13C-leucine powder sample to examine the effects of offset frequencies of 1H and 13C resonances and the results are given in Fig. 5. The results suggest that the scaling factor of the sequence depends on the proton offset frequency while it is relatively less sensitive to 13C offset. The dependence on the 1H offset is not surprising as offresonance irradiation is used to suppress the 1H-1H dipolar couplings in the FFLG sequence. On the other hand, it is interesting to note the tolerance of the sequence towards 13C offset even though very low rf power was used in the PITANSEMA experiment. However, PISEMA-MAS is relatively less sensitive to offset effects than PITANSEMA-MAS (Figs. 5B,D). These effects can be understood using the theoretical analysis of the spin dynamics related to an offresonance heteronuclear coherence transfer process [13,18,25,26].
Fig. 5.
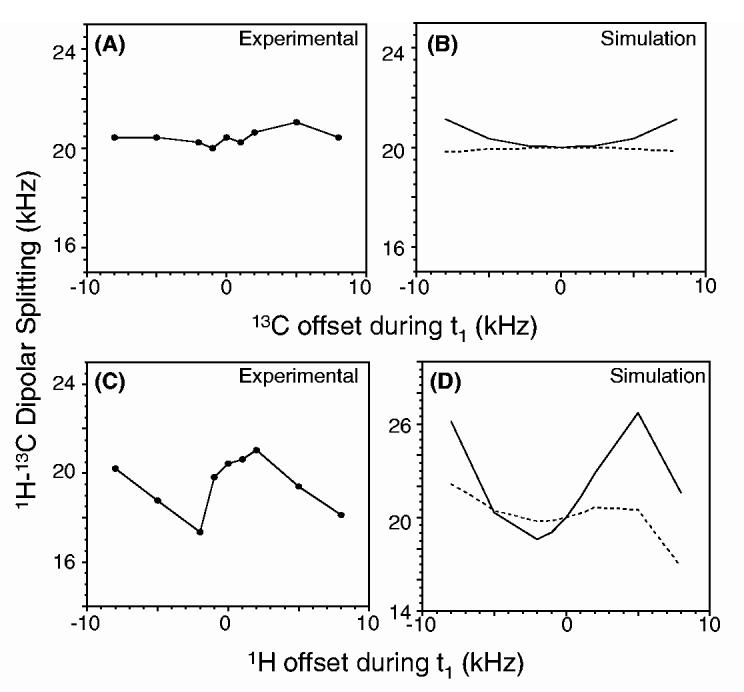
Experimental (A and C) and simulated (B and D) values of the 1H-13C dipolar coupling as a function of offset frequencies of 13C (A and B) and 1H (C and D) resonances. Solid and dashed lines are for PITANSEMA-MAS and PISEMAMAS, respectively. All other experimental conditions were as given in Fig. 4. In the simulations, an rf field strength of 62.5 kHz for FFLG and a dipolar coupling of 20 kHz were used.
4. Conclusions
We have demonstrated a low rf power pulse sequence, known as PITANSEMA-MAS, in which a combination of TAN and SEMA was used to recover the heteronuclear dipole-dipole interactions. This sequence requires an order of magnitude less power than the PISEMA-MAS sequence, while the spectral resolution and line shape are similar in both the cases. This sequence would be highly valuable for systems where spin-locking of the transverse magnetization for heteronuclear coherence transfer is difficult [7,27]. The experimental results suggest that the performance of the sequence is independent of the spinning speed and rf power whereas it depends on the offset frequency of protons. Since the efficiency of the sequence is not limited by the rotor synchronization, the sensitivity and resolution enhancements rendered by the fast MAS can be retained in various multidimensional experiments. In addition, our results indicate that the method can be used to measure heteronuclear distances even without the need for isotope enrichment. The measured dipolar couplings can also be used to determine the structure and characterize the dynamics of rigid solids and mobile systems such as membrane bilayers and liquid crystalline materials [28-31].
Acknowledgments
This research was supported by the research funds from NIH (AI054515 to A.R). We thank Dr. Zuiderweg for his interest in this work and help with the 800 MHz spectrometer. David Rice from Varian is acknowledged for support during various stages of the experiment in Varian 800 MHz spectrometer.
References
- 1.Ramamoorthy A, Wei Y, Lee DK.Ann. Rep. NMR Spectrosc 2004522and references cited therein [Google Scholar]
- 2.Fujiwara T, Shimomura T, Akutsu H. J. Magn. Reson. 1997;124:147. [Google Scholar]
- 3.Gross JD, Costa PR, Griffin RG. J. Chem. Phys. 1998;108:7286. [Google Scholar]
- 4.Takegoshi K, Terao T. Solid State Nucl. Magn. Reson. 1999;13:203. doi: 10.1016/s0926-2040(99)00005-3. [DOI] [PubMed] [Google Scholar]
- 5.Saalwachter K, Graf R, Spiess HW. J. Magn. Reson. 1999;140:471. doi: 10.1006/jmre.1999.1856. [DOI] [PubMed] [Google Scholar]
- 6.Hohwy M, Jaroniec CP, Reif B, Reinstra CM, Griffin RG. J. Am. Chem. Soc. 2000;122:3218. [Google Scholar]
- 7.Zhao X, Hoffbauer W, auf der Gunne J. Schmedt, Levitt MH. Solid State NMR Spectrosc. 2004;26:57. doi: 10.1016/j.ssnmr.2003.11.001. [DOI] [PubMed] [Google Scholar]
- 8.Wu CH, Ramamoorthy A, Opella SJ. J. Magn. Reson. 1994;A109:270. [Google Scholar]
- 9.Ramamoorthy A, Opella SJ. Solid State NMR Spectrosc. 1995;4:387. doi: 10.1016/0926-2040(95)00054-t. [DOI] [PubMed] [Google Scholar]
- 10.Ramamoorthy A, Wu CH, Opella SJ. J. Magn. Reson. 1999;B110:102. doi: 10.1006/jmre.1999.1827. [DOI] [PubMed] [Google Scholar]
- 11.Ramamoorthy A, Gierasch LM, Opella SJ. J. Magn. Reson. 1996;140:131. doi: 10.1006/jmrb.1996.0016. [DOI] [PubMed] [Google Scholar]
- 12.Dvinskikh SV, Zimmermann H, Maliniak A, Sandstrom D. J. Magn. Reson. 2003;164:165. doi: 10.1016/s1090-7807(03)00180-0. [DOI] [PubMed] [Google Scholar]
- 13.Dvinskikh SV, Zimmermann H, Maliniak A, Sandstrom D. J. Chem. Phys. 2005;122:044512. doi: 10.1063/1.1834569. [DOI] [PubMed] [Google Scholar]
- 14.Ladizhansky V, Vega S. J. Chem. Phys. 2000;112:7158. [Google Scholar]
- 15.Yamamoto K, Lee DK, Ramamoorthy A. Chem. Phys. Lett. 2005;407:289. doi: 10.1016/j.cplett.2005.04.017. [DOI] [PMC free article] [PubMed] [Google Scholar]
- 16.Shekar SC, Lee DK, Ramamoorthy A. J. Am. Chem. Soc. 2001;123:7467. doi: 10.1021/ja016212t. [DOI] [PubMed] [Google Scholar]
- 17.Lee DK, Narasimhaswamy T, Ramamoorthy A. Chem. Phys. Lett. 2004;399:359. [Google Scholar]
- 18.Nishimura K, Naito A. Chem. Phys. Lett. 2005;402:245. [Google Scholar]
- 19.Lee M, Goldburg WI. Phys. Rev. A. 1965;140:1261. [Google Scholar]
- 20.Mehring M, Waugh JS. Phys. Rev. B. 1972;5:3459. [Google Scholar]
- 21.Bielecki A, Kolbert AC, de Groot HJM, Griffin RG, Levitt MH. Adv. Magn. Reson. 1990;14:111. [Google Scholar]
- 22.Ravikumar M, Ramamoorthy A. Chem. Phys. Lett. 1998;286:199. [Google Scholar]
- 23.Gan Z. J. Magn. Reson. 2000;143:136. doi: 10.1006/jmre.1999.1971. [DOI] [PubMed] [Google Scholar]
- 24.Bak M, Rasmussen JT, Nielsen NC. J. Magn. Reson. 2000;147:296. doi: 10.1006/jmre.2000.2179. [DOI] [PubMed] [Google Scholar]
- 25.Shekar SC, Ramamoorthy A. Chem. Phys. Lett. 2001;342:312. [Google Scholar]
- 26.Shekar SC, Lee DK, Ramamoorthy A. J. Magn. Reson. 2002;157:223. doi: 10.1006/jmre.2002.2587. [DOI] [PubMed] [Google Scholar]
- 27.Wei YF, Lee DK, Hallock KJ, Ramamoorthy A. Chem. Phys. Lett. 2002;351:42. [Google Scholar]
- 28.Lee DK, Santos JS, Ramamoorthy A. J. Phys. Chem. 1999;B103:8383. [Google Scholar]
- 29.Hallock KJ, Lee DK, Ramamoorthy A. J. Chem. Phys. 2000;113:11187. [Google Scholar]
- 30.Hallock KJ, Lee DK, Ramamoorthy A. Chem. Phys. Lett. 1999;302:175. [Google Scholar]
- 31.Hong M, Yao X, Jakes K, Huster D. J. Phys. Chem. 2002;B106:7355. [Google Scholar]


