

Abstract
The bacterial transposon Tn7 utilizes four Tn7-encoded proteins, TnsA, TnsB, TnsC and TnsD, to make insertions at a specific site termed attTn7. This target is selected by the binding of TnsD to attTn7 in a sequence-specific manner, followed by the binding of TnsC and activation of the transposase. We show that TnsD binding to attTn7 induces a distortion at the 5′ end of the binding site and TnsC contacts the region of attTn7 distorted by TnsD. Previous work has shown that a target site containing triplex DNA, instead of TnsD–attTn7, can recruit TnsABC and effect site- specific insertion of Tn7. We propose that the DNA distortion imposed by TnsD on attTn7, like the altered DNA structure via triplex formation, serves as a signal to recruit TnsC. We also show that TnsD primarily contacts the major groove of DNA, whereas TnsC is a minor groove binding protein. The footprint of the TnsC–TnsD–attTn7 nucleoprotein complex includes and extends beyond the Tn7 insertion site, where TnsC forms a platform to receive and activate the transposase to carry out recombination.
Keywords: DNA distortion/footprinting/protein–DNA/recombination/triplex
Introduction
The bacterial transposon Tn7 is unique in its ability to direct insertions at high frequency into a specific target site on the Escherichia coli chromosome termed attTn7 (Craig, 1991, 1996). This target site provides a ‘safe haven’ for Tn7 because the insertions do not disrupt host function (Craig, 1991, 1996). This target selectivity is in contrast to other mobile elements that exhibit much less target sequence specificity (Craig, 1997). We show here that attTn7, the target DNA itself, has an important role in recruiting the transposition machinery through a DNA-based signal, which aids in the organization of a nucleoprotein complex for recombination. This work is useful in further elucidating the mechanism of Tn7 insertion, the possible design of new targets for Tn7, and in providing insight into the role of target DNA in assembling nucleoprotein complexes, not only for transposition, but also in other cellular processes such as transcription, replication, repair and recombination.
Four proteins encoded by Tn7, TnsA, TnsB, TnsC and TnsD are required for Tn7 insertion into attTn7. This TnsABC+D system has been reconstituted in vitro (Bainton et al., 1993), allowing determination of the roles of the various recombination proteins in transposition. TnsD, a sequence-specific DNA binding protein, binds to attTn7 and recruits the other Tns proteins and the ends of the transposon to this insertion site (Bainton et al., 1993). TnsA and TnsB constitute the transposase and are responsible for the breakage and joining reactions (May and Craig, 1996; Sarnovsky et al., 1996). TnsC, an ATP-utlilizing regulatory protein, plays a pivotal role in transposition: TnsC interacts with the TnsD–attTn7 complex and mediates the activation of the transposase (Bainton et al., 1993; Stellwagen and Craig, 1997, 1998, 2001). Interestingly, no recombination intermediates or products are observed in the absence of attTn7 (Bainton et al., 1993), revealing that recognition of an appropriate target DNA is essential for the initiation of transposition activity in vitro.
Within attTn7, TnsD, the primary target site selection protein, binds to a site at a distance from the actual position of Tn7 insertion. The TnsD binding site is contained within a DNA segment encoding the C-terminal region of the glmS gene (Figure 1). The specific location of the Tn7 insertion, corresponding to the center of the resulting 5 bp duplication, is denoted nucleotide position ‘0’ on attTn7. Tn7 transposition is also orientation specific, with the right-hand end of Tn7 positioned proximal to the glmS gene as shown in Figure 1 (Bainton et al., 1993).

Fig. 1. Organization of attTn7: schematic showing attTn7, the region around the position of insertion of Tn7 resulting from the TnsABC+D pathway. attTn7 is located adjacent to the C-terminus of the glmS gene. Tn7 insertions at this site are both site- and orientation specific, with the right-hand end positioned towards glmS, as shown in the figure. The center of the resulting 5 bp duplication is denoted nucleotide position 0, and the TnsD binding site (+25 to +55) is indicated by the hatched rectangle. The flanking pstS gene, located 291 bp away from the site of insertion, is also marked in the schematic.
Previous studies of the TnsD–attTn7 complex have shown that TnsD contacts ∼30 bp of DNA from nucleotide position +25 to +55 (Bainton et al., 1993). TnsC, a non-sequence-specific DNA binding protein, shows very little binding to attTn7 on its own, but in the presence of TnsD, a specific TnsC–TnsD–attTn7 nucleoprotein complex is formed, as shown by electrophoretic mobility shift assay (EMSA) (Bainton et al., 1993). TnsD is, therefore, essential for the recognition and binding of attTn7 by TnsC. The transposase TnsAB is then recruited to attTn7 by interaction with TnsC, which activates the transposase to carry out recombination (Stellwagen and Craig, 1997, 1998, 2001).
How does TnsC recognize TnsD–attTn7? We have recently found that TnsC can specifically recognize a short region of triple helical DNA on a target plasmid, recruit the transposase and promote the insertion of Tn7 adjacent to the triplex (Rao et al., 2000). These findings revealed that TnsC can recognize a DNA-based target signal that localizes TnsC and also leads to TnsABC-dependent insertion (Rao et al., 2000).
The ability of triplex DNA to target Tn7 insertions raises the possibility that a DNA-based signal may be involved in the recognition of the TnsD–attTn7 complex by TnsC. We have used footprinting methods to characterize the TnsD–attTn7 and TnsC–TnsD–attTn7 target site nucleoprotein complexes. We show that TnsD binding to attTn7 causes an asymmetric distortion at the 5′ end of the binding site. This region of altered DNA structure, centered around +27, is strongly protected in the TnsC–TnsD–attTn7 complex, suggesting that the TnsABC+D pathway also utilizes a target DNA-based signal to recruit TnsC to attTn7, as reported for the TnsABC+triplex system (Rao et al., 2000). Moreover, we show that the TnsC–TnsD–attTn7 complex is organized so that the transposase TnsAB can readily access the insertion site and be activated by TnsC to carry out recombination.
Results
TnsD contacts a 30 bp region of attTn7
Previous footprints of the TnsD–attTn7 complex using DNase I had reported a core region of protection from about +25 to +55 (Bainton et al., 1993). These enzymatic footprinting methods used magnesium as cofactor and we have previously reported the instability of the TnsD–attTn7 complex in the presence of magnesium (Bainton et al., 1993). To circumvent this problem, and obtain data at single nucleotide resolution about the interaction of TnsD with attTn7, we performed hydroxyl radical footprinting (Dixon et al., 1991) of the protein–DNA complex. The line graph in Figure 2A shows the TnsD footprint for the top strand of attTn7 and data for both strands are summarized at the bottom of the figure. We observed strong protection in a core binding region from +30 to +55 on the top strand. This core footprint protects the two inverted repeat sequences 5′-CGTAACC-3′ (Figure 2A) that may serve as primary recognition sequences for TnsD. We also observed a weaker footprint at the 5′ end between +24 and +27 on the top strand. This interaction of TnsD with attTn7 at the 5′ end of the binding site was not seen in the earlier studies (Bainton et al., 1993). The 2 bp offset in the 3′ direction in the protection between the two strands (Figure 2A) for the footprint suggests a minor groove interaction of TnsD with DNA in this region. Interestingly, we also observed a very consistent, low level of hypercleavage in the region +8 to +21 adjacent to the 5′ end of the footprint (Figure 2A). Such hypercleavage points to a possible change in DNA structure adjacent to the TnsD binding site at the 5′ end.


Fig. 2. (A) Hydroxyl radical footprint of TnsD on attTn7. Line graphs representing hydroxyl radical cleavage of free target DNA (solid) and target DNA with TnsD (dotted) are overlaid to give the footprint of TnsD on the top strand of attTn7. The region of the footprint for both strands is indicated by the black rectangles and the region of hypercleavage is shown by the white rectangles. The width of the black rectangles is proportional to the degree of protection observed. The site of insertion, nucleotide position 0, is marked by a small arrow, and the inverted repeats within the TnsD binding sites are illustrated by inverted arrows, in bold, on attTn7. Also shown on the figure are λ-exonuclease pause sites observed at the 5′ end of the TnsD binding site. (B) Missing nucleoside analysis of TnsD binding to attTn7. Line graphs representing TnsD-bound (dotted) and total gapped DNA (solid) are overlaid in this analysis, for the top strand of attTn7. The regions of contacts are marked by black rectangles for both strands and the white rectangles mark gaps that enhance TnsD binding to attTn7. The rest is as in (A).
We have also used missing nucleoside interference assays (Hayes and Tullius, 1989) to evaluate the interaction of TnsD with attTn7. The line graph in Figure 2B shows the missing nucleoside analysis for the interaction of TnsD with the top strand of attTn7 and data for both strands are summarized at the bottom of the figure. We found that gaps induced in the core binding region from +30 to +55 led to a substantial loss of TnsD binding activity (black rectangles in Figure 2B). Interestingly however, the lack of particular nucleosides in the 5′ region of the binding site led to increased binding of TnsD to attTn7 (marked by white rectangles in Figure 2B). An attractive explanation for this increased binding is that TnsD imposes a distortion on DNA upon binding and that the absence of these nucleosides provides DNA flexibility that can facilitate TnsD binding. Enhanced DNA binding due to gaps induced by hydroxyl radical treatment has been reported for other proteins that are known to distort DNA upon binding (Kimball et al., 1995; Levin et al., 2000; Noel and Reznikoff, 2000).
We also used λ-exonuclease digestion to map the 5′ end of TnsD binding and found λ-exonuclease pause sites between +19 and +25 at the 5′ end of the binding site (Figure 2A), confirming the interaction of TnsD with sequences in this region.
TnsD induces a DNA distortion at the 5′ end of the binding site
We have probed the interaction of TnsD with attTn7 using protection from dimethyl sulfate (DMS) treatment. DMS methylates guanines in the major groove and adenines in the minor groove of DNA (Maxam and Gilbert, 1980). The line graph in Figure 3A shows the DMS footprint for TnsD on the top strand of attTn7 and data for both strands are summarized at the bottom of the figure. We observed protection primarily in the major groove from +33 to +55 on the top strand, which corresponds to the core footprint seen by hydroxyl radical cleavage and also the earlier reported DNase I footprint (Bainton et al., 1993). We saw very little protection of the adenines in the region +24 to +27 where the weaker minor groove footprint was seen by hydroxyl radical cleavage (Figure 2A).


Fig. 3. TnsD binding to attTn7 leads to an altered DNA structure at the 5′ end of the binding site. (A) DMS footprint of the TnsD–attTn7 complex. Line graphs representing DMS treatment followed by sodium hydroxide cleavage of free attTn7 (solid) and TnsD–attTn7 (dotted) are overlaid to give the footprint for the top strand of attTn7. The region of protection for both strands is indicated by the black rectangles. Nucleotide positions that show hypercleavage (+45 on the top strand and +27 on the bottom strand) are marked by the asterisk. The site of insertion, nucleotide position 0, is marked by an arrow. (B) Hypercleavage of TnsD-bound attTn7 by potassium permanganate and 5-phenyl-1,10-phenanthroline copper. The gel images represent cleavage of free attTn7 and TnsD–attTn7 by potassium permanganate (lanes 1 and 2; top strand of attTn7) and 5-phenyl-1,10-phenanthroline copper (lanes 3 and 4; bottom strand of attTn7). The nucleotide positions that show hypercleavage upon TnsD binding are indicated by an asterisk. Line graphs representing potassium permanganate and 5-phenyl-1,10-phenanthroline copper cleavage of free attTn7 (solid) and TnsD–attTn7 (dotted) are overlaid in the top and bottom panels, respectively. The hypercleavage data for both strands of attTn7 are summarized in (C). (C) Summary of footprinting and cleavage data. This schematic summarizes the cleavage data for various reagents used to probe the unusual DNA structure of the TnsD–attTn7 complex. The black arrows represent hypercleavage by potassium permanganate, the dotted arrows show cleavage by 5-phenyl-1,10-phenanthroline copper, the asterisk indicates hypercleavage by DMS, and the hatched rectangles mark pause sites observed for λ-exonuclease. The white rectangles denote nucleotide positions at which a gap leads to enhanced TnsD binding (see Figure 2B), and the hydroxyl radical footprint of TnsD is indicated by the black rectangles. The width of the black rectangles is proportional to the degree of protection observed. The inverted repeat sequences within the TnsD binding site are underlined, and the site of insertion is denoted nucleotide position 0.
We also observed hyperreactivity to DMS in the presence of TnsD at position +45 on the top strand and position +27 on the bottom strand (Figure 3A), which is indicative of a structural change in the DNA rendering these bases more susceptible to methylation by DMS.
To explore further the possibility of a DNA distortion on attTn7 caused by TnsD binding, we treated the protein–DNA complex with various chemical reagents used to detect altered DNA structure. Potassium permanganate treatment, followed by base treatment, oxidizes and cleaves primarily at thymines in double-stranded DNA. Hyperreactivity to this reagent is indicative of DNA distortion (Nielsen, 1990), and has been used to detect altered DNA structures around the DNA binding sites of several proteins (Nielsen, 1990; Fitzgerald and Anderson, 1999; Outten et al., 1999). For the TnsD–attTn7 complex, we observed hyperreactivity to permanganate at nucleotide positions +15 and +27, as seen in the gel image and line graph in Figure 3B and the summary in Figure 3C. These positions of increased attack are located at the 5′ end of the binding site and correspond well with the alteration to attTn7 by TnsD as visualized by missing nucleoside interference assays (Figure 3C), λ-exonuclease pause sites, all the way up to +12 at the 5′ end of the site (Figure 3C), and the DMS hypercleavage site observed at nucleotide position +27 on the bottom strand (Figure 3C). With these reagents, there were no observable changes at the 3′ end of the TnsD binding site.
We also probed for possible unwinding in TnsD–attTn7 by cleavage of the complex with 5-phenyl-1,10- phenanthroline and copper (Sigman et al., 1991). The positions of cleavage for this reagent are shown in the gel image and line graph in Figure 3B and mapped in the summary in Figure 3C. They include the two ends of the core binding site (+31, +32 and +54, +55) as well as the region of distortion located around +27 at the 5′ end of the TnsD footprint. Two positions of increased cleavage of the TnsD–attTn7 complex were also seen at +13 and +14. Thus, DNA unwinding by TnsD is a component of the distortion located at the 5′ end of the binding site. The cleavage data from all the chemical probes mentioned above for the TnsD–attTn7 complex are summarized in Figure 3C.
Does TnsD bend attTn7 upon binding and does this bend contribute to the TnsD-induced distortion? We conducted circular permutation assays on the TnsD–attTn7 complex and found that TnsD induces a modest bend of 35–40° located around the center of the TnsD binding site (data not shown), which could lead to the DMS hypercleavage observed at nucleotide position +45.
Taken together, these data establish that TnsD binding to attTn7 induces a distortion in the target DNA located at around +27 at the 5′ end of the TnsD binding site, proximal to the Tn7 insertion site. Moreover, this altered DNA structure extends to the flanking DNA (in the 5′ direction), making it susceptible to cleavage by various footprinting reagents.
The TnsC–TnsD–attTn7 complex includes the position of Tn7 insertion and the region of distortion induced by TnsD
TnsD induces a distortion around the 5′ end of the binding site. This is the region of attTn7 where TnsC likely binds, based on previous analysis using DNase I footprinting (Bainton et al., 1993). The line graph in Figure 4A shows the hydroxyl radical footprint of TnsC–TnsD for the top strand of attTn7 and data for both strands are summarized at the bottom of the figure. The hydroxyl radical footprint of the TnsC–TnsD–attTn7 complex indicates that this complex extends from nucleotide position +55, the distal 3′ edge of TnsD–attTn7 to a position ∼10 bp beyond the point of insertion (Figure 4A). The extent of the TnsC–TnsD–attTn7 footprint compared with the TnsD–attTn7 footprint suggests that TnsC is present at the insertion site in this nucleoprotein complex, a view consistent with the idea that TnsC activates the transposase at the point of insertion. Previous DNase I studies had shown some extension of the TnsD–attTn7 footprint upon the addition of TnsC; however, the protection did not extend all the way up to the insertion site as seen in Figure 4A, probably because DNA binding by TnsC is sensitive to the presence of magnesium used in the DNase I footprinting assay (Bainton et al., 1993).


Fig. 4. (A) Hydroxyl radical footprint of the TnsC–TnsD–attTn7 complex. Line graphs representing hydroxyl radical cleavage of free target DNA (solid), and target DNA with TnsD and TnsC (dotted), are overlaid to give the footprint for the top strand of attTn7. The region of the TnsC–TnsD footprint for both strands is indicated by the black rectangles. The insertion site is indicated by nucleotide position 0. Also marked by the hatched rectangles are the hydroxyl radical footprint of TnsD alone on attTn7 (from Figure 2A). (B) Missing nucleoside analysis of the TnsC–TnsD–attTn7 complex. Line graphs representing TnsC–TnsD-bound (dotted) and total gapped DNA (solid) are overlaid in this analysis, for the bottom strand of attTn7. The regions of contacts are marked by black rectangles for both strands and the white rectangles mark gaps that enhance TnsC–TnsD binding to attTn7. The hatched rectangle at the bottom indicates the important contacts seen with TnsD alone from Figure 2B.
The region of DNA distortion imposed by TnsD (approximately +15 to +28) is strongly protected in the TnsC–TnsD–attTn7 complex; we also observe hypercleavage at +27. A simple interpretation of these results is that TnsC recognizes the distorted DNA in the 5′ region of the TnsD binding site and binds adjacent to TnsD.
The line graph in Figure 4B shows the missing nucleoside analysis (Hayes and Tullius, 1989) for the interaction of TnsC–TnsD with the top strand of attTn7, and data for both strands are summarized at the bottom of the figure. For TnsD alone, gaps in the core binding site of +30 to +55 led to loss of TnsD binding whereas gaps at the 5′ end of the binding site from +18 to +24 actually enhanced TnsD binding. With the addition of TnsC, we found that gaps in the region +19 to +30 as well as gaps in the region +30 to +55 (black rectangles in Figure 4B) disrupted formation of the TnsC–TnsD–attTn7 complex. This further supports the idea that a TnsD-induced structure at the 5′ end of the TnsD binding (+19 to +28) site is important for TnsC binding.
Interestingly, we also observed that gaps around the insertion site from –4 to +7 (open rectangles in Figure 4B) actually enhanced formation of the TnsC–TnsD–attTn7 complex. These data suggest that TnsC alters DNA structure around the insertion site where the transposase is expected to bind and carry out recombination.
TnsC binds attTn7 primarily in the minor groove of target DNA
As discussed earlier, DMS footprinting allows the determination of groove specificity of DNA binding proteins (Maxam and Gilbert, 1980). The line graph in Figure 5 shows the DMS footprint for TnsC–TnsD on the top strand of attTn7 and data for both strands are summarized at the bottom of the figure. The DMS footprint of the TnsC–TnsD–attTn7 complex reveals several interesting features. In the TnsC–TnsD–attTn7 complex, the core region protected by TnsD (+33 to +55 in Figure 3A) still shows strong protection at the guanine bases corresponding to major groove binding. However, in the presence of TnsC+TnsD, the adenines at the 5′ end of the TnsD binding site from +20 to +30 now report reduced cleavage, indicative of minor groove interaction. Moreover, the footprint encompasses the insertion site and extends up to about –20. Interestingly, in this region (–20 to +30) protected by TnsC, only the adenines show protection, indicating that TnsC binds primarily in the minor groove of DNA.

Fig. 5. DMS footprint of the TnsC–TnsD–attTn7 complex. Line graphs representing DMS treatment followed by sodium hydroxide cleavage of free target DNA (solid) and target DNA with TnsD and TnsC (dotted) are overlaid to give the footprint for the top strand of attTn7. The asterisks indicate nucleotide positions hypersensitive to DMS. The region of the footprint for both strands is indicated by the black rectangles. The site of insertion, nucleotide position 0, is marked by an arrow. Nucleotide positions bearing adenine and guanine bases are marked by A and G, respectively. The hatched rectangle at the bottom represents the TnsD alone DMS footprint from Figure 3A.
The hypercleavages seen at +45 (top strand) and +27 (bottom strand) in the TnsD-alone footprint (Figure 3A) persist and are stronger in the TnsC–TnsD case, possibly due to increased stability of the complex. The overlap between TnsD and TnsC, although difficult to determine, probably occurs in the region +20 to +30 of attTn7.
Taken together, these results show that TnsC is a minor groove binding protein. TnsC occupies the minor groove at the insertion site, thus leaving the major groove open for potential binding of the transposase TnsAB.
Sequence requirements of attTn7 for the effective binding of target site recognition proteins and transposition in vitro
What sequences in attTn7 are required to promote high-frequency site-specific insertion into attTn7? How are these sequences related to those necessary for TnsD binding? Previous studies have shown that the sequence in the region +23 to +58 of attTn7 is sufficient for Tn7 insertion (Bainton et al., 1993), but the sequence +28 to +55 of attTn7 is defective in promoting transposition in vivo (Waddell and Craig, 1989; Bainton et al., 1993). If the TnsD-induced distortion, centered around nucleotide position +27 at the 5′ end of the binding site, is important for transposition, that would explain the reduced activity of the +28 to +55 sequence.
We have systematically studied protein binding and transposition for the various derivatives of attTn7 listed in Figure 6A (also see Materials and methods) in order to determine the sequences at the 5′ end of the TnsD binding site that are important for recombination. The rationale for designing these sequences is as follows: the –52 to +64 sequence of attTn7 has been shown before to yield wild-type transposition activity both in vitro and in vivo (Bainton et al., 1993); the +18 to +64 segment we have used includes a potentially important A/T-rich region, which includes a DNA bend (Hagerman, 1990), flanking the 5′ end of the TnsD binding site; the +25 to +64 fragment, which lacks this A/T-rich region tests the importance of this structural motif to transposition; and finally, the +28 to +64 sequence eliminates the sequence where the main TnsD-induced distortion is observed (Figure 6A).
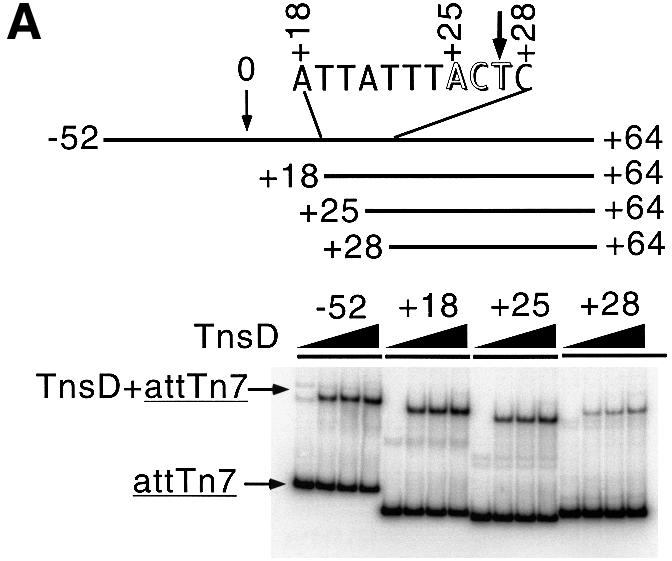
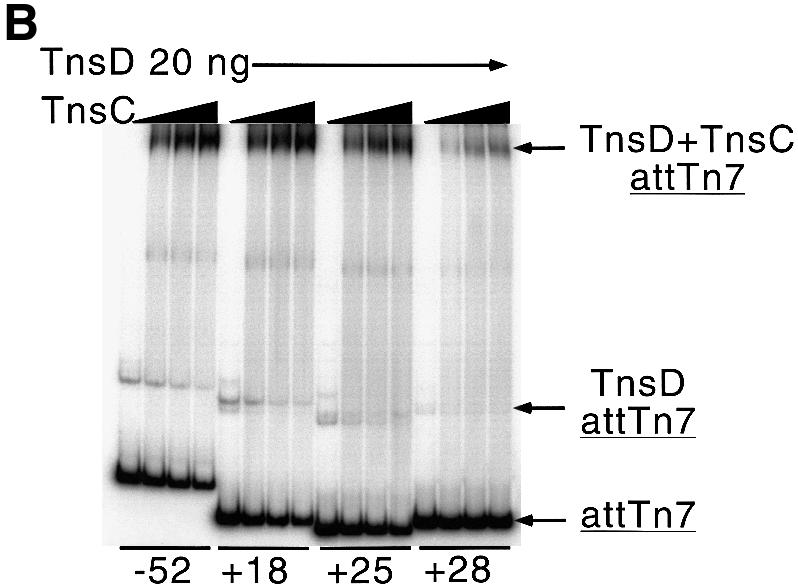

Fig. 6. Protein binding and transposition activity of various attTn7 fragments. (A) The +28 to +64 sequence of attTn7 is defective in TnsD binding. The EMSA shows the ability of the various attTn7 fragments to bind TnsD. The schematic at the top of the figure shows the various attTn7 fragments used in this study. The site of insertion is marked by the position 0 and the attTn7 sequence from +18 to +28 is indicated. The arrowhead marks position +27 where we observe a distortion in DNA induced by TnsD binding (see Figure 3B). For each fragment, the amount of TnsD added ranged from 10 to 40 ng in increments of 10 ng. (B) The truncated +28 to +64 sequence of attTn7 leads to decreased TnsC–TnsD–attTn7 complex formation. Binding of TnsD+TnsC to the various attTn7 sequences is shown in this figure. In this case 20 ng of TnsD were added to each binding reaction and the amount of TnsC varied: 0, 10, 15 and 20 ng. (C) The +28 to +64 sequence of attTn7 shows reduced transposition in vitro. The simple insert represents Tn7 insertions into attTn7. Percentage simple insert was plotted for each of the target plasmids bearing the –52 to +64, +18 to +64, +25 to +64 and +28 to +64 sequences of attTn7.
The +18 to +64 sequence essentially behaves like the wild-type –52 to +64 sequence. The +25 to +64 sequence, which excludes the A/T-rich region adjacent to the TnsD binding site but which includes the DMS- and potassium permanganate-enhanced positions, showed only a small defect (∼2-fold) in the binding of the target proteins TnsD and TnsC, and also in transposition in vitro (Figure 6). The +28 to +64 sequence, which lacks the sequence where the TnsD-induced distortion is located, was ∼12-fold defective for TnsD binding (Figure 6A). As expected, this sequence also showed decreased levels of TnsC–TnsD–attTn7 complex formation (Figure 6B) and was defective for transposition in vitro (Figure 6C). These experiments clearly establish the importance of the sequence of attTn7 in the region of the TnsD-induced distortion (+25 to +28), for the binding of TnsD and TnsC+TnsD to attTn7, as well as for transposition. Moreover, the flanking A/T-rich region (+18 to +25) also showed a modest but consistent contribution to target site recognition and recombination, which further emphasizes the importance of target DNA structure in Tn7 transposition.
Discussion
Working model for the TnsABC+D pathway
Tn7 insertions into attTn7 occur at a high frequency in a site- and orientation-specific manner. How is target recognition achieved? We have shown here that TnsD binds to a region of DNA encoding the C-terminus of the glmS gene, contacting a core region from +30 to +55, primarily in the major groove of DNA. Additionally, TnsD also recognizes the region +24 to +30 at the 5′ end of the core binding site. This interaction leads to a distortion of attTn7 around +27 and the altered DNA structure then extends in the 5′ direction towards the insertion site. Our experiments suggest that TnsC binds to this region of TnsD-induced distortion and extends the footprint such that the actual point of insertion is occupied, very likely by TnsC. As discussed below, we believe that the TnsD-imposed altered DNA structure plays an important role in TnsC binding to attTn7. The TnsC–TnsD–attTn7 complex may also be further stabilized by protein–protein interaction (R.Mitra and N.L.Craig, unpublished observation).
We have also found that TnsC binds to the minor groove of DNA around the point of Tn7 insertion, leaving the major groove of DNA at the insertion site open for transposase (TnsAB) binding (Figure 7A). The 5 bp duplication produced as a result of transposition (Craig, 1996) implies that the two strands of attTn7 DNA have to be attacked by the 3′-OH ends of the transposon around the insertion site, as shown in the box in Figure 7A. The two DNA strand joining events are offset by 5 bp in the 5′ direction (Figure 7A), which is indicative of a process occurring across the major groove of DNA. This observation supports a model where the transposase TnsAB binds in the major groove, and is activated by a TnsC platform located in the minor groove, to carry out the breakage and joining activities leading to a site-specific, orientation-specific insertion in attTn7.


Fig. 7. (A) Working model for the TnsABC+D pathway. attTn7 is indicated by the rectangle, the relative positions of TnsD, TnsC and the transposase TnsAB are marked by ovals, and the donor DNA is also shown at the insertion site, which is denoted 0. The top portion of the rectangle indicates the major groove side of attTn7 and the bottom side represents the minor groove face of attTn7. Also illustrated in the box is the 5 bp duplication (underlined) that occurs on Tn7 insertion and the arrows show the positions of joining of the transposon ends, executed by the transposase (TnsAB) on attTn7. (B) Comparison of the TnsABC+D and TnsABC+triplex pathways. In both cases the site-specific and orientation-specific insertions are shown at nucleotide position 0 and the region of altered DNA structure is indicated by the hatched rectangles. The relative positions of the triplex, TnsD and TnsC are marked in the schematic.
A short stretch of triplex DNA can mimic the TnsD–attTn7 signal
We are attracted to the view that the DNA distortion induced in attTn7 by TnsD plays a key role in the specific recognition of the attTn7 site by TnsC. We have found previously that an entirely DNA signal, a short region of triplex DNA, can promote the specific insertion of Tn7 into a region adjacent to the triplex (Rao et al., 2000, 2001). The two pathways, TnsABC+D and TnsABC+ triplex (Rao et al., 2000), are compared in Figure 7B. In addition to being site specific, these pathways share other similarities: the insertions in both cases are orientation specific with the right-hand end of Tn7 positioned proximal to either TnsD or the triplex, and the insertion site in each case is asymmetric and lies 27–28 bp away from the target signal. These similarities imply that recruitment and positioning of TnsC are very similar in both pathways. Since the TnsD–attTn7 complex can be efficiently replaced by triplex DNA, in which case there is no protein component, it can be safely concluded that a target DNA-based signal is sufficient to recruit TnsC and the transposase to the insertion site.
We have shown that TnsD bound to attTn7 induces a DNA distortion around nucleotide position +27 at the 5′ end of the TnsD binding site. Triplex formation is also known to induce conformational changes in and around its duplex target (Chomilier et al., 1992; Stonehouse and Fox, 1994; Ascensio et al., 1998; Rhee et al., 1999). Character ization of the triplex targets used in our in vitro transposition reaction reveals that structural changes occur primarily at the triplex–duplex junction (Rao et al., 2000). Interestingly, for both TnsD–attTn7 and triplex DNA targets, Tn7 preferentially inserts at a distance of ∼28 bp from the location of their respective altered DNA structure. Thus, triplex-induced DNA structure probably mimics the TnsD-induced structure on attTn7 (Rao et al., 2000, 2001), and this DNA distortion serves as an important signal for the recruitment of TnsC to the target site. In the case of the TnsC–TnsD–attTn7 complex, protein–protein interaction between TnsC and TnsD may futher stabilize the nucleoprotein complex (R.Mitra and N.L.Craig, unpublished observation).
A potential target DNA-based signal in Tn7 transposition
In this report, we have presented several lines of evidence to support our hypothesis that a target DNA-based signal plays an important role in TnsC recruitment and Tn7 transposition. We have used a broad range of footprinting reagents to establish that TnsD binding to attTn7 induces a structural pertubation at the 5′ end of the binding site and this region of distortion is strongly protected by TnsC in the TnsC–TnsD–attTn7 complex. We have also shown that sequence changes around the site of the TnsD-induced DNA distortion lead to reduced binding of TnsD and TnsC, as well as reduced transposition. Most importantly, the TnsD–attTn7 signal can be effectively replaced by a short stretch of triplex DNA, which is known to contain structural pertubation of DNA, to achieve TnsC binding and site-specific transposition (Rao et al., 2000). Hence, we believe that the TnsD-induced distortion of attTn7 constitutes an important signal in recruiting TnsC and the transposase TnsAB to attTn7, leading to site-specific recombination.
What is the precise nature of the TnsD-induced structural pertubation of attTn7 and how is this structure recognized by TnsC? The DNA structural parameters that constitute the TnsD-induced architecture on attTn7 obviously cannot be defined by the footprinting data. Thus, a detailed analysis of the TnsD-induced structure of attTn7, and the recognition of this DNA structure by TnsC will only be possible after high resolution structural information of these protein–DNA complexes are obtained by either X-ray crystallography or NMR techniques. We have yet to identify the DNA binding domains of the two proteins TnsD and TnsC, and sequence homology searches have not yielded any closely related proteins.
The use of target DNA structure to recruit the transposase is not new to transposition. The transposases of mobile elements IS903 (Hu and Derbyshire, 1998), IS231A (Hallet et al., 1994) and Tn10/IS10 (Halling and Kleckner, 1982) have been reported to preferentially bind DNA sequences that yield altered target DNA structure, such as DNA bending and anisotropic flexibility. HIV integrase is known to recognize both sequence-directed structures, such as intrinsic curvature in DNA, as well as protein-induced structures, like distortions in nucleosomal DNA (Pryciak and Varmus, 1992). Thus, recognition of a target DNA-based signal, both sequence directed and protein induced, by the transposase is an important theme in transposition. Interestingly, target DNA recognition by Tn7 is mediated by two self-encoded target site selection proteins: TnsD for sequence-specific binding and distortion of attTn7, and TnsC for the recognition of target DNA signals imposed by TnsD. The binding of TnsC adjacent to TnsD on attTn7 ensures that sequence-specific recognition of the target site by TnsD occurs at a distance from the Tn7 insertion site, where TnsC forms a platform for the binding and subsequent activation of the transposase TnsAB, leading to site-specific recombination. Thus, the use of two different target site selection proteins, TnsD and TnsC, allows Tn7 to separate spatially the targeting functions from the recombination chemistry on attTn7.
Target DNA regulates the initiation of Tn7 transposition
A distinguishing feature of Tn7 transposition is the stringent control exercised over the activity of the Tn7 transposase (Stellwagen and Craig, 1997). In the absence of an appropriate target site, Tn7 is not excised from donor DNA in in vitro transposition reactions (Bainton et al., 1993). Activation of the Tn7 transposase is strongly coupled to the binding of attTn7 by TnsC and TnsD. We propose here that Tn7 imposes an additional level of control on transposase activity through the use of a target DNA-based signal. The requirement of a TnsD-induced structure of attTn7 for TnsC binding ensures that attTn7 is indeed present before TnsC can activate the transposase and any transposition chemistry occurs. Thus, target DNA directly regulates TnsC binding and therefore, the initiation of Tn7 transposition.
The role of attTn7, the target site, was originally thought to be limited to specifying sequence for TnsD binding and then serving as a scaffold on which the nucleoprotein complex is assembled, the proteins being the actual effectors of transposition. Our work adds another component to this elaborate process: target DNA structure plays a direct role in the assembly and organization of nucleoprotein complexes, and thereby regulates the very initiation of site-specific transposition.
Materials and methods
Plasmids and radiolabeling
A 180 bp EcoRI–HindIII restriction fragment, containing the attTn7 sequence from –52 to +64, was excised from pKK25 and inserted into pUC19 to give plasmid pPK13. For all the footprinting experiments, a 205 bp XbaI–HindIII fragment was either 3′ end labeled to label the top strand or 5′ end labeled to label the bottom strand at the XbaI site. End labeling was achieved by standard methods (Sambrook et al., 1989).
The plasmids pPK240, pPK250 and pPK260 were generated by annealing oligonucleotides containing the +18 to +64, +25 to +64 and +28 to +64 sequences, respectively, from attTn7 flanked by PstI and BamHI restriction ends, followed by ligation into the respective sites in the vector pLITMUS28 (New England Biolabs). In constructing pPK250, the +18 to +24 sequence of attTn7, 5′-ATTTATT-3′, was replaced by the sequence 5′-TCCGCGG-3′. In the case of pPK260, the +18 to +27 sequence of attTn7, 5′-ATTTATTACT-3′, was replaced by the sequence 5′-TCC GCGGCGG-3′.
For the bandshift assays shown in Figure 6, the 205 bp XbaI–HindIII fragment of pPK13, the 167 bp SpeI–XbaI fragment from pPK240 and pPK250 and the 163 bp SpeI–AflII fragment from pPK260 were all 5′ end labeled at both ends.
After radiolabeling, the DNA was run on polyacrylamide gels, bands were excised and subjected to standard crush and soak protocols to extract the labeled DNA (Sambrook et al., 1989).
Proteins
Purification of TnsC and His-tagged TnsD has been described earlier (Gamas and Craig, 1992; Sharpe and Craig, 1998).
Binding reactions
About 0.01 pmol of end-labeled DNA and 1 µg of sheared salmon sperm DNA as competitor were incubated with 60 ng of TnsD in a 20 µl reaction at 30°C for 20 min in a buffer that contained 25 mM HEPES pH 7.5, 10 mM Tris–HCl pH 7.5, 4.3 mM dithiothreitol (DTT), 2 mM ATP, 0.15 mM EDTA, 75 mM KCl, 0.025% bovine serum albumin (BSA) and 5% glycerol. For TnsC–TnsD binding, 60 ng of TnsD and 50 ng of TnsC were used in a 20 µl reaction at 30°C for 20 min, and the buffer contained 26.2 mM HEPES pH 7.5, 10 mM Tris–HCl pH 7.5, 4.4 mM DTT, 2.1 mM ATP, 0.16 mM EDTA, 75 mM KCl, 25 mM NaCl, 0.5 mM MgCl2, 0.5 mM CHAPS, 0.025% BSA and 5% glycerol.
Hydroxyl radical footprinting and missing nucleoside analysis
Hydroxyl radical cleavage reactions were performed after the binding reactions by the method of Dixon et al. (1991) except that the final concentrations of the reagents were as follows: 2 mM/4 mM Fe/EDTA, 3 mM sodium ascorbate and 0.03% hydrogen peroxide. The reactions were either stopped by ethanol precipitation and lyophilization or loaded onto a nucleoprotein gel.
The missing nucleoside experiment was carried out by the method of Hayes and Tullius (1989) and the final concentrations of reagents used were 0.3 mM/0.6 mM Fe/EDTA, 3 mM sodium ascorbate and 0.03% hydrogen peroxide.
Other footprinting reactions
Potassium permanganate cleavage (Nielsen, 1990) was carried out by the addition of 50 mM (final concentration) potassium permanganate to the binding reaction, which did not contain any DTT. The reaction was left at 30°C for 20 min and stopped with a mixture of final concentrations of 15 mM β-mercaptoethanol and 30 mM EDTA, followed by the precipitation of DNA. This DNA was treated with 1 M piperidine at 90°C for 20 min and precipitated once more.
DMS reactions
One microliter of a 1:20 dilution of DMS in DMSO was used for each reaction. After 15 s, the DNA was either precipitated or loaded onto a nucleoprotein gel. The DNA thus isolated was either treated with 1 M piperidine at 90°C for 20 min for the G-specific reaction or with 0.1 M NaOH at 90°C for 20 min for the G+A-specific reaction (Maxam and Gilbert, 1980). The DNA was once again precipitated and lyophilized.
5-phenyl-1,10-phenanthroline copper cleavage
Two microliters of a freshly made mixture of 5-phenyl-1,10- phenanthroline and copper (II) sulfate were added to the binding reaction, resulting in final concentrations of 100 µM 5-phenyl-1,10-phenanthroline and 24 µM copper ion (Kimball et al., 1995). The mixture was incubated at 30°C for 20 min and the DNA was then precipitated and lyophilized.
λ-exonuclease cleavage
Two microliters of a solution containing 2 U of λ-exonuclease and 10 mM Mg2+ were added to the binding reaction and incubated at 37°C for 20 min. The DNA was then precipitated and lyophilized.
Nucleoprotein gels
To separate the TnsD–attTn7 complex, samples were loaded onto a native 5% polyacrylamide gel (37.5:1 acrylamide:bis) and run at 10 V/cm at room temperature for 3 h. The TnsC–TnsD–attTn7 binding reactions were run on a native 5% polyacrylamide gel (29:1 acrylamide:bis) and run at 10 V/cm at 4°C for 5 h. In the case of band-shifted footprinting, these gels were subject to autoradiography and the bands corresponding to bound and unbound DNA were excised from the gel, and the DNA was then extracted by standard crush and soak procedures. All other gels were dried, scanned on a PhosphorImager (Storm/Molecular Dynamics) and analyzed using ImageQuant software (Molecular Dynamics).
In vitro transposition reactions
Each reaction had 0.37 pmol of target plasmid DNA, 0.04 pmol of mTn7-containing donor plasmid DNA, 1.2 pmol of TnsA, 0.3 pmol of TnsB, 0.5 pmol of TnsC, 0.08, 0.16 or 0.32 pmol of TnsD in a buffer containing 25.9 mM HEPES pH 7.6, 4.2 mM Tris–HCl pH 7.6, 60 µg/ml BSA, 2.0 mM ATP, 2.1 mM DTT, 21.5 mM KCl, 14.3 mM NaCl, 19 µM EDTA, 120 µM MgCl2, 120 µM CHAPS, 4 µM phenylmethylsulfonyl fluoride (PMSF), 1.2% glycerol and 15 mM Mg(OAc)2 in a final volume of 100 µl. The target plasmid DNA (pPK13, pPK240, pPK250 and pPK260 were tested), TnsD and TnsC were first mixed and assembled at 30°C for 20 min, and then the remaining components were added and incubated at 30°C for another 30 min. The reaction was stopped with phenol/chloroform extraction and the DNA precipitated, digested with ScaI and separated on a 0.6% agarose gel. The gel was subjected to Southern blotting and probed with radiolabeled oligonucleotide (NLC94), corresponding to the right-hand end of Tn7. Following phosphoimaging, the Simple Insertion products were quantified (as a percentage of total radioactivity per lane), using ImageQuant software.
Denaturing polyacrylamide gels and data analysis
After the various reactions, formamide loading dyes were added to the lyophilized DNA, the counts of radioactivity for the various reactions were made equal and then separated on 8% denaturing polyacrylamide gels. The gels were dried, scanned on a PhosphorImager and analyzed using ImageQuant software. For footprinting reactions, line graphs were generated for the various lanes on the denaturing polyacrylamide gel. A line graph represents a one-dimensional scan of each lane on a denaturing polyacrylamide gel, with the pixel intensity of each band plotted on the y-axis. These data were transferred to Microsoft Excel for further manipulation. Regions outside the binding site (on both sides) were used to normalize the cleavage intensities between various lanes of the gel. These normalized data of DNA cleavage intensities, either in the absence or presence of protein, were plotted to yield the various footprints.
Acknowledgments
Acknowledgements
We would like to thank Drs Paul S.Miller and Thomas D.Tullius for important suggestions and interesting discussion, Patti Eckhoff for the preparation of the manuscript and members of the Craig Laboratory for critical reading of the paper. This work was supported by the National Institues of Health under grant GM53824 to N.L.C., who is also an investigator with the Howard Hughes Medical Institute.
REFERENCES
- Ascensio J.L., Dosanjh,H.S., Jenkins,T.C. and Lane,A.N. (1998) Thermodynamic, kinetic and conformational properties of a parallel intermolecular DNA triplex containing 5′ and 3′ junctions. Biochemistry, 37, 15188–15198. [DOI] [PubMed] [Google Scholar]
- Bainton R.J., Kubo,K.M., Feng,J.-N. and Craig,N.L. (1993) Tn7 transposition: target DNA recognition is mediated by multiple Tn7-encoded proteins in a purified in vitro system. Cell, 72, 931–943. [DOI] [PubMed] [Google Scholar]
- Chomilier J., Sun,J.-S., Collier,D.A., Garestier,T., Helene,C. and Lavery,R. (1992) A computational and experimental study of the bending induced at a double–triple helix junction. Biophys. Chem., 45, 143–152. [DOI] [PubMed] [Google Scholar]
- Craig N.L. (1991) Tn7: a target site-specific transposon. Mol. Microbiol., 5, 2569–2573. [DOI] [PubMed] [Google Scholar]
- Craig N.L. (1996) Transposon Tn7. Curr. Top. Microbiol. Immunol., 204, 27–48. [DOI] [PubMed] [Google Scholar]
- Craig N.L. (1997) Target site selection in transposition. Annu. Rev. Biochem., 66, 437–474. [DOI] [PubMed] [Google Scholar]
- Dixon W.J., Hayes,J.J., Levin,J.R., Weidner,M.F., Dombroski,B.A. and Tullius,T.D. (1991) Hydroxyl radical footprinting. Methods Enzymol., 208, 380–413. [DOI] [PubMed] [Google Scholar]
- Fitzgerald D.J. and Anderson,J.N. (1999) DNA distortion as a factor in nucleosome positioning. J. Mol. Biol., 293, 477–491. [DOI] [PubMed] [Google Scholar]
- Gamas P. and Craig,N.L. (1992) Purification and characterization of TnsC, a Tn7 transposition protein that binds ATP and DNA. Nucleic Acids Res., 20, 2525–2532. [DOI] [PMC free article] [PubMed] [Google Scholar]
- Hagerman P.J. (1990) Sequence-directed curvature of DNA. Annu. Rev. Biochem., 59, 755–781. [DOI] [PubMed] [Google Scholar]
- Hallet B., Rezsöhazy,R., Mahillon,J. and Delcour,J. (1994) IS213A insertion specificity: consensus sequence and DNA bending at the target site. Mol. Microbiol., 14, 131–139. [DOI] [PubMed] [Google Scholar]
- Halling S.M. and Kleckner,N. (1982) A symmetrical six-basepair target site sequence determines Tn10 insertion specificity. Cell, 28, 155–163. [DOI] [PubMed] [Google Scholar]
- Hayes J.J. and Tullius,T.D. (1989) The missing nucleoside experiment: a new technique to study recognition of DNA by protein. Biochemistry, 28, 9521–9527. [DOI] [PubMed] [Google Scholar]
- Hu W.Y. and Derbyshire,K.M. (1998) Target choice and orientation preference of the insertion sequence IS903. J. Bacteriol., 180, 3039–3048. [DOI] [PMC free article] [PubMed] [Google Scholar]
- Kimball A.S., Kimball,M.L., Jayaram,M. and Tullius,T.D. (1995) Chemical probe and missing nucleoside analysis of Flp recombinase bound to the recombination target sequence. Nucleic Acids Res., 23, 3009–3017. [DOI] [PMC free article] [PubMed] [Google Scholar]
- Levin J.R., Blake,J.J., Ganunis,R.A. and Tullius,T.D. (2000) The roles of specific template nucleosides in the formation of stable transcription complexes by Escherichia coli RNA polymerase. J. Biol. Chem., 275, 6885–6893. [DOI] [PubMed] [Google Scholar]
- Maxam A.M. and Gilbert,W. (1980) Sequencing end-labeled DNA with base-specific chemical cleavages. Methods Enzymol., 65, 499–560. [DOI] [PubMed] [Google Scholar]
- May E.W. and Craig,N.L. (1996) Switching from cut-and-paste to replicative Tn7 transposition. Science, 272, 401–404. [DOI] [PubMed] [Google Scholar]
- Nielsen P.E. (1990) Chemical and photochemical probing of DNA complexes. J. Mol. Recognit., 3, 1–25. [DOI] [PubMed] [Google Scholar]
- Noel R.J. and Reznikoff,W.S. (2000) Structural studies of lacUV5–RNA polymerase interactions in vitro. J. Biol. Chem., 275, 7708–7712. [DOI] [PubMed] [Google Scholar]
- Outten C.E., Outten,F.W. and O’Halloran,T.V. (1999) DNA distortion mechanism for transcriptional activation by ZntR, a Zn(II)-responsive MerR homologue in Escherichia coli. J. Biol. Chem., 274, 37517–37524. [DOI] [PubMed] [Google Scholar]
- Pryciak P.M. and Varmus,H.E. (1992) Nucleosomes, DNA binding proteins and DNA sequence modulate retroviral integration target site selection. Cell, 69, 769–780. [DOI] [PubMed] [Google Scholar]
- Rao J.E. and Craig,N.L. (2001) Selective recognition of pyrimidine motif triplexes by a protein encoded by the bacterial transposon Tn7. J. Mol. Biol., in press. [DOI] [PubMed] [Google Scholar]
- Rao J.E., Miller,P.S. and Craig,N.L. (2000) Recognition of triple-helical DNA structures by transposon Tn7. Proc. Natl Acad. Sci. USA, 97, 3936–3941. [DOI] [PMC free article] [PubMed] [Google Scholar]
- Rhee S., Han,Z., Liu,K., Miles,H.T. and Davies,D.R. (1999) Structure of a triple helical DNA with a triple–duplex junction. Biochemistry, 38, 16810–16815. [DOI] [PubMed] [Google Scholar]
- Sambrook J., Fritsch,E.F. and Maniatis,T. (1989) Molecular Cloning: A Laboratory Manual, 2nd edn. Cold Spring Harbor Laboratory Press, Cold Spring Harbor, NY.
- Sarnovsky R., May,E.W. and Craig,N.L. (1996) The Tn7 transposase is a heteromeric complex in which DNA breakage and joining activities are distributed between different gene products. EMBO J., 15, 6348–6361. [PMC free article] [PubMed] [Google Scholar]
- Sharpe P. and Craig,N.L. (1998) Host proteins can stimulate Tn7 transposition: a novel role for the ribosomal protein L29 and the acyl carrier protein. EMBO J., 17, 5822–5831. [DOI] [PMC free article] [PubMed] [Google Scholar]
- Sigman D.S., Kuwabara,M.D., Chen,C.H. and Bruice,T.W. (1991) Nuclease activity of 1,10-phenanthroline–copper in study of protein–DNA interactions. Methods Enzymol., 208, 414–433. [DOI] [PubMed] [Google Scholar]
- Stellwagen A. and Craig,N.L. (1997) Gain-of-function mutations in TnsC, an ATP-dependent transposition protein which activates the bacterial transposon Tn7. Genetics, 145, 573–585. [DOI] [PMC free article] [PubMed] [Google Scholar]
- Stellwagen A. and Craig,N.L. (1998) Mobile DNA elements: controlling transposition with ATP-dependent molecular switches. Trends Biochem. Sci., 23, 486–490. [DOI] [PubMed] [Google Scholar]
- Stellwagen A. and Craig,N.L. (2001) Analysis of gain of function mutants of an ATP-dependent regulator of Tn7 transposition. J. Mol. Biol., in press. [DOI] [PubMed] [Google Scholar]
- Stonehouse T.J. and Fox,K.R. (1994) DNase I footprinting of a triple helix formation at polypurine tracts by acridine-linked oligopyrimidines: stringency, structural changes and interaction with minor groove binding ligands. Biochim. Biophys. Acta, 1218, 322–330. [DOI] [PubMed] [Google Scholar]
- Waddell C.S. and Craig,N.L. (1989) Tn7 transposition: recognition of the attTn7 target sequence. Proc. Natl Acad. Sci. USA, 86, 3958–3962. [DOI] [PMC free article] [PubMed] [Google Scholar]