

Abstract
Improper attachment of the mitotic spindle to the kinetochores of paired sister chromatids in mitosis is monitored by a checkpoint that leads to an arrest in early metaphase. This arrest requires the inhibitory association of Mad2 with the anaphase promoting complex/cyclosome (APC/C). It is not known how the association of Mad2 with the kinetochore and the APC/C is regulated in mitosis. Here, we demonstrate that human Mad2 is modified through phosphorylation on multiple serine residues in vivo in a cell cycle dependent manner and that only unphosphorylated Mad2 interacts with Mad1 or the APC/C in vivo. A Mad2 mutant containing serine to aspartic acid mutations mimicking the C-terminal phosphorylation events fails to interact with Mad1 or the APC/C and acts as a dominant-negative antagonist of wild-type Mad2. These data suggest that the phosphorylation state of Mad2 regulates its checkpoint activity by modulating its association with Mad1 and the APC/C.
Keywords: anaphase promoting complex-cyclosome/Mad2/metaphase arrest/mitotic checkpoint/phosphorylation
Introduction
The mitotic spindle checkpoint monitors proper attachment of the bipolar spindle to the kinetochores of aligned sister chromatids and causes a cell cycle arrest in prometaphase when failures occur. Cells arrest with condensed chromosomes, high mitotic kinase activity and high levels of the anaphase inhibitor called Pds1 in Saccharomyces cerevisiae, and Securin in mammalian cells (for reviews, see Burke, 2000; Wassmann and Benezra, 2001). Ubiquitylation by the anaphase promoting complex/cyclosome (APC/C) and subsequent degradation of the anaphase inhibitor is required for liberation of a protease that degrades the cohesions holding the sister chromatids together, thereby initiating the metaphase-to-anaphase transition. In order for APC/C to ubiquitylate Pds1/Securin, it must associate with its early mitosis-specific activator Cdc20 (also named p55Cdc in mammals, or Fizzy in Drosophila; for reviews, see Zachariae and Nasmyth, 1999; Nasmyth, 2002; Peters, 2002).
Multiple components of the mitotic spindle checkpoint have been identified in yeast and higher eukaryotes. In S.cerevisiae, the existence of a Mad1-dependent complex containing Mad2, Mad3, Bub3 and Cdc20 has been demonstrated (Fraschini et al., 2001). In mammalian cells, a mitotic checkpoint complex (MCC) consisting of Mad2, BubR1, Bub3 and Cdc20 can inhibit the APC/C (Sudakin et al., 2001), but how the association of this complex with the APC/C is regulated during the cell cycle is less clear. Mad2 itself forms a ternary complex with Cdc20 and Cdc27, a component of the APC/C, to inhibit APC/CCdc20-dependent ubiquitylation and degradation, thereby causing a cell cycle arrest in metaphase (Li and Benezra, 1996; Li et al., 1997; Fang et al., 1998; Kallio et al., 1998; Wassmann and Benezra, 1998). Thus, Mad2 represents an essential component of the mitotic checkpoint apparatus by acting as a negative regulator of the mitotic APC/C, most probably as part of the MCC (for a review, see Yu, 2002).
Mad2 has been shown to localize to unattached kinetochores in mitosis, and Mad2 staining disappears after attachment to the mitotic spindle (Chen et al., 1996; Li and Benezra, 1996; Waters et al., 1998). According to the current model, Mad2 is recruited to the kinetochores via its interaction with Mad1 (Chen et al., 1998), and inhibits APC/CCdc20. This inhibition maintains sister chromatid cohesion by preventing the destruction of Pds1/Securin (for reviews, see Burke, 2000; Wassmann and Benezra, 2001). The unattached kinetochore has been visualized as a ‘loading machine’, where a continuous ‘wait-anaphase’ signal is generated through the deposition of Mad2 onto the APC/C (Gorbsky et al., 1998; Howell et al., 2000). Approximately 10% of the total Mad2 protein is actually found in association with APC/CCdc20 (Li and Benezra, 1996; Wassmann and Benezra, 1998), and therefore this fraction must be critically important for the execution of the mitotic checkpoint. How the exceedingly tight interaction of Mad2 with Mad1 is broken without affecting its ability to associate with APC/CCdc20 is unknown and is particularly puzzling given recent structural data showing similar rearrangements in Mad2 upon binding to Mad1 or Cdc20 (Luo et al., 2002; Sironi et al., 2002). Nonetheless, once the checkpoint is satisfied, one can imagine that attachment of the spindle to the kinetochore somehow displaces or modifies the Mad1/Mad2 complex and prevents the loading of Mad2 onto the APC/C. Free APC/CCdc20 is now able to ubiquitylate its substrates, which in turn enables cells to proceed through the metaphase to anaphase transition.
In this paper, we address the question of how Mad2 association with Mad1 and APC/CCdc20 is regulated in human cells. We show that Mad2 is modified by phosphorylation on multiple serine residues in vivo, and that this phosphorylation is cell-cycle regulated. Furthermore, we find that only unphosphorylated Mad2 interacts with the APC/C and Mad1 in vivo. A Mad2 serine to aspartic acid mutant mimicking the phosphorylated state of the protein looses its ability to associate with Mad1, can not form a ternary complex with APC/CCdc20 and is non-functional. Furthermore, when stably expressed in a cell line, this protein behaves as a dominant negative, inhibiting the mitotic checkpoint response to nocodazole treatment. Thus, the phosphorylation status of Mad2 is critical in regulating the mitotic checkpoint in higher eukaryotic cells and suggests a model whereby its association with Mad1 and the APC/C are regulated by a phosphorylation–dephosphorylation cycle.
Results
Mad2 is phosphorylated on one or more serine residues
In order to determine whether the mitotic checkpoint protein Mad2 is modified by phosphorylation in vivo, nocodazole and hydroxyurea-arrested HeLa cells were labeled with [32P]ortho-phosphate. Treatment with nocodazole activates the metaphase-to-anaphase checkpoint and arrests cells in metaphase. Mad2 was immunoprecipitated with a monospecific polyclonal antibody (Li and Benezra, 1996). Mad2 immunoprecipitated from extracts of nocodazole-arrested metaphase cells with anti-Mad2 antiserum shows prominent 32P-incorporation, whereas Mad2 from cycling cells is only weakly phosphorylated, and incorporation of phosphate can be detected only upon longer exposure (Figure 1A; compare also with Figure 2A).

Fig. 1. Mad2 is phosphorylated on one or more serine residues in vivo and in vitro. (A) Mad2 is a phosphoprotein in vivo. Metabolically labeled nocodazole (+noc) and cycling (cycl.) arrested HeLa cell extracts were immunoprecipitated with pre-immune serum (p.i. Mad2) and anti-Mad2 (Mad2) immune serum, followed by an immunoprecipitation with anti-Mad2 immune serum to achieve very clean results (but the same result was obtained using a single- immunoprecipitation protocol). The immunoprecipitates were analyzed by gel electrophoresis and exposed to film and PhosphorImager. (B) In vitro phosphorylation of Mad2. Mad2 was immunoprecipitated from cycling (cycl.), nocodazole (+noc) and hydroxyurea (+HU)-arrested HeLa cells as indicated. Pre-immune serum from the same rabbit (p.i. Mad2) and anti-Mad2 immune serum (Mad2) were used for the immunoprecipitation. The immunoprecipitates were subjected to an in vitro kinase reaction, followed by a denaturing step and a second immunoprecipitation with anti-Mad2 immune serum under denaturing conditions. Incorporation of phosphate into Mad2 was analyzed by gel electrophoresis. (C) In vivo phosphorylated Mad2 from nocodazole-arrested cells was subjected to phospho-amino acid analysis. The identity of the phosphorylated residue(s) was determined by overlaying the radioactive signal with phospho-amino acid standards that were separated simultaneously on the thin layer cellulose plate and visualized with Ninhydrin (Sigma): S, serine; T, threonine; Y, tyrosine. (D) In vitro-labeled Mad2 from cycling and nocodazole-arrested HeLa cells was used for phospho-amino acid analysis as described above.

Fig. 2. In vivo phosphorylation of Mad2 is regulated during the cell cycle. In vivo-labeled Mad2 was immunoprecipitated with pre-immune serum (Mad2 p.i.) and anti-Mad2 serum (Mad2) and analyzed as described. Cells were pre-synchronized with aphidicolin in S-phase, arrested with thymidine and released from the thymidine block. Five times more cell extract was used at time point 0 to visualize the very weak signal of Mad phosphorylation in early S-phase. (A) SDS–PAGE analysis to visualize incorporation of phosphate into Mad2 (upper panel) and a Mad2 western blot (lower panel) to control for Mad2 protein levels. (B) Quantitation of phosphate incorporation into normalized Mad2 protein levels. (C) Cells staining positive for the Mpm2 epitope. (D) FACS analysis of the thymidine release. An aliquot of the release, which was not metabolically labeled but otherwise treated exactly the same way, was taken for FACS analysis.
To determine whether a kinase associated with Mad2 can phosphorylate Mad2 in an in vitro kinase assay, extracts from cycling, metaphase-arrested and early S-phase-hydroxyurea-arrested HeLa cells were prepared. Mad2 was immunoprecipitated under native conditions with anti-Mad2 antibody to maintain the interaction with a potential Mad2 specific kinase, incubated with [γ-32P]ATP in vitro and immunoprecipitated with the same antibody under denaturing conditions to detect the phosphoprotein. As shown in Figure 1B, Mad2 can be phosphorylated when isolated from nocodazole-arrested cells, and to a lesser extent, from cycling cells. No phosphorylation was detected when Mad2 was isolated from hydroxyurea-arrested cells, or pre-immune serum was used. An identical result was achieved with other polyclonal Mad2-specific antibodies (data not shown), and the phospho-Mad2 signal co-migrates with Mad2 identified by western blot (data not shown), therefore we can exclude that the signal observed is nonspecific or due to the antibody. The Mad2 protein sequence itself does not harbor a conserved kinase domain, and Mad2 protein produced in Escherichia coli is not capable of autophosphorylation (data not shown). We conclude that Mad2 is a phosphoprotein in vivo and co-precipitates a kinase capable of phosphorylating Mad2 in vitro.
To address which residues in Mad2 are modified by phosphorylation, in vivo and in vitro phosphorylated Mad2 was subjected to phospho-amino acid analysis. As shown in Figure 1C and D, Mad2 is exclusively phosphorylated on one or more serine residues in nocodazole-arrested cells in vivo (Figure 1C), and in cycling and nocodazole-arrested cells in vitro (Figure 1D). Incorporation of 32P into Mad2 in cycling cells labeled in vivo was too low to perform phospho-amino acid analysis.
Phosphorylation of Mad2 fluctuates during the cell cycle in vivo and is highest during mitosis
We next asked whether phosphorylation of Mad2 is cell cycle regulated and occurs in cells in the absence of spindle inhibitors. HeLa cells were presynchronized with aphidicolin, blocked with thymidine in early S-phase, and released. Cells were labeled with [32P]ortho-phosphate prior to harvesting at the indicated time points (Figure 2A). A parallel plate was harvested for FACS analysis and anti-Mpm2-epitope antibody staining to identify cells in mitosis (Davis et al., 1983). Incorporation of 32P into Mad2 peaks 11 h after release from the thymidine block (Figure 2A and B), which corresponds to the time when the cells undergo mitosis, as shown by the peak of cells staining for the Mpm2 epitope (Figure 2C) and FACS analysis (Figure 2D). Thirteen hours after the release, phosphorylation of Mad2 is still very high, but Mpm2 staining drops and cells exit mitosis. The same profile of Mad2 phosphorylation during the cell cycle was observed in in vitro kinase assays with extracts synchronized the same way as in the in vivo labeling experiment described here (data not shown). Therefore, Mad2 is phosphorylated in cells where the checkpoint has not been activated, and phosphorylation reaches its highest point when most cells are in mitosis, or exit mitosis.
Phosphorylation of Mad2 is highest when cells escape from nocodazole-induced checkpoint arrest
We examined whether in vivo phosphorylation of Mad2 increases immediately after release from a nocodazole block. Cells were labeled as above and a timepoint was taken 1 h after release from the nocodazole block. Figure 3A shows that phosphorylation of Mad2 is increased in cells that are released from the metaphase block compared with cells kept in nocodazole-containing medium (Figure 3A, compare lanes 2 and 4). It was important to determine whether the increase in Mad2 phosphorylation was a consequence of the relief of the checkpoint or simply proceeding through the cell cycle. Nocodazole-arrested cells were released into nocodazole-free medium containing the proteasome inhibitor MG132, a procedure that satisfies the spindle assembly checkpoint but maintains a metaphase arrest. Phosphorylation of Mad2 increases to a similar extent in cells released into MG132 (Figure 3A, lane 3) or media without MG132 (lane 4) relative to nocodazole-arrested cells (lane 2). Microscopic examination revealed a significant number of cells in anaphase or telophase when cells were released into medium without MG132, but only cells in metaphase when released into MG132-containing medium or kept in the nocodazole arrest (data not shown). Thus, the peak in Mad2 phosphorylation correlates with turning off the mitotic checkpoint and suggests an inhibitory role for Mad2 phosphorylation in this process.
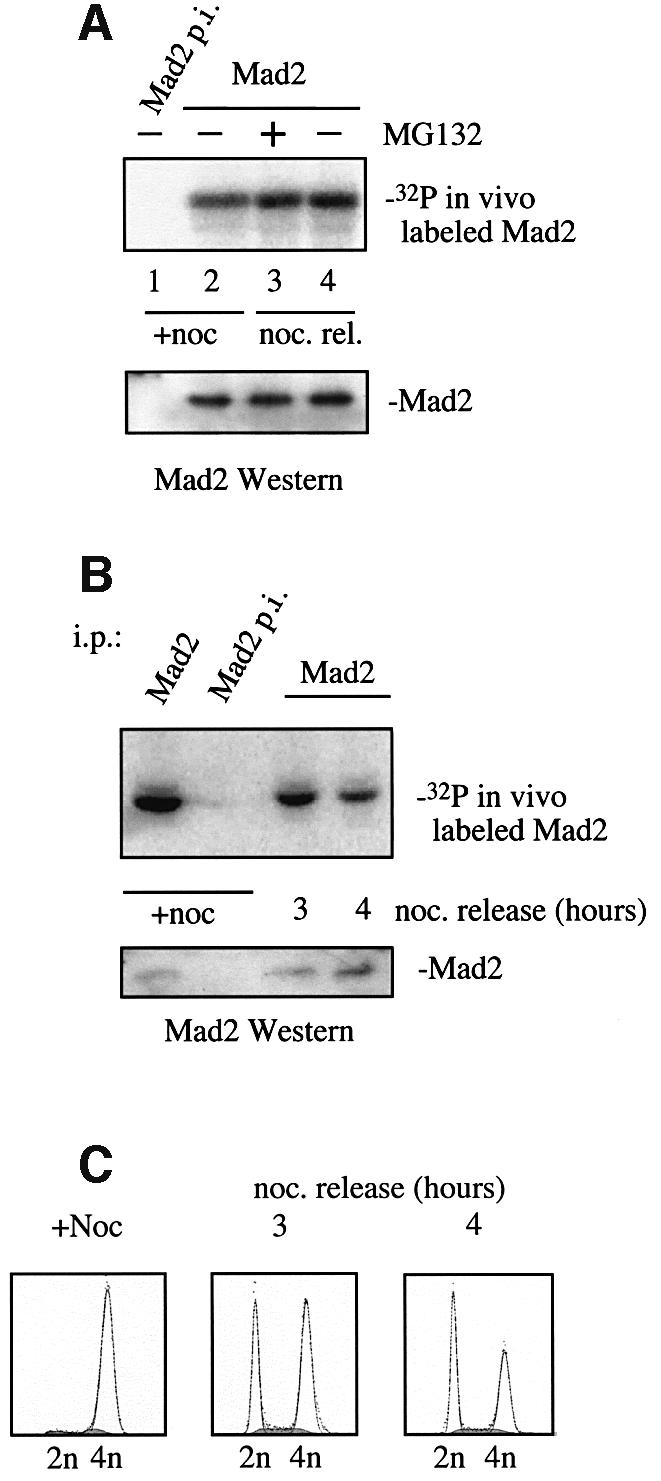
Fig. 3. HeLa cells were metabolically labeled as described in Figure 2. (A) Cells were arrested with nocodazole for 18 h and released for 1 h (noc. rel.) into medium containing the proteasome inhibitor MG132 where indicated. Shown is the phosphorylation of Mad2 after immunoprecipitation visualized on SDS–PAGE (upper panel) and Mad2 western blot (lower panel). (B) Cells were arrested with nocodazole for 18 h in metaphase and released for the time indicated. Phosphorylation of Mad2 after immunoprecipitation visualized on SDS–PAGE (upper panel) and Mad2 western blot (lower panel). (C) FACS profiles of the cells released from the nocodazole block in (B) at the indicated time points.
In order to determine whether phosphorylation of Mad2 drops as cells proceed into G1, HeLa cells were released from a nocodazole block and labeled with [32P]ortho-phosphate as above. Mad2 is phosphorylated during the cell cycle block as before. The intensity of the phosphorylation drops significantly 4 h after the release as cells enter G1 (Figure 3B and C).
Unphosphorylated endogenous Mad2 preferentially interacts with the APC/C
We sought to determine whether endogenous Mad2 in its unphosphorylated state preferentially interacts with Mad1 and APC/CCdc20, as predicted by the in vivo regulation of Mad2 phosphorylation described above. Nocodazole-arrested HeLa cells were metabolically labeled with [32P]ortho-phosphate, and lysates immunoprecipitated with anti-Cdc20, anti-Cdc27, and anti-Mad1 antisera. No 32P-labeled Mad2 is present in the Cdc20, Cdc27 or Mad1 immunoprecipitates, despite the fact that [32P]Mad2 is readily detected in an equivalent or lower amount of Mad2 from the total pool (Figure 4A). It is possible that Mad2 in association with APC/CCdc20 is sufficiently stable that during the course of the labeling reaction no Mad2 molecules become newly phosphorylated and incorporated in the complex. If so, one would expect that Mad2 in association with APC/CCdc20 would also fail to be labeled in vivo with [35S]methionine/cysteine, which is incorporated in newly synthesized proteins. But under the same conditions described for the metabolic labeling of Mad2 with 32P, incorporation of 35S can be observed in Mad2 molecules co-precipitating with Cdc20 in nocodazole-arrested cells (Figure 4B). Thus, we conclude that only the non-phosphorylated pool of Mad2 interacts with Mad1 and forms a ternary complex with APC/CCdc20.

Fig. 4. Only unphosphorylated Mad2 interacts with Cdc20, Cdc27, and Mad1 in vivo. (A) Nocodazole-treated HeLa cells were labeled metabolically with [32P]ortho-phosphate for 3 h. The cell extract was immunoprecipitated under native conditions with the following antibodies: pre-immune (p.i. Mad2), anti-Mad2 (Mad2), anti-Cdc20 (Cdc20), anti-Mad1 (Mad1) and anti-Cdc27 (Cdc27) serum. All immunoprecipitations were precipitated a second time under denaturing conditions with anti-Mad2 serum. One-hundredth of a direct Mad2 immunoprecipitation was loaded to compare the 32P signal to the co-immunoprecipitated Mad2 protein signal. (B) Nocodazole-treated HeLa cells were labeled metabolically with [35S]methionine/cysteine for 3 h and co-immunoprecipitations and western blot were performed as above.
Mapping the phosphorylated residues in Mad2
As a first step in understanding the role of phosphorylation in the regulation of Mad2, up to 12 serine residues were mutated to alanine in various combinations. Wild-type and mutant Mad2 constructs were tagged with the Flag-epitope at the N-terminus, and transfected into human 293T cells. 293T cells were used in these assays because transfection efficiencies and expression levels are higher than in HeLa cells. The 293T cells were metabolically labeled with [32P]ortho-phosphate 36–40 h after transfection. The exogenously expressed proteins were immunoprecipitated with the anti-Mad2 polyclonal antibody, followed by another immunoprecipitation with an antibody against the Flag-epitope. A double immunoprecipitation protocol was used as it gave the cleanest results, but the same result was achieved with a single immunoprecipitation using only the anti-Flag antibody (data not shown). The Mad2 proteins were all expressed at comparable levels as confirmed by Flag immunoprecipitation followed by Mad2 western blot analysis (Figure 5, lower panel). Substitution of 12 serines with alanines (12S-A Flag-Mad2, amino acid positions 6, 16, 30, 40, 89, 93, 114, 120, 170, 178, 185 and 195) completely abolishes phosphorylation of Mad2, under conditions where the wild-type Flag-epitope tagged Mad2 protein (Flag-Mad2) is phosphorylated (Figure 5). Substitution of serine 170, 178 and 195 (3S-A Flag-Mad2) and serine 170, 178, 185 and 195 (4S-A Flag-Mad2) generates a Mad2 protein that could no longer be phosphorylated in vivo (Figure 5). A mutant harboring serine to alanine substitutions at positions 170 and 178 (2S-A Flag-Mad2) shows reduced phosphorylation relative to Flag-Mad2, indicating that one or both serines at position 170 and 178 are phosphorylated (Figure 5). Mad2 harboring N-terminal serine to alanine substitutions (8S-A Flag-Mad2, serine 6, 16, 30, 40, 89, 93, 114 and 120 mutated to alanine) is still phosphorylated (Figure 5). Therefore, serines 170, 178 and 195 are either the predominant residues modified by phosphorylation or their phosphorylation is required for the phosphorylation of other, as yet unidentified serine residues in the N-terminus of Mad2.

Fig. 5. In vivo phosphorylation of Flag-Mad2 and S-A Flag-Mad2 mutant proteins carrying the indicated number of serine to alanine substitutions (S-A; see text for positions of the mutated residues). Mutant Mad2 proteins were generated by in vitro mutagenesis and tagged with the anti-Flag epitope tag at the N-terminus. 293T cells were transfected with the indicated constructs, and 18–24 h after transfection, arrested with nocodazole for 18 h prior to harvesting. One tenth of the immunoprecipitates was analyzed by western blot, the remaining was analyzed by SDS–PAGE and exposure to PhosphorImager.
The Mad2 aspartic acid mutant does not interact with Mad1, can not form a ternary complex with APC/CCdc20, and acts as a dominant negative
Serine to alanine substitutions can mimic the properties of the unphosphorylated state of a phosphoprotein, whereas aspartic acid substitutions can mimic phosphorylated residues. A Mad2 mutant with serine to aspartic acid substitutions at positions 170, 178 and 195 (3S-D Flag-Mad2) was generated. We asked whether alanine or aspartic acid substitutions at position 170, 178 and 195 had an effect on the association of Mad2 with its partners Cdc27 (a component of the APC/C), Mad1 and Cdc20, which are known to be required for Mad2 functioning (Chen et al., 1998; Fang et al., 1998; Kallio et al., 1998; Wassmann and Benezra, 1998).
To study the in vivo effects of the mutant proteins under physiological conditions we decided to generate stable 293 Tet-Off cell lines expressing either wild-type Flag-Mad2, 3S-A Flag-Mad2 or 3S-D Flag-Mad2 (the stable cell lines were named wild type, 3S-A and 3S-D, respectively) under the control of the tetracycline-controlled transactivator, which is repressed upon addition of doxycycline. Two cell lines expressing each construct were analyzed, and both gave similar results in the assays described below. Figure 6A shows a typical western blot of the different cell lines expressing the indicated Flag-Mad2 construct upon removal of doxycycline ∼48 h prior to harvesting. The overexpressed proteins were ubiquitously localized throughout the cell in all the stable lines (data not shown). All cell lines generated were viable when transcription of the Flag-Mad2 constructs was induced.


Fig. 6. Analysis of stable 293 cell lines expressing Flag-Mad2 (wt), 3S-A Flag-Mad2 (3S-A), and 3S-D Flag-Mad2 (3S-D) from an inducible promoter (A-F), and transiently transfected 293T cells (G). (A) Protein amounts of the Flag-Mad2 constructs after 48 h induction in the stable cell lines. (B) Interaction profiles of the Flag-Mad2 constructs expressed in the stable lines without nocodazole treatment. Immunoprecipitations were performed with anti-Flag antibody to visualize the amount of Cdc27 and Mad1 protein interacting with the Flag-tagged Mad2 construct, or anti-Cdc20 antibody to visualize the amount of Mad2 protein (endogenous and overexpressed) interacting with Cdc20. Ten percent of the anti-Flag immunoprecipitations were used as internal control and to estimate the levels of ectopically expressed Mad2 in the cells. One milligram cell extract was used for the co- immunoprecipitations. (C) Mitotic arrest after nocodazole treatment for the indicated time (in hours) of cell lines expressing the indicated Mad2 construct for 48 h prior to nocodazole treatment. Cells staining positive for the mitosis-specific Mpm2 epitope were counted. (D) Comparison of nocodazole response of a 3S-D line with (transcription of 3S-D Flag-Mad2 repressed) and without (transcription of 3S-D Flag-Mad2 induced) doxycycline (+/– Dox) by FACS analysis (upper panel). A representative Nomarski and Hoechst 33342 image to visualize the DNA of wild-type cells and a 3S-D cell line without doxycycline after nocodazole treatment is shown in the lower panel. (E) Accumulation of cells with >4N DNA content expressing the indicated constructs for 48 h without nocodazole treatment was determined through FACS analysis. (F) Co-immunoprecipitations in the stable cell lines using anti-Mad2 serum (Mad2 i.p., Mad2 p.i.: Mad2 pre-immune serum) to visualize interactions between both endogenous and overexpressed Mad2 with Cdc27 and Mad1. One milligram extract of each cell line was used, exept for the direct Mad2 immunoprecipitation control (lanes 1–4), where only a tenth was loaded. (G) 293T cells transfected with the indicated construct were analyzed as in (B). The indicated amounts of protein extract were used (left panel). The percentage of Flag-positive cells in metaphase was determined as described (right panel).
The stably expressed Mad2 proteins were immunoprecipitated from cell extracts with anti-Flag antibody, and the co-immunoprecipitated Cdc27 and Mad1 were visualized by western blot analysis (Figure 6B). Cdc20 co-migrates with the antibody heavy chain, which makes it difficult to visualize Cdc20 by western blot analysis in co-immunoprecipitations. Therefore, the same extracts were subjected to an immunoprecipitation with Cdc20 antibody, followed by a Mad2 western blot. Analysis of the interaction profiles of the stably expressed Mad2 constructs in cycling cells reveals that 3S-D Flag-Mad2 is unable to associate with Cdc27 (Figure 6B, lane 7) and Mad1 (Figure 6B, lane 11). The interaction with Cdc20 is also impaired (Figure 6B, lane 15). Similar results were observed in transient transfection assays (Figure 6G, lane 7 and 11). Finally, even though the protein amounts of 3S-A Flag-Mad2 are lower than those of Flag-Mad2 (Figure 6B, compare lanes 2 and 4), a stronger interaction with Cdc27 was observed (lanes 6 and 8), and the interaction with Mad1 and Cdc20 was preserved. Transient transfection assays showed similar results (Figure 6G, lane 8 and 12). We conclude that overexpressed Mad2 mimicking the phosphorylated protein is impaired in its ability to interact with Mad1 and to form a ternary complex with the APC/CCdc20.
No accumulation of cells in G2/M by FACS analysis upon expression of the different Mad2 constructs could be observed. Therefore, we treated the cell lines with nocodazole to analyze potential differences in the mitotic checkpoint response. The percentage of cells found to be in mitosis was assessed by counting cells positive for the mitosis-specific Mpm2 epitope, or visualizing the chromosomes with Hoechst 33342 and counting cells with their chromosomes condensed at the metaphase plate (Michel et al., 2001). 3S-D cells are impaired in their ability to arrest in mitosis after nocodazole treatment, relative to cells expressing wild-type Flag-Mad2 or 3S-A Flag-Mad2 (Figure 6C). After 20 h of nocodazole treatment, 50–60% of the wild type and 3S-A cell line are in metaphase, whereas only ∼30% of the 3S-D cell line are arrested in metaphase, indicating a dominant-negative effect over the endogenous Mad2 protein. We also noted that despite expressing lower protein levels than the wild-type cell line, 3S-A cell lines arrest with higher efficiencies, and escape later from the checkpoint arrest compared with the wild-type cell line. Similar results were also obtained in transient transfection assays. Transfected cells were distinguished through antibody staining with anti-Flag antibody, and cells in metaphase were identified as above. Flag-positive cells in metaphase were counted under the microscope (Figure 6G, right panel).
As another measure of the dominant-negative effect of the 3S-D mutant, the ability of 3S-D Flag-Mad2 expressing cell lines to arrest in response to nocodazole was compared with the same cell line under conditions where transcription was repressed (Figure 6D). FACS analysis revealed that the number of cells in G2/M drops from 70 to 32% after 18 h of nocodazole treatment when 3S-D Flag-Mad2 is expressed. Microscopic examination revealed that 3S-D cells become large and polynucleated after nocodazole treatment, indicating endoreduplication without cell division (Figure 6D). Therefore, we further confirmed that 3S-D Mad2 has a dominant-negative effect over endo genous Mad2 on the execution of the mitotic checkpoint.
We next asked whether the intrinsic checkpoint is affected in the stable cell lines, i.e. if the mitotic cycle is perturbed in cells upon induction of the different Mad2 constructs in the absence of spindle inhibitors. As mentioned above, no effects on cell cycle progression or timing could be observed on the cell population. However, after 48 h induction of the Mad2 constructs, the percentage of cells with >4N DNA content was at least 4-fold higher in lines expressing 3S-D Flag-Mad2 relative to wild type and vector alone controls (Figure 6E). This result indicates that there is a dominant-negative effect of the Mad2 phospho-mimic on the endogenous, intrinsic checkpoint.
The Mad2 phosphomimic displaces endogenous Mad2 from the APC/C
The effect of the different stably expressed constructs on the interaction of endogenous Mad2 with its partners was examined (Figure 6F). Immunoprecipitations with anti-Mad2 serum to visualize Cdc27 and Mad1 interacting with either endogenous or overexpressed Mad2 were performed. Whereas endogenous and overexpressed Mad2 immunoprecipitate Mad1 independent of the mutant construct expressed in the cell line (Figure 6F, lanes 10–12), the interaction between Cdc27 and endogenous Mad2 is severely affected in the 3S-D cell line (compare lane 7 with 6 and 8). Even after nocodazole treatment no interaction between endogenous Mad2 and Cdc27 could be detected in the 3S-D cell line (data not shown). As a result, no ternary Mad2–APC/CCdc20 complexes are present in those cells. It is likely that 3S-D Flag-Mad2 inhibits loading of endogenous Mad2 onto the APC/C, and therefore acts as a dominant negative. In summary, these results demonstrate that the phosphorylation state of the serine residues in the C-terminus of Mad2 is a critical determinant of its ability to interact with and signal to key components of the mitotic checkpoint pathway.
Discussion
Mad2 is an essential component of the mitotic checkpoint pathway and is required for sensing whether the mitotic spindle is properly attached to the kinetochores of paired sister chromatids (for review, see Burke, 2000; Wassmann and Benezra, 2001). When the spindle is correctly attached to the kinetochore, Mad2 dissociates from APC/CCdc20, which then targets the anaphase inhibitor Securin for degradation (for review, see Wassmann and Benezra, 2001; Nasmyth, 2002). Nevertheless, it has remained obscure as to how the interaction between APC/CCdc20 and Mad2 is regulated during the mitotic cycle. Mad2 has been found to dynamically associate with unattached kinetochores (Howell et al., 2000), suggesting a model where an unattached kinetochore would somehow activate Mad2 and allow it to load onto APC/CCdc20, thereby inhibiting the anaphase onset signal (Shah and Cleveland, 2000; Nigg, 2001). Furthermore, it has been suggested that Mad2 activity is regulated via oligomerization (Fang et al., 1998). However, recently it has been shown that oligomerization of Mad2 is not required for its function in vivo (Sironi et al., 2001).
In an attempt to identify the activated state of Mad2, we investigated whether human Mad2 is modified by phosphorylation and if phosphorylation of Mad2 regulates its interaction with APC/CCdc20. Previous studies have not reported any modifications of Mad2, primarily because no changes in the mobility of the protein as a result of that modification can be detected by gel electrophoresis. This paper describes for the first time the in vivo phosphorylation of human Mad2 and demonstrates that Mad2 protein–protein interactions are regulated by phosphorylation at its C-terminus.
The role of C-terminal phosphorylation of Mad2
The recently published solution structure of Mad2 focused our interest on the serine residues in the C-terminus of Mad2, since this region has been shown to be involved in the binding of APC/CCdc20 (Luo et al., 2000) and has been implicated in its binding to Mad1. A C-terminal deletion mutant of Mad2 is unable to interact with Cdc20 and Mad1 (Fang et al., 1998; Sironi et al., 2001). More recently, direct NMR structural analyses have indicated that a common structural motif in Mad1 and Cdc20 mediates a similar association and structural rearrangement in the C-terminus of Mad2 (Luo et al., 2002; Sironi et al., 2002). Mutating three serines in the C-terminus of Mad2 to aspartic acid ablates its ability to interact with Mad1 and form a ternary Mad2–APC/CCdc20 complex, and its ability to induce a metaphase arrest in stable cell lines. Consistent with these results is the observation that the phosphorylation of Mad2 in vivo peaks just after the spindle checkpoint is satisfied. Our data also provides a plausible mechanism for disrupting the exceedingly stable Mad1/Mad2 interaction (which resists urea concentrations of up to 4.0 M, and NaCl concentrations of up to 2.0 M; Sironi et al., 2001) by phosphorylation of several key residues of Mad2 at the Mad1/Mad2 interface. The three serine residues identified in this study are exposed in free Mad2 (apo-Mad2), and only S195 is burried in Mad1 or Cdc20 bound Mad2 (Mad2 lig). Phosphorylation of these sites is likely to have a significant impact on the interaction capacity of the C-terminus of Mad2 (Sironi et al., 2001, 2002; Luo et al., 2002). If phosphorylation of these serines is required to break the association with Mad1, then we can speculate that a subsequent dephosphorylation event is required to then allow association with APC/CCdc20. We note that serine 170 is conserved from yeast to man, and all three residues are conserved in higher eukaryotic cells, suggesting that regulation of Mad2 by phosphorylation may be conserved in other higher organisms.
The phenotypes of cell lines expressing a Mad2 mutant mimicking the phosphorylated protein demonstrate the importance of Mad2 phosphorylation. Stable expression of 3S-D Flag-Mad2 disrupts mitotic checkpoint response after nocodazole treatment, similar to what has been observed with a C-terminal deletion mutant in vitro (Fang et al., 1998). 293 Tet-Off cells are p53 negative, therefore these cells will not undergo apoptosis, but proceed into the next cell cycle and endoreduplicate without having properly separated their DNA. The 3S-D Flag-Mad2 is somehow able to inhibit endogenous Mad2 from generating the ‘wait-anaphase’ signal, and therefore is not acting as a simple loss-of-function protein. We show that the dominant-negative form of Mad2 can inhibit the association of endogenous Mad2 with APC/CCdc20, but the mechanism of this inhibition awaits clarification.
How a single unattached kinetochore inhibits cell cycle progression
Only the pool of unphosphorylated Mad2 is capable of associating with APC/CCdc20, perhaps due to changes in conformation, or just the correct localization. One or more Mad2-specific kinase(s) continuously phosphorylate Mad2 to displace it from APC/CCdc20, but as long as there is a single unattached kinetochore this Mad2 gets dephosphorylated by one or more phosphatases to allow continuous loading onto Mad1 and APC/CCdc20. As stated above, a phosphorylation–dephosphorylation cycle may be required to allow the transfer of Mad2 from Mad1 to the APC/CCdc20 complex. As soon as the last kinetochore attaches to microtubules, the last Mad1/Mad2 complex is displaced from the kinetochore and Mad2 can no longer be loaded onto APC/CCdc20. APC/CCdc20 becomes active by Mad2 phosphorylation and subsequent release from the complex, and metaphase to anaphase transition can now take place. We tried to address whether the different constructs are still localized to the kinetochore, but unfortunately we were not able to see specific kinetochore localization with the Flag antibody. It is likely that only a very small fraction of exogenously expressed Mad2 is localized to the kinetochore, which can not be visualized against the background of the majority of Mad2 localized ubiquitously throughout the cell. It is important to note that this type of high background is also observed with endogenous Mad2 (Li and Benezra, 1996; Li et al., 1997; Fang et al., 1998; Kallio et al., 1998).
Cancer cells are often defective in maintaining a metaphase arrest in response to spindle inhibitors, which leads to mis-segregation of chromosomes and aneuploidy. An impaired spindle checkpoint can result in chromosomal instability (Cahill et al., 1998; Basu et al., 1999; Kitagawa and Rose, 1999; Dobles et al., 2000) and tumor formation (Michel et al., 2001). It also determines how a tumor cell will react to certain therapeutic drugs such as taxol, which perturb the assembly of the mitotic spindle (Michel et al., 2001; Wassmann and Benezra, 2001). Understanding the signaling pathway regulating Mad2 phosphorylation may help identify other components that contribute to these phenotypes in human cancers. Therefore the identification of the kinases and phosphatases that modify Mad2 will be important for a complete understanding of the mitotic checkpoint pathway in tumor cells.
Materials and methods
Cell culture and transient transfections, generation of stable cell lines
HeLa and 293T cells were grown in DMEM (high glucose supplemented with 100 U/ml penicillin-G/100 µg/ml streptomycin and 10% fetal bovine serum). For cell extracts, cells were transiently transfected using calcium phosphate-DNA precipitates formed in HEPES (Bonifacino et al., 2000). For transient transfections in Figure 6F, 1.5 × 10⁵ 293T cells were transfected with 1 µg plasmid DNA in lipofectamine reagent as recommended by the manufacturer (Invitrogen). A Plasmid Maxiprep Kit (Bio-Rad) was used for DNA preparations.
Flag-tagged Mad2 constructs were transfected into human transformed primary embryonic kidney cells expressing the tetracycline-controlled transactivator (293 Tet-Off; Clontech), using lipofectamine reagent (Invitrogen) according to the manufacturer’s conditions. A 2 µg/ml aliquot of doxycycline (Clontech) was added to the cells 6 h after transfection, in order to repress the promoter. Forty-eight hours after transfection, Hygromycin B was added to the cells at a concentration of 100 µg/ml. Hygromycin-resistant clones were isolated and screened by western blotting for the presence of Flag-tagged Mad2. Flag-Mad2 positive clones were selected for posterior studies.
Plasmids, in vitro mutagenesis
Standard protocols were used for DNA manipulations (Ausubel et al., 1994). Human Mad2 was amplified by PCR using high-fidelity DNA polymerase (Expand High Fidelity Polymerase, Roche) from a HeLa cDNA library with primers that introduce a HindIII site before the first ATG, and a BamHI site downstream of the stop codon. hsMad2 was cloned in-frame into a pFlag-CMV-2 vector (Kodak), so that the translated protein harbors a Flag-epitope tag at the N-terminus (Flag-Mad2). The sequences of these primers and primers for in vitro mutagenesis are available upon request. To create stable cell lines, XbaI sites were introduced at both ends of several Flag-MAD2 constructs by PCR. The PCR products were cloned into the pUHD10-3 hygromycin vector (Gossen and Bujard, 1992) as XbaI–XbaI fragments. All constructs were verified by sequencing the entire Mad2 coding sequence.
Extracts, immunoblots and immunoprecipitation
Cell extracts were prepared as described previously (Wassmann and Benezra, 1998). Immunoprecipitations with metabolically labeled cell extracts were carried out as follows: per 150 µg of cell extract, 1 µl of anti-Mad2 rabbit-serum or pre-immune serum from the same rabbit (Li and Benezra, 1996) was added for 1–3 h. A mixture of equal amounts of protein A and Gamma-bind G Sepharose beads (Pharmacia) was added for another 2 h. The immunoprecipitates were washed three times with lysis buffer and twice with 50 mM Tris–HCl pH 7.5, before they were denatured by boiling in the presence of 1% SDS. The supernatants were diluted with lysis buffer containing 1% sodium deoxycholate to a final SDS concentration of 0.02%. A second immunoprecipitation as described above with anti-Mad2 serum (no pre-immune serum) was performed. The immunoprecipitates were washed three times with lysis buffer containing 1% sodium deoxycholate and three times with 50 mM Tris–HCl pH 7.5. Before the last washing step, a tenth of the immunoprecipitates was split off for a control Mad2 western blot. Incorporation of 32P into Mad2 was analyzed by SDS–PAGE on an 11.25% discontinuous SDS– polyacrylamide gel followed by visualization with the PhosphorImager (Molecular Dynamics, Storm 840).
Co-immunoprecipitation with metabolically labeled cell extracts was done essentially the same way as described above, except that 5 mg of cell extract was used and 1 µl of the indicated anti-serum per 300 µl protein extract was added (anti-Cdc20 antibody; Santa Cruz), anti-Cdc27 serum (Wassmann and Benezra, 1998) and anti-Mad1 serum (Jin et al., 1998). For the second immunoprecipitation, anti-Mad2 serum was used as above. Half of the immunoprecipitates were used for the control Mad2 western blot.
Extracts from stable cell lines harboring different ectopically expressed Flag-epitope tagged Mad2 constructs were immunoprecipitated with monoclonal anti-Flag antibody (Sigma). One microliter of both M2 and M5 anti-Flag antibody per 200 µl cell extract was added, otherwise the immunoprecipitations were done the same way as described above for the first round of immunoprecipitation. A tenth of the anti-Flag immunoprecipitation was loaded on a high-percentage gel to control for the amount of Mad2 immunoprecipitated. Aliquots of the same extracts were also used for anti-Cdc20 antibody (Santa Cruz) co-immunoprecipitations to detect endogenous and overexpressed Mad2 interacting with Cdc20. Mad2 and Cdc27 western blots were done as described above, except that a mouse monoclonal anti-Cdc27 antibody (Transduction Laboratories) diluted 1:1000 was used to visualize Cdc27 (Wassmann and Benezra, 1998). Mad1 western blots were incubated with anti-Mad1 antibody diluted 1:1000 (Jin et al., 1998).
In vitro kinase assay
HeLa cell extracts were prepared as described (Wassmann and Benezra, 1998). As above, Mad2 was immunoprecipitated once under native conditions from 300 µg of cell extract. The immunoprecipitates were washed with lysis buffer three times, and three times with 50 mM Tris–HCl pH 7.5. Kinase reactions were performed in the following kinase buffer: 20 mM Tris–HCl pH 7.5, 2 mM MgCl2, 2 mM EGTA, 2 mM EDTA, 5 mM NaCl, 0.05% β-mercaptoethanol, 0.1 mM orthovanadate, 15 mM phenylmethylsulfonyl fluoride, 15 mM 4-nitrophenylphosphate, 100 µM ATP. A 12 µl aliquot of kinase buffer and 5 µCi[ γ-32P]ATP (3000 Ci/mmol) were added to the immunoprecipitates for 20 min at 37°C. After the kinase reaction, the beads were washed three times with 50 mM Tris–HCl pH 7.5, denatured by boiling in 1% SDS, and diluted with lysis buffer containing 1% sodium deoxycholate to a final SDS concentration of 0.02%. A second immunoprecipitation, as described above, with only anti-Mad2 serum was performed. The immunoprecipitates were analyzed by SDS–PAGE on an 11.25% discontinuous SDS–polyacrylamide gel.
Cell synchronization and in vivo metabolic labeling with 32P and 35S
Stable cell lines were maintained in the presence of doxycycline (transcription repressed). Expression of Mad2 proteins was induced by washing the cells four times in PBS and maintaining them for 48 h in medium without doxycycline.
Nocodazole (12 ng/ml final concentration) or hydroxyurea (2 mM final concentration) was added for 16–18 h to arrest cells in metaphase and at the G1/S boundary, respectively. HeLa and transiently transfected 293T cells were used for in vivo labeling experiments. Approximately 107 cycling cells or cells arrested with hydroxyurea or nocodazole were harvested and kept for 2 h in 3 ml phosphate-depleted DMEM medium (with hydroxyurea or nocodazole, if arrested) prior to labeling. [32P]ortho-phosphate (1–3 mCi; NEN) was added to the phosphate-depleted cultures for 1–2 h for Mad2 immunoprecipitations, and 3 h for co-immunoprecipitation experiments. For co-immunoprecipitations the concentration of cells, medium and ortho-phosphate was scaled up ten times. Cells were harvested and extracts were prepared as described above. Metabolic labeling with 35S for the co-immunoprecipitation experiment was performed exactly the same way as with 32P, except that cells were kept in methionine-free instead of phosphate-depleted medium prior to the addition of Tran 35S-Label (ICN Radiochemicals). Cells were labeled for 3 h with 250 µCi/ 2 ml medium.
Release from early S-phase was performed by arresting 10 10-cm dishes of exponentially growing HeLa cells (∼3 × 10⁶ each dish) with aphidicolin (5 µg/ ml) for 17 h, followed by a release into fresh medium for 9 h. The presynchronized cells were arrested with thymidine (2 mM final concentration) for 15 h. The arrested cells were pooled and released into fresh medium. A zero time-point was taken before the thymidine release. For the release, the cells were seeded into 14 6-cm dishes. At 2.5 h prior to harvesting each time point, two plates for each time point were kept for 1.5 h in 3 ml phosphate-depleted DMEM medium. After 1.5 h, 0.5 mCi of ortho-phosphate was added to one of the two plates for 1 h. The metabolically labeled cells were harvested and cell extracts were prepared as described above. The second plate was kept without addition of ortho-phosphate and was used for FACS and Mpm2 staining. Both plates were harvested at the same time.
For the nocodazole release in Figure 3, five 10-cm dishes of exponentially growing HeLa cells were arrested with nocodazole (12 ng/ ml final concentration) for 18 h, and released into fresh medium. As before, a zero time-point was taken before the release. For the experiment shown in Figure 3A and B, four 10-cm dishes of nocodazole-arrested HeLa cells were washed in phosphate-depleted medium, and immediately released into medium containing ortho-phosphate and MG132 (10 µM final concentration) where indicated. Nocodazole-arrested cells were washed and labeled the same way in the presence of nocodazole. Cells were harvested after 1 h labeling. As above, parallel plates were treated the same way except for the addition of orthophosphate, and used for microscopic examination to verify the presence of cells in anaphase or telophase after release from nocodazole.
TCA precipitable counts of in vivo-labeled cell extracts, phospho-amino acid analysis
Incorporation of 32P into the cell extracts was measured by determining the TCA precipitable counts (Bonifacino et al., 2000). Only cell extracts with similar incorporation of 32P were used for a given experiment. In vitro- or in vivo-labeled Mad2 was prepared for phospho-amino acid analysis as described (Bonifacino et al., 2000). Phospho-amino acid analysis was performed with the Hunter Thin Layer Plate Electrophoresis System as suggested by the manufacturer using pH 1.9 buffer for the first dimension, and pH 3.5 buffer for the second dimension.
In situ immunofluorescence
In situ immunofluorescence of Flag-epitope tagged Mad2 was carried out as described (Bonifacino et al., 2000), except that PBG (PBS containing 0.2% gelatin and 0.5% BSA) was used instead of Saponin/PBS/FBS. Cells were stained with anti-Flag antibody (Sigma; M2 and M5 anti-Flag antibodies) diluted 1:500 in PBG, and secondary FITC-coupled anti-mouse antibody diluted as suggested by the manufacturer in PBG. DNA was visualized with Hoechst 33342. Cells were examined with a Zeiss fluorescence microscope (LSM510), and standard confocal microscopy.
Flow cytometry analysis (FACS)
Cells were harvested, washed once with PBS, once with PBS/EDTA/FBS (PBS containing 2 mM EDTA and 1% fetal bovine serum), and resuspended in 200 µl PBS/EDTA/FBS per confluent 10-cm dish. They were fixed by adding 2 ml of 70% ethanol dropwise and leaving them at 4°C overnight. Cells were resuspended in 0.5–2 ml PBS containing 50 µg/ml RNase A and 0.05 µg/ml propridium iodide. Fluorescence was measured using a Becton Dickinson FACScan (FACS Calibur) and analyzed using Multicycle (Phoenix Flow).
Acknowledgments
Acknowledgements
We thank M.Dobles, S.Keeney, C.Rachez, E.Stillwell and C.Sunkel for critical reading of the manuscript, D.Domingo for FACS analysis, and K.T.Jeang for anti-Mad1 antibody. K.W. thanks A.Koff and members of his laboratory for helpful discussions, members of J.Massague’s laboratory for reagents, R.Schwartzmann for technical assistance, B.Maro and members of the laboratory for helpful discussions and C.Rachez for his unwavering support and encouragement throughout the project. V.L. thanks Helen Shum for technical assistance. R.B. was supported by a grant from the National Institute of Health (R01 GM54601), and V.L. through PRAXISXXI (BD18587/98, Portugal). This work was also supported by an ARC (Association pour la Recherche sur le Cancer) grant to B.Maro. The project described was made possible in part by funds granted by the Michael & Ethel Cohen Fellowship Fund and an ARC postdoctoral fellowship to K.W.
References
- Ausubel M.F., Brent,R., Kingston,R.E., Moore,D.D., Seidman,J.G., Smith,J.A. and Struhl,K. (1994) Current Protocols in Molecular Biology. John Wiley & Sons, Inc., Cambridge.
- Basu J., Bousbaa,H., Logarinho,E., Li,Z., Williams,B.C., Lopes,C., Sunkel,C.E. and Goldberg,M.L. (1999) Mutations in the essential spindle checkpoint gene bub1 cause chromosome missegregation and fail to block apoptosis in Drosophila. J. Cell Biol., 146, 13–28. [DOI] [PMC free article] [PubMed] [Google Scholar]
- Bonifacino J.S., Dasso,M., Harford,J.B., Lippincott-Schwartz,J. and Yamada,K.M. (2000) Current Protocols in Cell Biology. John Wiley & Sons, Inc, Cambridge.
- Burke D.J. (2000) Complexity in the spindle checkpoint. Curr. Opin. Genet. Dev., 10, 26–31. [DOI] [PubMed] [Google Scholar]
- Cahill D.P., Lengauer,C., Yu,J., Riggins,G.J., Willson,J.K., Markowitz,S.D., Kinzler,K.W. and Vogelstein,B. (1998) Mutations of mitotic checkpoint genes in human cancers. Nature, 392, 300–303. [DOI] [PubMed] [Google Scholar]
- Chen R.H., Waters,J.C., Salmon,E.D. and Murray,A.W. (1996) Association of spindle assembly checkpoint component XMAD2 with unattached kinetochores. Science, 274, 242–246. [DOI] [PubMed] [Google Scholar]
- Chen R.H., Shevchenko,A., Mann,M. and Murray,A.W. (1998) Spindle checkpoint protein Xmad1 recruits Xmad2 to unattached kinetochores. J. Cell Biol., 143, 283–295. [DOI] [PMC free article] [PubMed] [Google Scholar]
- Davis F.M., Tsao,T.Y., Fowler,S.K. and Rao,P.N. (1983) Monoclonal antibodies to mitotic cells. Proc. Natl Acad. Sci. USA, 80, 2926–2930. [DOI] [PMC free article] [PubMed] [Google Scholar]
- Dobles M., Liberal,V., Scott,M.L., Benezra,R. and Sorger,P.K. (2000) Chromosome missegregation and apoptosis in mice lacking the mitotic checkpoint protein Mad2. Cell, 101, 635–645. [DOI] [PubMed] [Google Scholar]
- Fang G., Yu,H. and Kirschner,M.W. (1998) The checkpoint protein MAD2 and the mitotic regulator CDC20 form a ternary complex with the anaphase-promoting complex to control anaphase initiation. Genes Dev., 12, 1871–1883. [DOI] [PMC free article] [PubMed] [Google Scholar]
- Fraschini R., Beretta,A., Sironi,L., Musacchio,A., Lucchini,G. and Piatti,S. (2001) Bub3 interaction with Mad2, Mad3 and Cdc20 is mediated by WD40 repeats and does not require intact kinetochores. EMBO J., 20, 6648–6659. [DOI] [PMC free article] [PubMed] [Google Scholar]
- Gorbsky G.J., Chen,R.H. and Murray,A.W. (1998) Microinjection of antibody to Mad2 protein into mammalian cells in mitosis induces premature anaphase. J. Cell Biol., 141, 1193–1205. [DOI] [PMC free article] [PubMed] [Google Scholar]
- Gossen M. and Bujard,H. (1992) Tight control of gene expression in mammalian cells by tetracycline-responsive promoters. Proc. Natl Acad. Sci. USA, 89, 5547–5551. [DOI] [PMC free article] [PubMed] [Google Scholar]
- Howell B.J., Hoffman,D.B., Fang,G., Murray,A.W. and Salmon,E.D. (2000) Visualization of Mad2 dynamics at kinetochores, along spindle fibers, and at spindle poles in living cells. J. Cell Biol., 150, 1233–1250. [DOI] [PMC free article] [PubMed] [Google Scholar]
- Jin D.Y., Spencer,F. and Jeang,K.T. (1998) Human T cell leukemia virus type 1 oncoprotein Tax targets the human mitotic checkpoint protein MAD1. Cell, 93, 81–91. [DOI] [PubMed] [Google Scholar]
- Kallio M., Weinstein,J., Daum,J.R., Burke,D.J. and Gorbsky,G.J. (1998) Mammalian p55CDC mediates association of the spindle checkpoint protein Mad2 with the cyclosome/anaphase-promoting complex, and is involved in regulating anaphase onset and late mitotic events. J. Cell Biol., 141, 1393–1406. [DOI] [PMC free article] [PubMed] [Google Scholar]
- Kitagawa R. and Rose,A.M. (1999) Components of the spindle-assembly checkpoint are essential in Caenorhabditis elegans. Nat. Cell Biol., 1, 514–521. [DOI] [PubMed] [Google Scholar]
- Li Y. and Benezra,R. (1996) Identification of a human mitotic checkpoint gene: hsMAD2. Science, 274, 246–248. [DOI] [PubMed] [Google Scholar]
- Li Y., Gorbea,C., Mahaffey,D., Rechsteiner,M. and Benezra,R. (1997) MAD2 associates with the cyclosome/anaphase-promoting complex and inhibits its activity. Proc. Natl Acad. Sci. USA, 94, 12431–12436. [DOI] [PMC free article] [PubMed] [Google Scholar]
- Luo X., Fang,G., Coldiron,M., Lin,Y., Yu,H., Kirschner,M.W. and Wagner,G. (2000) Structure of the Mad2 spindle assembly checkpoint protein and its interaction with Cdc20. Nat. Struct. Biol., 7, 224–229. [DOI] [PubMed] [Google Scholar]
- Luo X., Tang,Z., Rizo,J. and Yu,H. (2002) The mad2 spindle checkpoint protein undergoes similar major conformational changes upon binding to either mad1 or cdc20. Mol. Cell, 9, 59–71. [DOI] [PubMed] [Google Scholar]
- Michel L.S. et al. (2001) MAD2 haplo-insufficiency causes premature anaphase and chromosome instability in mammalian cells. Nature, 409, 355–359. [DOI] [PubMed] [Google Scholar]
- Nasmyth K. (2002) Segregating sister genomes: the molecular biology of chromosome separation. Science, 297, 559–565. [DOI] [PubMed] [Google Scholar]
- Nigg E.A. (2001) Mitotic kinases as regulators of cell division and its checkpoints. Nat. Cell Biol., 2, 21–32. [DOI] [PubMed] [Google Scholar]
- Peters J.M. (2002) The anaphase-promoting complex: proteolysis in mitosis and beyond. Mol. Cell, 9, 931–943. [DOI] [PubMed] [Google Scholar]
- Shah J.V. and Cleveland,D.W. (2000) Waiting for anaphase: Mad2 and the spindle assembly checkpoint. Cell, 103, 997–1000. [DOI] [PubMed] [Google Scholar]
- Sironi L., Melixetian,M., Faretta,M., Prosperini,E., Helin,K. and Musacchio,A. (2001) Mad2 binding to Mad1 and Cdc20, rather than oligomerization, is required for the spindle checkpoint. EMBO J., 20, 6371–6382. [DOI] [PMC free article] [PubMed] [Google Scholar]
- Sironi L., Mapelli,M., Knapp,S., De Antoni,A., Jeang,K.T. and Musacchio,A. (2002) Crystal structure of the tetrameric Mad1–Mad2 core complex: implications of a ‘safety belt’ binding mechanism for the spindle checkpoint. EMBO J., 21, 2496–2506. [DOI] [PMC free article] [PubMed] [Google Scholar]
- Sudakin V., Chan,G.K. and Yen,T.J. (2001) Checkpoint inhibition of the APC/C in HeLa cells is mediated by a complex of BUBR1, BUB3, CDC20, and MAD2. J. Cell Biol., 154, 925–936. [DOI] [PMC free article] [PubMed] [Google Scholar]
- Wassmann K. and Benezra,R. (1998) Mad2 transiently associates with an APC/p55Cdc complex during mitosis. Proc. Natl Acad. Sci. USA, 95, 11193–11198. [DOI] [PMC free article] [PubMed] [Google Scholar]
- Wassmann K. and Benezra,R. (2001) Mitotic checkpoints: from yeast to cancer. Curr. Opin. Genet. Dev., 11, 83–90. [DOI] [PubMed] [Google Scholar]
- Waters J.C., Chen,R.H., Murray,A.W. and Salmon,E.D. (1998) Localization of Mad2 to kinetochores depends on microtubule attachment, not tension. J. Cell Biol., 141, 1181–1191. [DOI] [PMC free article] [PubMed] [Google Scholar]
- Yu H. (2002) Regulation of APC-Cdc20 by the spindle checkpoint. Curr. Opin. Cell Biol., 14, 706–714. [DOI] [PubMed] [Google Scholar]
- Zachariae W. and Nasmyth,K. (1999) Whose end is destruction: cell division and the anaphase-promoting complex. Genes Dev., 13, 2039–2058. [DOI] [PubMed] [Google Scholar]