

Abstract
Epidermal growth factor (EGF) activates Ras and Rap1 at distinct intracellular regions. Here, we explored the mechanism underlying this phenomenon. We originally noticed that in cells expressing Epac, a cAMP-dependent Rap1 GEF (guanine nucleotide exchange factor), cAMP activated Rap1 at the perinuclear region, as did EGF. However, in cells expressing e-GRF, a recombinant cAMP-responsive Ras GEF, cAMP activated Ras at the peripheral plasma membrane. Based on the uniform cytoplasmic expression of Epac and e-GRF, GEF did not appear to account for the non-uniform increase in the activities of Ras and Rap1. In contrast, when we used probes with reduced sensitivity to GTPase-activating proteins (GAPs), both Ras and Rap1 appeared to be activated uniformly in the EGF-stimulated cells. Furthermore, we calculated the local rate constants of GEFs and GAPs from the video images of Ras activation and found that GAP activity was higher at the central plasma membrane than the periphery. Thus we propose that GAP primarily dictates the spatial regulation of Ras family G proteins, whereas GEF primarily determines the timing of Ras activation.
Keywords: FRET/GAP/GEF/Rap1/Ras
Introduction
Ras family G proteins cycle between two states, a GDP-bound inactive form and a GTP-bound active form (Bourne et al., 1990; Downward, 1992), and function as molecular switches in a variety of signal transduction cascades (Bos, 1997; Campbell et al., 1998). Their ‘on’ and ‘off’ states are controlled by guanine nucleotide exchange factors (GEFs) and GTPase-activating proteins (GAPs), respectively (Vetter and Wittinghofer, 2001). Progress in genome sequencing projects has led to the discovery of a plethora of GEFs and GAPs for Ras family G proteins (Zwartkruis and Bos, 1999). At the same time, biochemical and genetic studies are helping to elucidate the mechanism by which many signals converge on Ras family G proteins via various types of GEFs and GAPs (Grewal et al., 1999).
Rap1, a subgroup of the Ras family G proteins, was identified originally as a suppressor of Ras-dependent transformation of NIH 3T3 cells (Kitayama et al., 1989). In agreement with this finding, overexpression of Rap1 has been shown to inhibit Ras-dependent activation of extracellular-regulated kinase/mitogen-activated kinase (ERK/MAPK) and Elk1 transcriptional factor (Cook et al., 1993; Hu et al., 1997). This may be because Rap1 binds to c-Raf and inhibits c-Raf stimulation of ERK/MAPK (Okada et al., 1999). Alternatively, the observation that Ras and Rap1 are condensed at the plasma membrane and endoplasmic reticulum, respectively (Furth et al., 1982; Pizon et al., 1994), suggests that Rap1 sequesters c-Raf from the plasma membrane and thereby inhibits c-Raf activation of ERK/MAPK (Matsubara et al., 1999).
Recent reports from several research groups have suggested that rap1 may not be a mere anti-ras gene, but may have a discrete function of its own, such as integrin modulation (Posern et al., 1998; Tsukamoto et al., 1999; Katagiri et al., 2000; Reedquist et al., 2000) or B-Raf-dependent activation of ERK/MAPK in neuronal cells (Yoshida et al., 1992; Vossler et al., 1997; Altschuler and Ribeiro-Neto, 1998; York et al., 1998). Recently, the importance of the Rap1 signaling pathway has been shown for the first time in mammalian cells by the analysis of knockout mice for C3G, which is a Rap1 GEF and required for integrin-mediated cell adhesion and cellular spreading (Ohba et al., 2001).
We previously developed probes for obtaining live images of Ras and Rap1 activities (Mochizuki et al., 2001) based on the principle of fluorescence resonance energy transfer (FRET) technology between two mutants of green fluorescent protein [yellow fluorescent protein (YFP) and cyan fluorescent protein (CFP)] (Tsien and Miyawaki, 1998). The probes, named Ras and interacting chimeric unit (Raichu), have revealed that growth factors, including epidermal growth factor (EGF) and nerve growth factor (NGF), activate Ras at the peripheral plasma membrane, whereas they activate Rap1 at the endomembrane compartment (Mochizuki et al., 2001). These findings indicate that the activities of Ras family G proteins are regulated spatially within the cell. In this study, we explored the mechanism of this spatial regulation of the Ras family G proteins and found that the activation sites of Ras family G proteins were predetermined irrespective of the type of GEFs used for the stimulation and that GAP appears to dictate the spatial regulation of Ras and Rap1.
Results
Requirement for receptor endocytosis for EGF-dependent activation of Rap1, but not for Ras
To understand the mechanism of the spatial regulation of Ras and Rap1, we first studied the effect of receptor-mediated endocytosis on the local activities of Ras and Rap1 by the use of Raichu-Ras and Raichu-Rap1. As shown in Figure 1A and B, monodansylcadaverine (MDC), which has been reported to suppress clathrin-dependent endocytosis (Schlegel et al., 1982; Ray and Samanta, 1996; Schutze et al., 1999), inhibited EGF-induced Rap1 activation at the perinuclear region, but not EGF-induced Ras activation. We confirmed the effect of MDC on endogenous Ras and Rap1 by Bos’ pull-down method (Figure 1C). Again, MDC inhibited EGF-induced Rap1 activation, but not EGF-induced Ras activation.

Fig. 1. Requirement for endocytosis for EGF-dependent activation of Rap1. (A) Cos-1 cells were transfected with pRaichu-Ras or pRaichu-Rap1. After 24 h, the cells were serum starved for 4 h, treated with MDC or left untreated, and stimulated with 50 ng/ml EGF for 5 min. Images of YFP and CFP were collected by means of an inverted microscope equipped with a cooled CCD camera. A ratio image of YFP/CFP was created to represent FRET efficiency. In the IMD mode shown here, eight colors from red to blue are used to represent the YFP/CFP ratio, with the intensity of each color indicating the mean intensity of YFP and CFP as indicated at the bottom of the photographs. The upper and lower limits of the ratio range are shown at the bottom. (B) Cos-1 cells prepared as in (A) were imaged and YFP/CFP emission ratios were obtained. Average values of fold increase in emission ratio after versus before stimulation of 10 cells are shown with standard deviation. (C) Cos-1 cells treated as in (A) were lysed in lysis buffer, clarified by centrifugation and analyzed by the pull-down method to detect active Ras and Rap1. (D) Cos-1 cells were transfected with pRaichu-Rap1 and with empty vectors (none), expression vectors for Cbl-G306E (G306E), or that for Cbl-70Z (70Z). After 24 h, the cells were serum starved and stimulated with 50 ng/ml EGF for 5 min. FRET images are displayed as in (A). (E) Cos-1 cells prepared as in (D), and quantitated as in (B). (F) Cos-1 cells treated as in (D) were analyzed by the pull-down method to detect the active Rap1. Aliquots of cell lysates were used to determined the expression level of Cbl by using anti-HA antibody.
The essential role of endocytosis in Rap1 activation was corroborated further by the effect of two dominant-negative mutants of Cbl, G306E and 70Z, both of which inhibit EGF receptor (EGFR) endocytosis and degradation (Lill et al., 2000). When we introduced these dominant-negative mutants of Cbl, EGF-dependent activation of Rap1 was significantly diminished, as demonstrated by using Raichu-Rap1 (Figure 1D and E) and by the pull-down method (Figure 1F).
cAMP-dependent activation of Rap1
The above observation raised two possibilities. First, the GEF for Rap1 might have been activated only at the endomembrane. Secondly, Rap1 might not have been activated at the peripheral plasma membrane even in the presence of activated GEF. To determine which mechanism was operative, we examined the spatial pattern of Rap1 activation upon cAMP stimulation. We used Rat1a cells, where an increase in intracellular cAMP activates Rap1 via Epac, a cAMP-responsive GEF for Rap1 (Zwartkruis et al., 1998). The basal Rap1 activity in Rat1a cells was high in the central region of the cells, as in Cos-1 cells (Figure 2A). Upon stimulation by an adenylate cyclase activator, forskolin, in combination with a phosphodiesterase inhibitor, 3-isobutyl-1-methylxanthine (IBMX), Rap1 was activated most prominently at the perinuclear region, as we observed in EGF-stimulated cells (Figure 2A and B). However, unlike EGF, cAMP also activated Rap1 in the presence of MDC, as demonstrated by both imaging and pull-down assay (Figure 2A–C). Very similar results were obtained with a cAMP analog, Sp-cAMPS triethylamine (data not shown). These results strongly suggested that Rap1 activation occurs mostly at the central region of the cells, irrespective of upstream GEFs.

Fig. 2. cAMP-dependent activation of Rap1. (A) Rat1a cells were transfected with pRaichu-Rap1, serum starved for 4 h, treated with MDC or left untreated, and stimulated with 50 µM forskolin (FK) and 100 µM IBMX for 5 min. Cell images were taken as in Figure 1. (B) Rat1a cells treated as in (A) were quantitated as in Figure 1B. (C) Rat1a cells prepared as in (A) were analyzed by the pull-down method. (D) Cos-1 cells were transfected with pRaichu-Rap1 and pIRM21-Flag-Epac. After 24 h, the cells were serum starved, treated with MDC or left untreated, and stimulated with FK and IBMX. FRET images were taken as in Figure 1. (E) Cos-1 cells were transfected with pRaichu-Rap1 and pIRM21-Flag-Epac, or with pRaichu-Rap1 and Epac-F. After 24 h, the cells were serum starved and stimulated with FK and IBMX. Ratio images were created at the time indicated at the bottom of each panel. (F) Cos-1 cells prepared as in (D) and (E) were quantitated as in (B). (G) Cos-1 cells expressing Epac and Epac-F were fixed with paraformaldehyde, permeabilized with Triton X-100 and immunostained with anti-Flag monoclonal antibody, followed by incubation with Alexa488-conjugated goat anti-mouse antibody. The cells were imaged with a confocal microscope. (H) Cos-1 cells prepared as in (D) and (E) were analyzed by the pull-down method. Aliquots of cell lysates were analyzed for the expression of Epac and Epac-F by using anti-Flag antibody.
We further studied the mechanism of Epac-mediated Rap1 activation in Cos-1 cells. Cos-1 cells neither express Epac nor show an increase in activated Rap1 upon cAMP stimulation; however, by the expression of Epac, they became responsive to cAMP. As shown in Figure 2D–F, cAMP activated Rap1 most prominently at the perinuclear region in Epac-expressing Cos-1 cells, as in Rat1a cells, in a manner independent of endocytosis. Because Epac was localized uniformly in the cytoplasm (Figure 2G) and because cAMP was expected to stimulate Epac directly, the above observations suggested that Rap1 activation was suppressed at the peripheral plasma membrane and that endocytosis was required for the translocation of the EGF-stimulated GEF to the endomembrane.
To consolidate this hypothesis further, we forced Epac to localize preferentially at the plasma membrane and endomembrane, and examined the site of Rap1 activation. For this purpose, we prepared Epac-F, in which a CAAX box sequence of Ki-Ras was fused at the C-terminus of Epac (Figure 2G). Then, Cos-1 cells expressing Epac-F were stimulated with forskolin in the presence of IBMX. Rap1 activation was again initiated from the perinuclear region in Epac-F-expressing cells (Figure 2E and H), as in cells expressing the authentic Epac. The FRET images were quantitated to confirm that the cAMP-induced Rap1 activation is statistically significant. Since fragmented Raichu-Rap1 probes sometimes accumulated in the nucleus, we omitted the signals from the nuclear region before analysis. As shown in Figure 2F, the activation of Rap1 by either Epac or Epac-F was not inhibited by MDC. This observation supported the idea that the endomembrane region was the predetermined site of Rap1 activation and that endocytosis was required for the translocation of EGF-stimulated GEF, but not for other GEFs, including Epac.
cAMP-dependent activation of Ras
Does a similar mechanism underlie the localized activation of Ras? To address this question, we engineered a chimeric protein, named e-GRF. The e-GRF protein consisted of the regulatory region of Epac and the GEF domain of RasGRF, a GEF for Ras and R-Ras (Figure 3A). To examine whether e-GRF stimulates Ras in response to cAMP, 293T cells expressing e-GRF were stimulated with Sp-cAMPS, and examined for the levels of the GTP-bound form of Ras, R-Ras and Rap1 by the pull-down assay (Figure 3B). As expected, in e-GRF-expressing cells, Ras and R-Ras, but not Rap1, were activated in a cAMP-dependent manner. The basal level of GTP-Ras in e-GRF-expressing cells is higher than that of control cells, suggesting incomplete suppression of GEF activity by the Epac-derived regulatory domain. Nevertheless, the cAMP-dependent increase in GTP-Ras clearly shows that e-GRF can be used as a cAMP-responsive GEF for Ras. We did not find any difference between the distribution of Epac and that of e-GRF, both of which were localized diffusely throughout the cytoplasm of Cos-1 cells (Figure 3E). Cos-1 cells expressing e-GRF and Raichu-Ras were then stimulated with forskolin and IBMX. An increase in cAMP activated Ras predominantly at the peripheral plasma membrane of e-GRF-expressing cells (Figure 3C and D; movie files can be viewed as Supplementary figure 3, available at The EMBO Journal Online), as did EGF (Figure 1A). This observation indicated that Ras activation also occurred predominantly in the peripheral plasma membrane, irrespective of the distribution of GEF.

Fig. 3. cAMP-dependent activation of Ras. (A) Schematic illustration of Ras GRF, Epac and a chimera named e-GRF. PH, pleckstrin homology domain; IQ, IQ motif; DH, Dbl homology domain; RA, Ras-associating domain; GEF, GEF catalytic (CDC25 homology) domain; DEP, domains that occur in Dishevelled, Egl-10 and pleckstrin; cNMP, cyclic nucleotide monophosphate-binding motif. (B) 293T cells were transfected with expression plasmids for G proteins with or without those for GEFs as indicated at the top and on the left. After 24 h, the cells were serum starved for 4 h, stimulated by the cAMP analog, Sp-cAMPS triethylamine (cAMP), and the GTP-bound form of the respective G proteins was detected by the pull-down method. (C) Cos-1 cells expressing Raichu-Ras and e-GRF were stimulated and imaged as in Figure 2B. (D) Cos-1 cells prepared as in (C) were quantitated as in Figure 2B. (E) Cos-1 cells expressing Flag-tagged e-GRF were immunostained as in Figure 2G. Cos-1 cells expressing Raichu-Ras and e-GRF were stimulated and imaged as in Figure 2B.
Activation of Ras and Rap1 by various GEFs
To extend our observation to other GEFs, we imaged Cos-1 cells expressing Raichu-Ras or Rap1 in combination with various GEF proteins. We used Sos, RasGRF, CalDAG-GEFII and CalDAG-GEFIII as GEFs for Ras, and C3G, CalDAG-GEFI, CalDAG-GEFIII, Repac and PDZ-GEF1 as GEFs for Rap1. We have shown previously that overexpression of these GEFs increases in the GTP-bound form of Ras and/or Rap1 (Ohba et al., 2000a,b; Yamashita et al., 2000). GEFs for Ras activated Ras predominantly at the peripheral plasma membrane (Figure 4A), whereas GEFs for Rap1 activated Rap1 at the perinuclear region (Figure 4B). These results supported a model in which the activation sites of Ras and Rap1 were predetermined before GEF activation.

Fig. 4. Ras and Rap1 activation by various GEFs. Cos-1 cells were transfected with pRaichu-Ras (A) and pRaichu-Rap1 (B), and with expression vectors for the GEF proteins as indicated at the top of each panel. After 24 h, ratio images were taken as in Figure 2. The cells expressing Epac and Riachu-Rap1 were stimulated with forskolin and IBMX as described in Figure 3B.
GAP participation in forming the intracellular gradient of G protein activity
The above results raised the question of whether GAP determines the activation sites of Ras and Rap1. To answer this question, we used Gly12 mutants of Ras and Rap1. Substitution of valine for Gly12 in Ras family G proteins is known to impair significantly their sensitivity to GAPs (Maruta et al., 1991; Scheffzek et al., 1997; Brinkmann et al., 2002), although intrinsic GTPase activity is also diminished to some extent by this mutation. We introduced the Gly12Val mutation into Raichu-Ras and Raichu-Rap1, and named the resulting mutants Raichu-RasV12 and Raichu-Rap1V12, respectively. As shown in Figure 5A, >80% of Flag-RasV12 and Raichu-RasV12 were bound to GTP, and this percentage was increased to 90% by the co-expression of Sos. The FRET efficiency of Raichu-RasV12 was increased from 2.8 to 3.1 by Sos (Figure 5B). Similarly, 37% of Flag-Rap1V12 and 60% of Raichu-Rap1V12 were bound to GTP, and these percentages were increased to 55 and 66%, respectively, by the co-expression of PDZ-GEF1, a Rap1-specific GEF (Figure 5C). The FRET efficiency of Raichu-Rap1V12 was increased from 1.9 to 2.4 by PDZ-GEF1 (Figure 5D). Thus, V12 mutants were still responsive to GEF despite the high GTP ratio because of their reduced sensitivity to GAP relative to the wild type.

Fig. 5. Ratio images obtained by probes with reduced sensitivity to GAPs. (A) 293T cells were transfected with expression vectors for flag-tagged Ras wild type, flag-tagged RasV12, Raichu-Ras wild type and Raichu-RasV12 with or without that for Sos. After 36 h, the cells were lysed, clarified by centrifugation, and Flag tagged and Raichu-Ras were immunoprecipitated by use of anti-Flag monoclonal antibody and anti-GFP antiserum, respectively. Guanine nucleotides bound to G proteins were separated by thin-layer chromatography, and quantitated with a BAS-1000 image analyzer. (B) Cells prepared as in (A) were lysed and clarified by centrifugation, and emission spectra at the excitation wavelength of 433 nm were obtained using a spectrometer. (C) Rap1 was analyzed as in (A). (D) Rap1 was analyzed as in (B). (E and F) Cos-1 cells expressing Raichu-RasV12 (E) or Raichu-Rap1V12 (F) were stimulated with EGF and imaged as in Figure 1A. The upper and lower panels demonstrate the ratio images and differential interference contrast images, respectively.
In quiescent cells expressing Raichu-RasV12, the emission ratio, YFP/CFP, was mostly uniform (Figure 5E). Upon EGF stimulation, the YFP/CFP ratio was increased diffusely and, in contrast to the cells expressing the wild-type Raichu-Ras (Figure 1A), there was no significant increase in emission ratio at the membrane ruffles. In Raichu-Rap1V12-expressing Cos-1 cells, the emission ratio was uniform and increased at the membrane ruffles upon EGF stimulation (Figure 5F). Again, this observation was in clear contrast to the activation pattern of the wild-type Raichu-Rap1 (Figure 1A). Taken together, these results indicated that GAP played a principal role in generating the gradients in the activity of Ras and Rap1.
To explore the subcellular localization of Ras and Rap1 activities further, tangential FRET images were obtained by two-photon excitation fluorescence microscopy (TPEM), which minimized photobleaching during z-axis scanning and thereby increased the fidelity of ratio data. As shown in Figure 6, Ras activity was most prominent at the peripheral plasma membrane, moderate at the plasma membranes over and below the nucleus, and very low at the endomembrane compartment. In the cells expressing Raichu-RasV12, the Ras activity was high throughout the plasma membrane. The activity of wild-type Rap1 was high at the endomembrane compartments and suppressed at the plasma membrane. In clear contrast, the activity of Rap1V12 was high at the plasma membrane and low at the endomembrane compartments. These observations also suggest a critical role for GAP in determining the activity gradient of Ras and Rap1. Alternatively, these observations may be explained if V12 mutants differ from the wild type in their subcellular localization. However, we ruled out this possibility by comparing the distribution of CFP-tagged V12 mutants and wild type (Supplementary figure 1) and by showing no correlation between the FRET efficiency and the concentration of the probe (Supplementary figure 2). Another possibility is that expression of Raichu-RasV12 or Raichu-Rap1V12 perturbed the endogenous signaling cascades; however, because the activated Ras or Rap1 should have been masked by the tethered Raf RBD, it is unlikely that these probes activated the downstream signal transduction cascades.

Fig. 6. Tangential FRET images of Ras and Rap1 activities. Cos-1 cells expressing monitor proteins indicated at the left were observed by two-photon excitation fluorescent microscopy. FRET efficiency of the yz-view is shown in the IMD mode.
Mapping of GAP activity in cells
To demonstrate the presence of an intracellular gradient of GAP activities, we mapped the level of GAP activity as below. First, we obtained the time course of the EGF-induced increase in the emission ratio along a line from the center to the edge of the cell (Figure 7A). Assuming that the increase in GAP activity was negligible during our observations and that the GEF activity was distributed homogeneously in the quiescent cells, the time course of Ras activation could be approximated by the first order rate equation (Figure 7B), and the half-life (t1/2) of this reaction was found to be ∼10 min (or 600 s). Then, the GTP ratios of Ras before and after stimulation could be expressed as kGEF/(kGAP + kGEF) and kGEF′/(kGAP + kGEF′), respectively, where kGEF′ denotes the rate constant of GEF after EGF stimulation [Equation (a) in Supplementary data]. Therefore, by determining the GTP ratio of Ras before and after EGF stimulation, we could express kGAP and kGEF′ as functions of kGEF, which was expressed by a constant k. This calculation was conducted using the data shown in Figure 7C, where the abscissas of the center and the edge of the cells were set as 0 and 1, respectively. By plotting kGEF′ and kGAP versus the distance from the nucleus, we found a bell-shaped increase in GAP activity toward the nucleus (Figure 7D). The difference in the GAP activity between the center and the edge of the cells was estimated as ∼6.7-fold. In clear contrast, EGF-induced GEF activity was only slightly higher in the center of the cells than at the periphery (Figure 7D). To validate the parameters obtained above, we assigned these values of t1/2, kGEF′ and kGAP to Equation (a), plotted graphs and compared them with the actual values. As shown in Figure 7E, we found that the actual time course of Ras activation was reproduced faithfully by the calculated ones at each region.

Fig. 7. Spatio-temporal analysis of GEF and GAP activities in Cos-1 cells. (A) Cos-1 cells expressing Raichu-Ras were stimulated with EGF and imaged as in Figure 1A. The collected digital images of YFP and CFP were used in the following analysis. First, a line from the center to the edge of the cell was drawn. Then, pixels on this line were divided into nine segments and grouped from purple to brown. Emission ratios of pixels in each segment were averaged and plotted against time. (B) The time course of Ras activation was approximated by the first order rate equation as described in the Supplementary data. The GTP ratios of Ras before and after stimulation are expressed as kGEF/(kGAP + kGEF) and kGEF′/(kGAP + kGEF′), respectively. kGAP, kGEF and kGEF′ denote rate constants of GAP and GEF before stimulation, and of GEF after EGF stimulation, respectively. (C) Five parallel lines were drawn as in (A). The emission ratio value of each pixel was converted to the GTP ratio on Ras as described in the Supplementary data, and plotted against the distance from the center of the cell. The abscissas of the center and the edge of the cells were assigned as 0 and 1, respectively. Blue and red circles indicate pre- and post-EGF stimulation, respectively. Closed circles are the average of the values of the five open circles, which correspond to the five lines. (D) kGAP (closed circles) and kGEF′ (open circles) were calculated at each pixel as a function of kGEF (k), which is assumed to be constant throughout the unstimulated cell. The data were fitted to bell-shaped curves by GraFit software. (E) The parameters obtained in (A) and (D) were assigned to Equation (a) in the Supplementary data to plot the Ras activity against time. Pixels on the five lines described in (C) were divided into five segments from the center to the periphery. The five colors, ranging from blue to red, indicate the grouping from the center to the periphery. The simulated time courses of the GTP ratio at each region are shown by the colored curves, and the actual values are shown by the colored dots.
We further extended this kinetic analysis to Rap1. GTP ratios before and after EGF stimulation were calculated from emission ratios and plotted against the distance from the center of the cell (Figure 8A). Rate constants, kGAP and kGEF′, were expressed as functions of kGEF (k) as already described (Figure 8B). In contrast to Ras, GAP activity was highest at the center and lowest at the periphery, whereas GEF activity after stimulation was almost constant throughout the cells. Notably, in the Golgi region shown as a shaded area in Figure 8, the GTP ratio was as low as in the peripheral region, although the GAP activity in this region was about half that of the peripheral region. This low Rap1 activation in the Golgi region was apparently due to the low GEF activity.
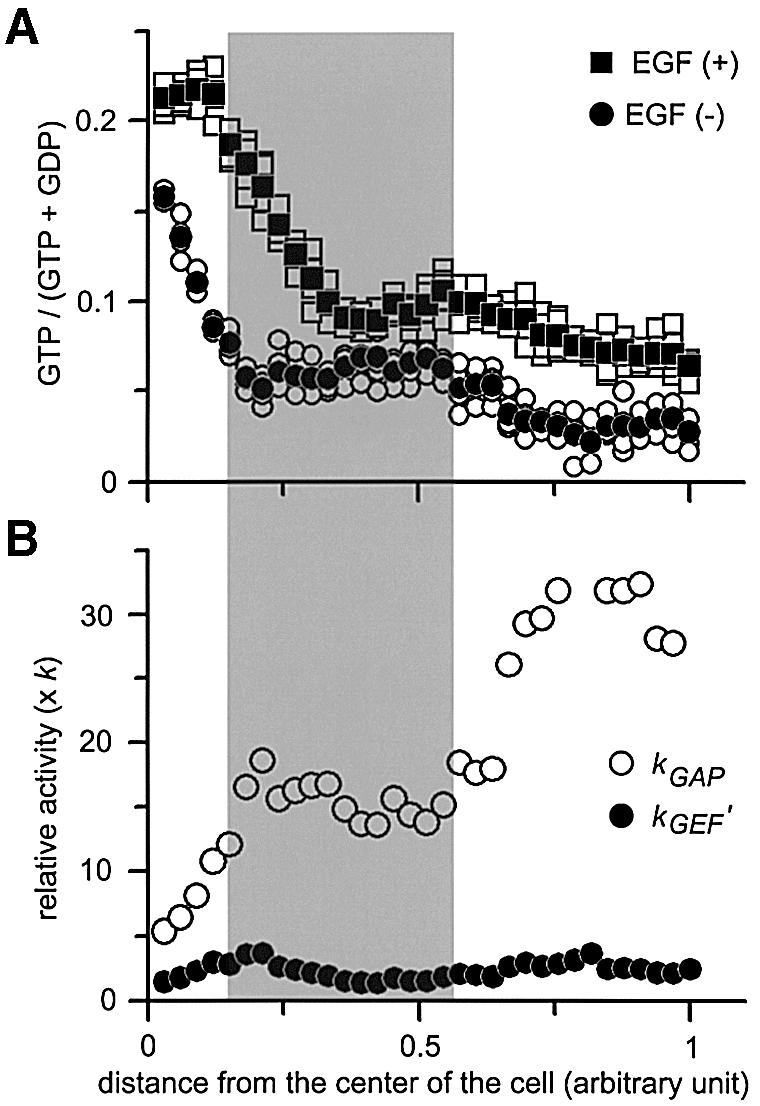
Fig. 8. Spatio-temporal analysis of GEF and GAP activities for Rap1 in Cos-1 cells. (A) GTP ratio along the five parallel lines (open symbols), and average values (closed symbols) were plotted before (circles) and after (squares) stimulation as in Figure 7C. (B) Calculated GEF activities (closed circles) and GAP activities (open circles) are plotted as in Figure 7D. In both panels, the shaded area corresponds to the Golgi apparatus.
In our previous report, we suggested that local activation of GAP by cell–cell contact may attenuate Ras activation (Mochizuki et al., 2001). Therefore, we compared the GAP activity between the free edge and the edge in contact with the other cell. The GTP ratios from the center to the free edge and from the center to the edge in contact with the neighboring cell (Figure 9A) were plotted before and after EGF stimulation (Figure 9B). From these data, GEF and GAP activities were plotted and fitted with bell-shaped curves (Figure 9C). As we suggested previously, the GAP activity at the edge in contact with the other cell was 1.5-fold higher than that at the free edge. In contrast, the difference in GEF activity between the two edges was not significant. Based on these findings, we propose that the local increase in the GAP activity by the cell–cell contact is responsible for the attenuated Ras activation in confluent cells.

Fig. 9. Spatio-temporal analysis of GEF and GAP activities in semi confluent Cos-1 cells. (A) Phase contrast (PC) and FRET images of a Raichu-expressing Cos-1 cell before and after EGF stimulation. The boundary of the cell is indicated with arrowheads. Emission data on the four colored lines are collected as described in Figure 7C. (B) GTP ratios along the line in (A) were plotted as described in Figure 7C. The color of each point corresponds to the color of the lines drawn in (A). (C) Calculated GEF activities (open symbols) and GAP activities (closed symbols) at the free edge (circles) and at the edge in contact with the neighboring cell (squares) are plotted as in Figure 7D.
Finally, to validate our simulation visually, we programmed a virtual cell which we named the ‘Raichu-cell’ (Supplementary figure 4 and data on our website, http://www-tv.biken.osaka-u.ac.jp/). To make this program, we assumed that the change in GAP activity was negligible during our observations, that the GEF activity was distributed homogeneously in the quiescent cells, and that the EGF-induced increase in GEF activity was very rapid. The spatial parameters were obtained from the data shown in Figure 7D. The activity of a Raichu-cell was expressed by eight hues in IMD mode. As shown in Figure 10, selected panels of the Raichu-cell satisfactorily reproduced the ratio images of the real cell.

Fig. 10. Raichu-cell: a simulation of EGF activation of Ras. A virtual cell, named a Raichu-cell, was programmed on Visual Basic 6.0 with parameters obtained in Figure 7. The upper and lower rows indicate the images of the Raichu-cell and the real Cos-1 cell, respectively. Both are demonstrated in IMD mode. The time points of the images are shown in the lower right corner (min).
Discussion
Does GEF generate the spatial gradient of Ras and Rap1 activities in EGF-stimulated cells?
When we observed the gradient of the Ras and Rap1 activities in EGF-stimulated cells, we assumed that it was caused by recruitment of GEFs to different subcellular domains. In support of this view, it is widely recognized that a GEF for Ras, Sos, translocates from the cytosol to the plasma membrane by binding to the activated EGFR via an adaptor protein Grb2 (reviewed by Downward, 1994). Moreover, the observation that EGF activation of Rap1 is suppressed by inhibitors of endocytosis (York et al., 2000; Mochizuki et al., 2001) supports the view that activated EGFR must move to the endomembrane to stimulate GEF(s) for Rap1. Further, we found that dominant-negative mutants of Cbl that inhibit EGF-dependent EGFR endocytosis (Lill et al., 2000) suppressed activation of Rap1 (Figure 1D–F).
However, the results obtained using various GEFs for Ras and/or Rap1 were not consistent with our expectations. First, cAMP-induced activation of Rap1 was restricted at the endomembrane around the nucleus despite the homogeneous localization of Epac in the cytoplasm. Considering the rapid diffusion of cAMP (Adams et al., 1991), it is unlikely that Epac was activated only at the endomembrane. Secondly, when we stimulated the cells expressing Epac-F, which localized diffusely at the plasma membrane and endomembrane via the C-terminal region of K-Ras (Choy et al., 1999), cAMP-induced Rap1 activation was still restricted in the perinuclear endomembrane of the cells. Thirdly, a newly engineered cAMP-responsive GEF, e-GRF, activated Ras mostly at the peripheral region of the cells, irrespective of its diffuse localization in the cytoplasm. Because the distributions of Epac and e-GRF were indistinguishable, the difference between the localization of the cAMP-induced activation of Ras and that of Rap1 does not appear to reflect the localization of GEFs. Finally, in the overexpression study, all GEFs for Ras activated Ras predominantly at the peripheral plasma membrane, whereas that for Rap1 did so at the central region of the cells. Most interestingly, CalDAG-GEFIII, which activates both Ras and Rap1 (Yamashita et al., 2000), induced activation of Ras primarily at the peripheral region and of Rap1 at the central region of the cells. This observation again strongly suggested that the activation of Ras and Rap1 was predetermined to occur at particular regions of the cells.
GAP regulation of the spatial activity of Ras
If not GEF, then GAP may be responsible for the spatial non-uniformity of the activity of Ras and Rap1. This possibility was indeed supported by our observation that the emission ratios of Raichu-RasV12 and Raichu-Rap1V12 increased more diffusely than did the emission ratios of the wild-type probes upon EGF stimulation (Figure 5). Because V12 mutation decreases the sensitivity of low molecular weight G proteins to their GAPs (Brinkmann et al., 2002), this observation suggests that GEF activity increases diffusely in the EGF-stimulated cells. Furthermore, spatio-temporal analysis of Ras and Rap1 activation revealed that Ras GAP activity was higher in the central region of the cells than at the periphery, whereas Rap1 GAP activity was higher at the periphery than in the central region. Regulators for GAPs may be responsible for this spatial non-uniformity of GAP activity, although little is known about the regulation of GAP activity. Alternatively, the distribution of GAPs may be restricted. To examine this possibility, we need to develop antibodies to all GAPs that could be applicable to the immunocytochemistry. Furthermore, it should also be pointed out that the close proximity of the effector to Ras/Rap1 within the probes reduces their sensitivity to GAPs, suggesting that there may be a time lag between the real and monitored GAP activities. Additional probes that monitor the spatial activity of GAPs should be developed to answer this question.
Role of the spatial gradient in Ras and Rap1 activity
The spatial gradient of Ras and Rap1 activity may explain some of the unresolved questions regarding Ras and Rap1. For example, Rap1 was originally identified as a suppressor of Ras-dependent transformation of Ras in NIH 3T3 cells (Kitayama et al., 1989), and is known to antagonize Ras-dependent activation of Raf (Cook et al., 1993), but its mechanism remains an enigma. The observation that the gradient of Rap1 activity is a mirror image of Ras activity suggests that the activity gradient of Ras effectors may be steeper than that of Ras. In addition to GAPs for Ras, quiescent cells may use Rap1 as a silencer to compartmentalize the Ras signaling away from the nucleus.
The function of Rap1 may change with its localization. Albeit that Rap1V12 is known to antagonize Ras, growth factor-induced activation of endogenous Rap1 is unable to interfere in the Ras-dependent activation of ERK (Zwartkruis et al., 1998). Because Rap1 is activated at the endomembrane in growth factor-stimulated cells, the Raf inhibition might occur when the level of GTP-Rap1 is high at the plasma membrane as in Rap1V12-expressing cells. Then, what if Rap1 is suppressed at the plasma membrane? We have shown that lysophosphatidic acid stimulation induces binding of rap1GAPII to Gαi, thereby suppressing Rap1 at the plasma membrane (Mochizuki et al., 1999). Importantly, this Rap1 suppression is necessary for ERK activation by lysophosphatidic acid. More recently, it has been demonstrated that Rap1 is activated at the plasma membrane of ephrin-B1-stimulated human aortic endothelial cells (Nagashima et al., 2002) and that ephrin-B1 suppresses ERK activity (Elowe et al., 2001). Based on these observations, we propose that Rap1 activity at the plasma membrane, but not at the endomembrane, suppresses Ras-dependent activation of the Raf–ERK pathway.
Another example that argues for the importance of localization of Rap1 activity is the activation of RalGDS, a Ral GEF with a Ras/Rap1-binding domain. In platelets, activation of Ral correlates with the activation of Rap1, but not of Ras (Wolthuis et al., 1998). However, in fibroblasts, Rap1 activated by 12-O-tetradecanolphorbol-13-acetate (TPA) or cAMP does not activate Ral (Zwartkruis et al., 1998). Because constitutively active Rap1 can activate Ral in fibroblasts (Zwartkruis et al., 1998), it seems that Rap1 is able to activate RalGDS at the plasma membrane, but not at the endomembrane compartments. In this context, it would be interesting to examine whether Rap1 is activated at the plasma membrane of platelets.
The non-uniformity in Ras activity may also be used to maintain cell polarity. We have shown that GAP activity to Ras was higher at the site of cell–cell contact. This observation agrees with previous reports that Ras GAP activity is higher in confluent BALB/c 3T3 cells than in non-confluent cells (Hoshino et al., 1988), and further showed that GAP activity is increased locally by the adhesion signals.
Although we have shown that GEF activity increased diffusely in the cells, this does not necessarily preclude the possibility that GEFs also contribute to form the gradient of Ras activity. In the present study, cells were subjected to bath application of EGF; however, in most physiological milieus, EGF concentration must have a gradient around the cells. Hence, in vivo, the GEF activity may also have a gradient, which in turn causes localized activation of Ras. Indeed, we have recently reported that local EGF stimulation results in localized tyrosine phosphorylation and Ras activation (Sawano et al., 2002). Therefore, both GEFs and GAPs appear to be used to transmit directional information to the cells in vivo.
Simulation of Ras activation
There is a rising tide of studies simulating cellular processes in silico. Cellular processes including EGF-dependent ERK activation in HeLa cells (Schoeberl et al., 2002) and NGF-dependent activation in PC12 cells (Brightman and Fell, 2000) have been simulated by the use of programs such as GEPASI (Mendes, 1997) or Matlab (Schoeberl et al., 2002). However, in most studies, the parameters are derived from in vitro biochemical data, and spatial parameters are completely neglected. Only recently, Ran transport between the nucleus and cytosol has been simulated by use of Virtual Cell (Schaff et al., 2000; Smith et al., 2002). In this regard, our Raichu-cell is the first simulation that mimics the spatial and temporal changes in the activity of intracellular enzymes.
Needless to say, our Raichu-cell will require extensive improvements in the future. For example, the calibration of the emission ratio of Raichu probes to GTP (%) must be performed in individual cells. It has been achieved successfully for the FRET-based calcium sensor, cameleon (Miyawaki and Tsien, 2000). In contrast to calcium, we cannot control the GTP/GDP level on Ras in intact or semi-intact cells. Microinjection of GAP or GEF may resolve this problem. Moreover, the downregulation of GEFs and translocation of GAP to the receptors, which were neglected in this study, should be integrated into the program. Nevertheless, the complexity of the Ras signaling network is clearly beyond our understanding; accordingly, we should make every effort to accumulate information on the spatio-temporal regulation of Ras family G proteins and to develop a simulation program to integrate such information.
Materials and methods
Detailed information on the plasmids, analysis of cell images and the processes for the kinetic analysis of Ras activities are provided as Supplementary data.
Cell culture and transfection
Cos-1 cells, Rat1a cells and 293T cells were cultured in Dulbecco’s modified Eagle’s medium (DMEM) (Sigma, St Louis, MO) supplemented with 10% fetal calf serum. Expression plasmids were introduced into Cos-1 cells and Rat1a cells by the use of Polyfect (Qiagen, Valencia, CA) according to the manufacturer’s protocol, and into 293T cells by the calcium phosphate co-precipitation method.
Antibodies and reagents
Anti-Rap1 polyclonal antibody, anti-pan-Ras monoclonal antibody, anti-Flag M2 monoclonal antibody, anti-hemagglutinin (HA) monoclonal antibody and Alexa488 goat anti-mouse antibody were purchased from Santa Cruz Biotechnology (Santa Cruz, CA), Oncogene Research (Cambridge, MA), Sigma, Roche (Basel, Switzerland) and Molecular Probes (Leiden, The Netherlands), respectively. EGF, MDC, forskolin, IBMX and Sp-cAMPS triethylamine were obtained from Sigma.
In vitro analysis of G protein activation
Quantification of guanine nucleotides bound to the G proteins was performed as described previously (Gotoh et al., 1999). GTP-bound G proteins were detected by Bos’ pull-down method with slight modification (Franke et al., 1997; Ohba et al., 2001). In vitro spectrometry was performed as described previously (Mochizuki et al., 2001).
Imaging
Cells were imaged with an IX70 inverted microscope (Olympus, Tokyo, Japan) equipped with BioPoint MAC5000 excitation and emission filter wheels (Ludl Electronic Products Ltd, Hawthorne, NY) and a Cool SNAP-HQ cooled CCD camera (Roper Scientific, Trenton, NJ) as described previously (Mochizuki et al., 2001). Filters used for the dual-emission ratio imaging were purchased from Omega Optical Inc. (Brattleboro, VT): an XF1071 (440AF21) excitation filter, an XF2034 (455DRLP) dichroic mirror and two emission filters, XF3075 (480AF30) for ECFP and XF3079 (535AF26) for EYFP. Cells were illuminated with a 75 W xenon lamp through a 6% ND filter. Exposure times for 2 × 2 binning were 0.5 s to obtain images of ECFP and EYFP, and 30 ms to differential interference contrast image. MetaMorph software (Universal Image, West Chester, PA) was used for control of the CCD camera and filter wheels, and also for the analysis of the cell image data.
Cos-1 cells plated on a collagen-coated 35 mm diameter glass base dish (Asahi Techno Glass Co., Tokyo, Japan) were transfected with pRaichu vectors. After 24 h, cells were serum starved for 4 h and placed in a chamber box on a microscope, in which the temperature and CO2 concentration were maintained at 37°C and 5%, respectively. A differential interference contrast image and fluorescent images of ECFP and EYFP were recorded every 30 s. Starting from 10 min, cells were stimulated with 50 ng/ml EGF, 100 µM Sp-cAMPS, or 50 µM forskolin and 100 µM IBMX. In some experiments, cells were pre-treated with 20 µM MDC for 30 min before growth factor stimulation.
Immunofluorescence microscopy was performed as described previously (Ohba et al., 2000a), except that an FV-300 confocal microscope (Olympus) was used. To obtain tangential FRET images, Cos-1 cells expressing Raichu probes were observed with an Olympus FV-500 multi-photon excitation microscope (Olympus Optical Co., Tokyo, Japan) equipped with external photomultiplier tubes, an argon laser, a He:Ne laser and a MAITAI Ti:sapphire laser (Spectra Physics, Mountain View, CA). The MAITAI laser was capable of generating >100 fs pulses at a repetition rate of 80 MHz. The output wavelength was tunable from 780 to 920 nm. The output laser beam, with a power of >0.7 W, was polarized horizontally. The excitation wavelength for the TPEM was 790 nm as described previously (Fan et al., 1999). For the FRET imaging, we used an IR-cut filter, RDM650 (Olympus Optical Co.), a dichroic mirror, DM505 (Olympus Optical Co.), and two emission filters, 480AF30 for CFP and 535AF26 for YFP (Omega Optical Inc., Brattleboro, VT). For the conventional confocal imaging with the argon laser, we used two dichroic mirrors, DM458/515 and SDM 515, and two emission filters, BA480-495 for CFP and BA535-565 for YFP (Olympus Optical Co.).
Supplementary data
Supplementary data are available at The EMBO Journal Online.
Acknowledgments
Acknowledgements
We thank A.Wittinghofer, J.L.Bos, L.Feig, S.Hattori, H.Kitayama, K.Kaibuchi, H.Band, A.Miyawaki, N.Mochizuki and M.Noda for their provision of materials and helpful suggestions, and T.Nakamura, R.Itoh, H.Yoshizaki, N.Yoshida, N.Fujimoto and Y.Matsuura for their technical assistance. This work was supported by grants from the Human Frontier Science Program (to M.M.), from The Sagawa Foundation for Promotion of Cancer Research (Y.O.) and from the Charitable Trust Oosaka Cancer Researcher Fund (Y.O.).
References
- Adams S.R., Harootunian,A.T., Buechler,Y.J., Taylor,S.S. and Tsien,R.Y. (1991) Fluorescence ratio imaging of cyclic AMP in single cells. Nature, 349, 694–697. [DOI] [PubMed] [Google Scholar]
- Altschuler D.L. and Ribeiro-Neto,F. (1998) Mitogenic and oncogenic properties of the small G protein Rap1b. Proc. Natl Acad. Sci. USA, 95, 7475–7479. [DOI] [PMC free article] [PubMed] [Google Scholar]
- Bos J.L. (1997) Ras-like GTPases. Biochim. Biophys. Acta, 1333, M19–M31. [DOI] [PubMed] [Google Scholar]
- Bourne H.R., Sanders,D.A. and McCormick,F. (1990) The GTPase superfamily: a conserved switch for diverse cell functions. Nature, 348, 125–132. [DOI] [PubMed] [Google Scholar]
- Brightman F.A. and Fell,D.A. (2000) Differential feedback regulation of the MAPK cascade underlies the quantitative differences in EGF and NGF signalling in PC12 cells. FEBS Lett., 482, 169–174. [DOI] [PubMed] [Google Scholar]
- Brinkmann T., Daumke,O., Herbrand,U., Kuhlmann,D., Stege,P., Ahmadian,M.R. and Wittinghofer,A. (2002) Rap-specific GTPase activating protein follows an alternative mechanism. J. Biol. Chem., 277, 12525–12531. [DOI] [PubMed] [Google Scholar]
- Campbell S.L., Khosravi-Far,R., Rossman,K.L., Clark,G.J. and Der,C.J. (1998) Increasing complexity of Ras signaling. Oncogene, 17, 1395–1413. [DOI] [PubMed] [Google Scholar]
- Choy E., Chiu,V.K., Silletti,J., Feoktistov,M., Morimoto,T., Michaelson,D., Ivanov,I.E. and Philips,M.R. (1999) Endomembrane trafficking of ras: the CAAX motif targets proteins to the ER and Golgi. Cell, 98, 69–80. [DOI] [PubMed] [Google Scholar]
- Cook S.J., Rubinfeld,B., Albert,I. and McCormick,F. (1993) RapV12 antagonizes Ras-dependent activation of ERK1 and ERK2 by LPA and EGF in Rat-1 fibroblasts. EMBO J., 12, 3475–3485. [DOI] [PMC free article] [PubMed] [Google Scholar]
- Downward J. (1992) Regulation of p21ras by GTPase activating proteins and guanine nucleotide exchange proteins. Curr. Opin. Genet. Dev., 2, 13–18. [DOI] [PubMed] [Google Scholar]
- Downward J. (1994) The GRB2/Sem-5 adaptor protein. FEBS Lett., 338, 113–117. [DOI] [PubMed] [Google Scholar]
- Elowe S., Holland,S.J., Kulkarni,S. and Pawson,T. (2001) Down regulation of the Ras-mitogen-activated protein kinase pathway by the EphB2 receptor tyrosine kinase is required for ephrin-induced neurite retraction. Mol. Cell. Biol., 21, 7429–7441. [DOI] [PMC free article] [PubMed] [Google Scholar]
- Fan G.Y., Fujisaki,H., Miyawaki,A., Tsay,R.K., Tsien,R.Y. and Ellisman,M.H. (1999) Video-rate scanning two-photon excitation fluorescence microscopy and ratio imaging with cameleons. Biophys. J., 76, 2412–2420. [DOI] [PMC free article] [PubMed] [Google Scholar]
- Franke B., Akkerman,J.W. and Bos,J.L. (1997) Rapid Ca2+-mediated activation of Rap1 in human platelets. EMBO J., 16, 252–259. [DOI] [PMC free article] [PubMed] [Google Scholar]
- Furth M.E., Davis,L.J., Fleurdelys,B. and Scolnick,E.M. (1982) Monoclonal antibodies to the p21 products of the transforming gene of Harvey murine sarcoma virus and of the cellular ras gene family. J. Virol., 43, 294–304. [DOI] [PMC free article] [PubMed] [Google Scholar]
- Gotoh I., Fukuda,M., Adachi,M. and Nishida,E. (1999) Control of the cell morphology and the S phase entry by mitogen-activated protein kinase kinase. A regulatory role of its N-terminal region. J. Biol. Chem., 274, 11874–11880. [DOI] [PubMed] [Google Scholar]
- Grewal S.S., York,R.D. and Stork,P.J. (1999) Extracellular-signal-regulated kinase signalling in neurons. Curr. Opin. Neurobiol., 9, 544–553. [DOI] [PubMed] [Google Scholar]
- Hoshino M., Kawakita,M. and Hattori,S. (1988) Characterization of a factor that stimulates hydrolysis of GTP bound to ras gene product p21 (GTPase-activating protein) and correlation of its activity to cell density. Mol. Cell. Biol., 8, 4169–4173. [DOI] [PMC free article] [PubMed] [Google Scholar]
- Hu C.D., Kariya,K., Kotani,G., Shirouzu,M., Yokoyama,S. and Kataoka,T. (1997) Coassociation of Rap1A and Ha-Ras with Raf-1 N-terminal region interferes with ras-dependent activation of Raf-1. J. Biol. Chem., 272, 11702–11705. [DOI] [PubMed] [Google Scholar]
- Katagiri K., Hattori,M., Minato,N., Irie,S., Takatsu,K. and Kinashi,T. (2000) Rap1 is a potent activation signal for leukocyte function-associated antigen 1 distinct from protein kinase C and phosphatidylinositol-3-OH kinase. Mol. Cell. Biol., 20, 1956–1969. [DOI] [PMC free article] [PubMed] [Google Scholar]
- Kitayama H., Sugimoto,Y., Matsuzaki,T., Ikawa,Y. and Noda,M. (1989) A ras-related gene with transformation suppressor activity. Cell, 56, 77–84. [DOI] [PubMed] [Google Scholar]
- Lill N.L., Douillard,P., Awwad,R.A., Ota,S., Lupher,M.L.,Jr, Miyake,S., Meissner-Lula,N., Hsu,V.W. and Band,H. (2000) The evolutionarily conserved N-terminal region of Cbl is sufficient to enhance down-regulation of the epidermal growth factor receptor. J. Biol. Chem., 275, 367–377. [DOI] [PubMed] [Google Scholar]
- Maruta H., Holden,J., Sizeland,A. and D’Abaco,G. (1991) The residues of Ras and Rap proteins that determine their GAP specificities. J. Biol. Chem., 266, 11661–11668. [PubMed] [Google Scholar]
- Matsubara K., Kishida,S., Matsuura,Y., Kitayama,H., Noda,M. and Kikuchi,A. (1999) Plasma membrane recruitment of RalGDS is critical for Ras-dependent Ral activation. Oncogene, 18, 1303–1312. [DOI] [PubMed] [Google Scholar]
- Mendes P. (1997) Biochemistry by numbers: simulation of biochemical pathways with Gepasi 3. Trends Biochem. Sci., 22, 361–363. [DOI] [PubMed] [Google Scholar]
- Miyawaki A. and Tsien,R.Y. (2000) Monitoring protein conformations and interactions by fluorescence resonance energy transfer between mutants of green fluorescent protein. Methods Enzymol., 327, 472–500. [DOI] [PubMed] [Google Scholar]
- Mochizuki N., Ohba,Y., Kiyokawa,E., Kurata,T., Murakami,T., Ozaki,T., Kitabatake,A., Nagashima,K. and Matsuda,M. (1999) Activation of the ERK/MAPK pathway by an isoform of rap1GAP associated with Gα(i). Nature, 400, 891–894. [DOI] [PubMed] [Google Scholar]
- Mochizuki N., Yamashita,S., Kurokawa,K., Ohba,Y., Nagai,T., Miyawaki,A. and Matsuda,M. (2001) Spatio-temporal images of growth-factor-induced activation of Ras and Rap1. Nature, 411, 1065–1068. [DOI] [PubMed] [Google Scholar]
- Nagashima K.I., Endo,A., Ogita,H., Kawana,A., Yamagishi,A., Kitabatake,A., Matsuda,M. and Mochizuki,N. (2002) Adaptor protein Crk is required for ephrin-B1-induced membrane ruffling and focal complex assembly of human aortic endothelial cells. Mol. Biol. Cell, 13, 4231–4242. [DOI] [PMC free article] [PubMed] [Google Scholar]
- Ohba Y. et al. (2000a) Rap2 as a slowly responding molecular switch in the rap1 signaling cascade. Mol. Cell. Biol., 20, 6074–6083. [DOI] [PMC free article] [PubMed] [Google Scholar]
- Ohba Y., Mochizuki,N., Yamashita,S., Chan,A.M., Schrader,J.W., Hattori,S., Nagashima,K. and Matsuda,M. (2000b) Regulatory proteins of R-Ras, TC21/R-Ras2 and M-Ras/R-Ras3. J. Biol. Chem., 275, 20020–20026. [DOI] [PubMed] [Google Scholar]
- Ohba Y. et al. (2001) Requirement for C3G-dependent Rap1 activation for cell adhesion and embryogenesis. EMBO J., 20, 3333–3341. [DOI] [PMC free article] [PubMed] [Google Scholar]
- Okada T., Hu,C.D., Jin,T.G., Kariya,K., Yamawaki-Kataoka,Y. and Kataoka,T. (1999) The strength of interaction at the Raf cysteine-rich domain is a critical determinant of response of Raf to Ras family small GTPases. Mol. Cell. Biol., 19, 6057–6064. [DOI] [PMC free article] [PubMed] [Google Scholar]
- Pizon V., Desjardins,M., Bucci,C., Parton,R.G. and Zerial,M. (1994) Association of Rap1a and Rap1b proteins with late endocytic/phagocytic compartments and Rap2a with the Golgi complex. J. Cell Sci., 107, 1661–1670. [DOI] [PubMed] [Google Scholar]
- Posern G., Weber,C.K., Rapp,U.R. and Feller,S.M. (1998) Activity of Rap1 is regulated by bombesin, cell adhesion and cell density in NIH3T3 fibroblasts. J. Biol. Chem., 273, 24297–24300. [DOI] [PubMed] [Google Scholar]
- Ray E. and Samanta,A.K. (1996) Dansyl cadaverine regulates ligand induced endocytosis of interleukin-8 receptor in human poly morphonuclear neutrophils. FEBS Lett., 378, 235–239. [DOI] [PubMed] [Google Scholar]
- Reedquist K.A., Ross,E., Koop,E.A., Wolthuis,R.M., Zwartkruis,F.J., van Kooyk,Y., Salmon,M., Buckley,C.D. and Bos,J.L. (2000) The small GTPase, rap1, mediates CD31-induced integrin adhesion. J. Cell Biol., 148, 1151–1158. [DOI] [PMC free article] [PubMed] [Google Scholar]
- Sawano A., Takayama,S., Matsuda,M. and Miyawaki,A. (2002) Lateral propagation of EGF signaling after local stimulation is dependent on receptor density. Dev. Cell, 3, 245–257. [DOI] [PubMed] [Google Scholar]
- Schaff J.C., Slepchenko,B.M. and Loew,L.M. (2000) Physiological modeling with virtual cell framework. Methods Enzymol., 321, 1–23. [DOI] [PubMed] [Google Scholar]
- Scheffzek K., Ahmadian,M.R., Kabsch,W., Wiesmuller,L., Lautwein,A., Schmitz,F. and Wittinghofer,A. (1997) The Ras–RasGAP complex: structural basis for GTPase activation and its loss in oncogenic Ras mutants. Science, 277, 333–338. [DOI] [PubMed] [Google Scholar]
- Schlegel R., Dickson,R.B., Willingham,M.C. and Pastan,I.H. (1982) Amantadine and dansylcadaverine inhibit vesicular stomatitis virus uptake and receptor-mediated endocytosis of α2-macroglobulin. Proc. Natl Acad. Sci. USA, 79, 2291–2295. [DOI] [PMC free article] [PubMed] [Google Scholar]
- Schoeberl B., Eichler-Jonsson,C., Gilles,E.D. and Muller,G. (2002) Computational modeling of the dynamics of the MAP kinase cascade activated by surface and internalized EGF receptors. Nat. Biotechnol., 20, 370–375. [DOI] [PubMed] [Google Scholar]
- Schutze S., Machleidt,T., Adam,D., Schwandner,R., Wiegmann,K., Kruse,M.L., Heinrich,M., Wickel,M. and Kronke,M. (1999) Inhibition of receptor internalization by monodansylcadaverine selectively blocks p55 tumor necrosis factor receptor death domain signaling. J. Biol. Chem., 274, 10203–10212. [DOI] [PubMed] [Google Scholar]
- Smith A.E., Slepchenko,B.M., Schaff,J.C., Loew,L.M. and Macara,I.G. (2002) Systems analysis of Ran transport. Science, 295, 488–491. [DOI] [PubMed] [Google Scholar]
- Tsien R.Y. and Miyawaki,A. (1998) Seeing the machinery of live cells. Science, 280, 1954–1955. [DOI] [PubMed] [Google Scholar]
- Tsukamoto N., Hattori,M., Yang,H., Bos,J.L. and Minato,N. (1999) Rap1 GTPase-activating protein SPA-1 negatively regulates cell adhesion. J. Biol. Chem., 274, 18463–18469. [DOI] [PubMed] [Google Scholar]
- Vetter I.R. and Wittinghofer,A. (2001) The guanine nucleotide-binding switch in three dimensions. Science, 294, 1299–1304. [DOI] [PubMed] [Google Scholar]
- Vossler M.R., Yao,H., York,R.D., Pan,M.G., Rim,C.S. and Stork,P.J. (1997) cAMP activates MAP kinase and Elk-1 through a B-Raf- and Rap1-dependent pathway. Cell, 89, 73–82. [DOI] [PubMed] [Google Scholar]
- Wolthuis R.M., Franke,B., van Triest,M., Bauer,B., Cool,R.H., Camonis,J.H., Akkerman,J.W. and Bos,J.L. (1998) Activation of the small GTPase Ral in platelets. Mol. Cell. Biol., 18, 2486–2491. [DOI] [PMC free article] [PubMed] [Google Scholar]
- Yamashita S., Mochizuki,N., Ohba,Y., Tobiume,M., Okada,Y., Sawa,H., Nagashima,K. and Matsuda,M. (2000) CalDAG-GEFIII activation of Ras, R-Ras and Rap1. J. Biol. Chem., 275, 25488–25493. [DOI] [PubMed] [Google Scholar]
- York R.D., Yao,H., Dillon,T., Ellig,C.L., Eckert,S.P., McCleskey,E.W. and Stork,P.J. (1998) Rap1 mediates sustained MAP kinase activation induced by nerve growth factor. Nature, 392, 622–626. [DOI] [PubMed] [Google Scholar]
- York R.D., Molliver,D.C., Grewal,S.S., Stenberg,P.E., McCleskey,E.W. and Stork,P.J. (2000) Role of phosphoinositide 3-kinase and endocytosis in nerve growth factor-induced extracellular signal-regulated kinase activation via Ras and Rap1. Mol. Cell. Biol., 20, 8069–8083. [DOI] [PMC free article] [PubMed] [Google Scholar]
- Yoshida Y., Kawata,M., Miura,Y., Musha,T., Sasaki,T., Kikuchi,A. and Takai,Y. (1992) Microinjection of smg/rap1/Krev-1 p21 into Swiss 3T3 cells induces DNA synthesis and morphological changes. Mol. Cell. Biol., 12, 3407–3414. [DOI] [PMC free article] [PubMed] [Google Scholar]
- Zwartkruis F.J. and Bos,J.L. (1999) Ras and rap1: two highly related small GTPases with distinct function. Exp. Cell Res., 253, 157–165. [DOI] [PubMed] [Google Scholar]
- Zwartkruis F.J., Wolthuis,R.M., Nabben,N.M., Franke,B. and Bos,J.L. (1998) Extracellular signal-regulated activation of Rap1 fails to interfere in Ras effector signalling. EMBO J., 17, 5905–5912. [DOI] [PMC free article] [PubMed] [Google Scholar]