

Abstract
The MinC protein directs placement of the division septum to the middle of Escherichia coli cells by blocking assembly of the division apparatus at other sites. MinD and MinE regulate MinC activity by modulating its cellular location in a unique fashion. MinD recruits MinC to the membrane, and MinE induces MinC/MinD to oscillate rapidly between the membrane of opposite cell halves. Using fixed cells, we previously found that a MinE–green fluorescent protein fusion accumulated in an annular structure at or near the midcell, as well as along the membrane on only one side of the ring. Here we show that in living cells, MinE undergoes a rapid localization cycle that appears coupled to MinD oscillation. The results show that MinE is not a fixed marker for septal ring assembly. Rather, they support a model in which MinE stimulates the removal of MinD from the membrane in a wave-like fashion. These waves run from a midcell position towards the poles in an alternating sequence such that the time-averaged concentration of division inhibitor is lowest at midcell.
Keywords: cytokinesis/FtsZ/MinC/MinD/oscillation
Introduction
Cell division in prokaryotes initiates by assembly of the tubulin-like GTPase FtsZ in a polymeric ring just underneath the cytoplasmic membrane. Other essential division proteins are then recruited to this Z-ring to form the mature septal ring apparatus, which mediates cell wall invagination. Assembly of the Z-ring and, hence, formation of the division septum usually occurs accurately at the midpoint of the long axis of the cell. In Escherichia coli, the positioning of the Z-ring is controlled by two partially redundant, negative regulatory systems that prevent Z-ring formation at any membrane site other than the proper one at midcell (Lutkenhaus and Addinall, 1997; Rothfield et al., 1999; Margolin, 2000).
The first system is called nucleoid occlusion and its existence is based on cytological evidence indicating that FtsZ preferentially assembles on those portions of the membrane that do not directly surround a dense nucleoid mass (Mulder and Woldringh, 1989; Woldringh et al., 1991; Yu and Margolin, 1999). However, exactly what inhibits FtsZ assembly in close proximity to the nucleoid(s) is not clear.
The second system controls placement of the septum through the activities of the products of the minB operon, MinC, MinD and MinE (de Boer et al., 1989). MinC is a division inhibitor that blocks Z-ring formation in vivo and is capable of interfering with FtsZ polymerization in vitro (de Boer et al., 1990; Bi and Lutkenhaus, 1993; Hu et al., 1999; Hu and Lutkenhaus, 2000). MinD is an ATPase that associates peripherally with the cytoplasmic membrane (de Boer et al., 1991). It binds MinC directly and one of its roles is as an activator of MinC function (Huang et al., 1996; Hu and Lutkenhaus, 2000). Normally, inhibition of Z-ring formation by MinC is strictly dependent on MinD, and only when MinC is overexpressed >25-fold is this dependency relieved (de Boer et al., 1990). Recent studies have shown that MinD recruits MinC to the membrane (Hu and Lutkenhaus, 1999; Marston and Errington, 1999; Raskin and de Boer, 1999a), suggesting that MinD stimulates MinC by concentrating it near its presumed site of action. In the absence of either protein, cells display the classical minicell phenotype (Min–) where they frequently divide near either one of the cell poles, leading to mixed progeny consisting of small spherical chromosome-less minicells and multinucleoid rods that are longer than normal (de Boer et al., 1989; Marston and Errington, 1999).
MinE provides topological specificity to the division inhibitor. Its expression results in a site-specific suppression of MinC/MinD action such that FtsZ assembly is allowed at the middle of the cell but still blocked at any other site (de Boer et al., 1989). Recent sublocalization studies have provided a credible explanation for how MinE specifically prevents MinC/MinD action at midcell by revealing that MinE affects the cellular localization of MinC/MinD in a unique and intriguing manner. In the absence of MinE, MinC/MinD is distributed homogeneously over the entire membrane, resulting in a complete block of Z-ring formation and the consequent formation of long filamentous cells that fail to divide (Hu and Lutkenhaus, 1999; Raskin and de Boer, 1999a,b; Rowland et al., 2000). However, expression of MinE imposes upon MinD a rapid oscillatory localization cycle in which the latter alternately accumulates on the membrane of either cell half (Raskin and de Boer, 1999b). As MinD dictates the location of MinC, the latter oscillates along, resulting in a situation where the concentration of the division inhibitor at the membrane on either cell end alternates between high and very low every other 20 s or so (Hu and Lutkenhaus, 1999; Raskin and de Boer, 1999a).
MinE is not only required for MinC/MinD oscillation, but is also involved in setting the frequency of the oscillation cycle (Raskin and de Boer, 1999b). Cells in which this frequency is too low are Min–, presumably because the interval in which MinC is absent from either one of the cell poles is sufficiently long for FtsZ to assemble undisturbed into a stable ring structure. Interestingly, changes in the cellular MinD/MinE ratio significantly affect this frequency in an inversely related manner. When the concentration of MinD was increased 5- to 10-fold in wild-type cells, the average oscillation cycle time of the protein increased ∼6-fold and the cells displayed a Min– phenotype. Both the oscillation frequency and the division pattern could be restored to wild-type by co-overexpression of MinE, presumably through restoration of the MinD/MinE ratio to a physiologically acceptable level (Raskin and de Boer, 1999b).
Cells expressing functional MinE–green fluorescent protein (GFP) showed two different fluorescent signals. The bulk of MinE–GFP accumulated in a membrane-associated ring-like structure, which we termed the MinE ring (E-ring). In addition to this ring, most cells also showed a weaker signal along part of their periphery. Interestingly, this peripheral extra-annular (PEA) signal was not present on the entire membrane, but was restricted to the membrane on only one side of the E-ring (Raskin and de Boer, 1997; Rowland et al., 2000).
Observation of the E-ring in live cells that had been grown in rich medium was impeded by instability of the structure during microscopy. Typically, the ring dissipated and MinE–GFP became permanently dispersed throughout the cell only a few seconds after cells settled down on the surface of the microscope slide. Chemical fixation prior to microscopy preserved the ring in about half the cell population and allowed further analyses. These showed that the E-ring was present at or near the midcell within the central two-fifths portion of virtually all cells in which the structure had been preserved. The localization of MinE–GFP provided support for the idea that MinE creates a zone of MinC/MinD-suppressing activity around the center of the cell, allowing Z-ring assembly specifically at midcell. In accordance with this model, the E-ring forms independently of the Z-ring and is already present in very young cells (Raskin and de Boer, 1997).
Whereas MinC is dispensable for E-ring formation, MinE–GFP is randomly distributed throughout the cytoplasm of MinD– cells (Raskin and de Boer, 1997). Thus, while MinE is required for segregation/oscillation of MinD, MinD is required for the accumulation of MinE in the membrane-associated ring and asymmetric PEA pattern. How the two proteins determine each others’ distinct cellular behavior is an unsolved question. Here we used experimental conditions permitting us to follow the distribution of functional MinE–GFP in live cells for up to several minutes. We show that, like MinC and MinD, the distribution of MinE–GFP is, in fact, highly dynamic. Thus, MinE undergoes a rapid localization cycle during which the bulk of the protein assembles into a ring near midcell, which moves towards a cell pole where it dissipates. Next, a new ring assembles near midcell again and then moves to the opposite pole.
Several lines of evidence indicate that the MinE localization cycle is tightly coupled to the oscillation cycle of MinD, that the PEA signal corresponds to the location of MinD and that the ring corresponds to a preferential accumulation of MinE at or near the dynamic border between the two portions of the cell membrane that either contain or lack the MinD protein. These new observations provide important insights into the possible role(s) of the MinE protein in the mechanism of MinC/MinD oscillation. Specifically, they suggest a role for MinE in stimulating MinD disassembly in a wave-like fashion. These waves start at a position at or near midcell and travel towards the poles in an alternating sequence, thereby sweeping the middle of the cell free of MinC/MinD. In addition, by obviating the need for a mechanism that fixes the E-ring at midcell, these results suggest a straightforward mechanism of Min-mediated division site selection in which the topological cue for septal ring assembly is provided directly by the time-averaged concentration of MinC along the membrane. Since this concentration of the inhibitor is lowest at midcell, this is also the site where FtsZ is capable of forming a stable ring structure with least interference.
Results
Functionality of genetic constructs
Plasmids used in this study are indicated in Figure 1. Plasmid pDB175 [Plac:: minD, minE] is a derivative of pMLB1113 and carries the native minD and minE genes downstream of the lac promoter (de Boer et al., 1989). The other plasmids are identical to pDB175, except that they encode derivatives of MinD and/or MinE that are fused to either GFP or a blue variant thereof (BFP). We previously used pDR112 [Plac:: minD, minE-gfp] and pDR122 [Plac:: gfp-minD, minE] to study the cellular location of MinE and MinD, respectively (Raskin and de Boer, 1997, 1999b).

Fig. 1. Genetic constructs. (A) Physical map of the minB operon (de Boer et al., 1989). (B) Portion of the chromosome deleted in strain HL1. (C) Plasmids used in this study. Indicated are the inserts that were placed downstream of the lac promotor region (Plac) of the vector. Plasmid pDB175 encodes native MinD (270 amino acids) and MinE (88 amino acids). The others encode fusions of full-length MinD and/or MinE (amino acids 1–87) to either GFP or BFP, as indicated. GFP or BFP are joined either to the N-terminus of full-length MinD with the linker peptide ASMTGGQQMGRIRIH, or to residue 87 of MinE with the peptide EDPPAEF.
In order to test the functionality of the plasmids conveniently, we created strain HL1 [ΔminDE zcf117:: Tn10 recA::cat]. While the minC gene in HL1 is intact, both minD and minE have been deleted from the chromosome, resulting in a classical minicell division phenotype (Min–). Plasmids were introduced into HL1 and the division phenotypes of the resulting transformants were determined after growth of the cells in the presence of a range of isopropyl-β-d-thiogalactopyranoside (IPTG) concentrations (Table I).
Table I. Division phenotypes.
| Plasmid [genotype] | Cells | Septa | Polar | % polar | Phenotype |
|---|---|---|---|---|---|
| pMLB1113ΔH3 [Plac::lacZ*] | 557 | 118 | 57 | 48 | Min– |
| pDB175 [Plac::minD, minE] | 802 | 173 | 5 | 3 | WT |
| pDR112 [Plac::minD, minE-gfp] | 1090 | 268 | 133 | 50 | Min– |
| pDR122 [Plac:: gfp-minD, minE] | 876 | 158 | 8 | 5 | WT |
| pDR156 [Plac::gfp-minD, minE-gfp] | 602 | 128 | 3 | 2 | WT |
| PDR174 [Plac::bfp-minD, minE-gfp] | 1060 | 191 | 8 | 4 | WT |
| PCH213 [Plac::gfp-minD, minE-bfp] | 590 | 108 | 7 | 6 | WT |
Strain HL1 was transformed with the indicated plasmids and transformants were grown in the presence of IPTG to OD600 = 0.26–0.31. Cells were chemically fixed and observed by microscopy using Nomarski optics to determine the number of polar and non-polar septa. IPTG was present at 25 (pDB175, pDR122 and pCH213), 50 (pMLB113ΔH3, pDR156 and pDR174) or 100 µM (pDR112). These particular concentrations were chosen based on the results of pilot experiments in which each strain was grown at a range (0, 25, 50, 100, 250 and 500 µM) of inducer concentrations. All strains were Min– when grown in the absence of IPTG. Strains HL1/pDB175 and HL1/pDR122 were also Min– when grown in the presence of >50 µM IPTG. Strains HL1/pMLB1113ΔH3 and HL1/pDR112 were Min– at all inducer concentrations. Indicated are the number of cells examined (cells), the total number of septa in these cells (septa), the number (polar) and percentage (% polar) of septa that were misplaced at or near a cell pole, and the division phenotype. Min–, minicell phenotype, characterized by a high percentage of polar septa. Cultures consist of a mixture of spherical minicells and rods ranging in size from normal to short filaments; WT, wild-type division pattern, characterized by no or few polar septa (<7%). Cultures consist of normal sized rods with few or no minicells or filaments present.
As expected, HL1 cells harboring pDB175 or pDR122 reverted to a normal division phenotype when grown in the presence of 25 µM IPTG (Table I), supporting our previous evidence that the GFP–MinD fusion can functionally substitute for native MinD (Raskin and de Boer, 1999b).
Interestingly, however, pDR112 failed to correct the Min– phenotype of HL1 at any IPTG concentration. In addition, the frequency of the MinE–GFP localization cycle, detailed further below, was very low in HL1/pDR112 cells. The MinD oscillation frequency is sensitive, and inversely related, to the cellular MinD/MinE ratio, and a minimum frequency is required to prevent minicell formation (Raskin and de Boer, 1999b). Therefore, we reasoned that the GFP tag in HL1/pDR112 cells might effectively elevate the MinD/MinE ratio by reducing the concentration or activity of MinE, and that this might be compensated for by placing a similar tag on MinD as well.
To test this idea, we constructed pDR156 [Plac:: gfp-minD, minE-gfp], pDR174 [Plac:: bfp-minD, minE-gfp] and pCH213 [Plac:: gfp-minD, minE-bfp] (Figure 1). Plasmid pDR156 encodes MinD and MinE peptides that are both fused to GFP. Plasmids pDR174 and pCH213 are identical to pDR156, except that the tag on either minD (pDR174) or minE (pCH213) is replaced with bfp. As shown in Table I, all three plasmids indeed restored the minicell phenotype of HL1 cells to wild type in an IPTG-dependent manner. We conclude that the behaviors of both GFP–MinD and MinE–GFP, as described below, are likely to mimic closely those of the untagged proteins in wild-type cells.
Assembly and disassembly of the GFP–MinD ‘tube’
The GFP–MinD fusion protein in HL1/pDR122 [ΔminDE/Plac::gfp-minD, minE] cells oscillated as described before (Raskin and de Boer, 1999b) with an average oscillation cycle of 38 s (Table II).
Table II. Localization cycle parameters.
| Plasmid [genotype] | Phenotype | Residence (range) | Shift (range) | Half-cycle (range) | Cycle |
|---|---|---|---|---|---|
| pMLB1113ΔH3 [Plac::lacZ*] | Min– | – | – | – | – |
| pDB175 [Plac::minD, minE] | WT | – | – | – | – |
| pDR112 [Plac::minD, minE-gfp] | Min– | 134 (35–425) | 15 (8–35) | 149 (45–460) | 298 |
| pDR122 [Plac:: gfp-minD, minE] | WT | 12 (8–22) | 7 (5–9) | 19 (13–27) | 38 |
| pDR156 [Plac::gfp-minD, minE-gfp] | WT | 34 (26–49) | 14 (9–25) | 48 (31–69) | 96 |
| PDR174 [Plac::bfp-minD, minE-gfp] | WT | 34 (16–60) | 12 (7–18) | 46 (25–72) | 91 |
| PCH213 [Plac::gfp-minD, minE-bfp] | WT | 33 (19–60) | 12 (8–24) | 45 (30–81) | 90 |
Cells of strain HL1 [ΔminDE] carrying one of the indicated plasmids were grown as indicated in the footnotes to Table I. Cells were observed immediately by fluorescence microscopy to measure localization cycle parameters of GFP–MinD and MinE–GFP. The residence period was defined as that period in which the bulk of the fluorescent signal was confined to one cell half. In the case of MinE–GFP, this period equalled the apparent lifetime of a MinE ring structure. In the case of GFP–MinD, it equalled the apparent lifetime of a MinD tube structure. In both cases, the shift period was defined as the period between two consecutive residence periods. A half-cycle equals one complete residence plus one complete shift period, and a complete oscillation cycle is the sum of two half-cycles. Values are given in seconds and represent the average of at least 37 events (half-cycles) occurring in 16 individual cells, except for HL1/pDR112 for which 17 events in 14 individual cells are reported. Ranges are given in parentheses. Division phenotypes were defined as described in the footnotes to Table I.
GFP–MinD in HL1/pCH213 [ΔminDE/Plac:: gfp-minD, minE-bfp] cells behaved identically, except that the average oscillation cycle was almost 2.4-fold longer (90 s, Table II). Because the only difference between the two strains is that minE in HL1/pCH213 is fused to bfp, this finding supports the idea that the tag reduces MinE activity to some degree, leading to a higher ratio of MinD/MinE activities in the cell, which, in turn, is expected to result in a longer oscillation cycle (Raskin and de Boer, 1999b). Oscillation cycles between 0.5 and 2.0 min are compatible with a normal division pattern (Raskin and de Boer, 1999b). Accordingly, despite the difference in oscillation frequencies, both HL1/pDR122 and HL1/pCH213 cells showed virtually wild-type division phenotypes (Table I).
The length of one half oscillation cycle of MinD can be described as the sum of one residence period, during which virtually all of the protein resides in one cell half, and one shift period, during which protein moves to the opposite half. Both these periods were extended in HL1/pCH213 relative to HL1/pDR122 cells (Table II). Time-lapse images of a HL1/pCH213 cell are shown in Figure 2. These images are representative of the manner in which GFP–MinD was seen to move in both HL1/pCH213 and HL1/pDR122 cells. Due to the overall slower movement of the fusion, however, observations on the former were easier to record. We also note that in control experiments, where we examined cells in which the only fluorescent species was either BFP itself or one of several different BFP-tagged proteins, we observed no detectable signal using the GFP filter set used in the present experiments. In fact, BFP signals were too weak to be useful in double labeling experiments (see below). Therefore, it is highly unlikely that the BFP moiety contributed significantly to the fluorescent signal seen in HL1/pCH213.
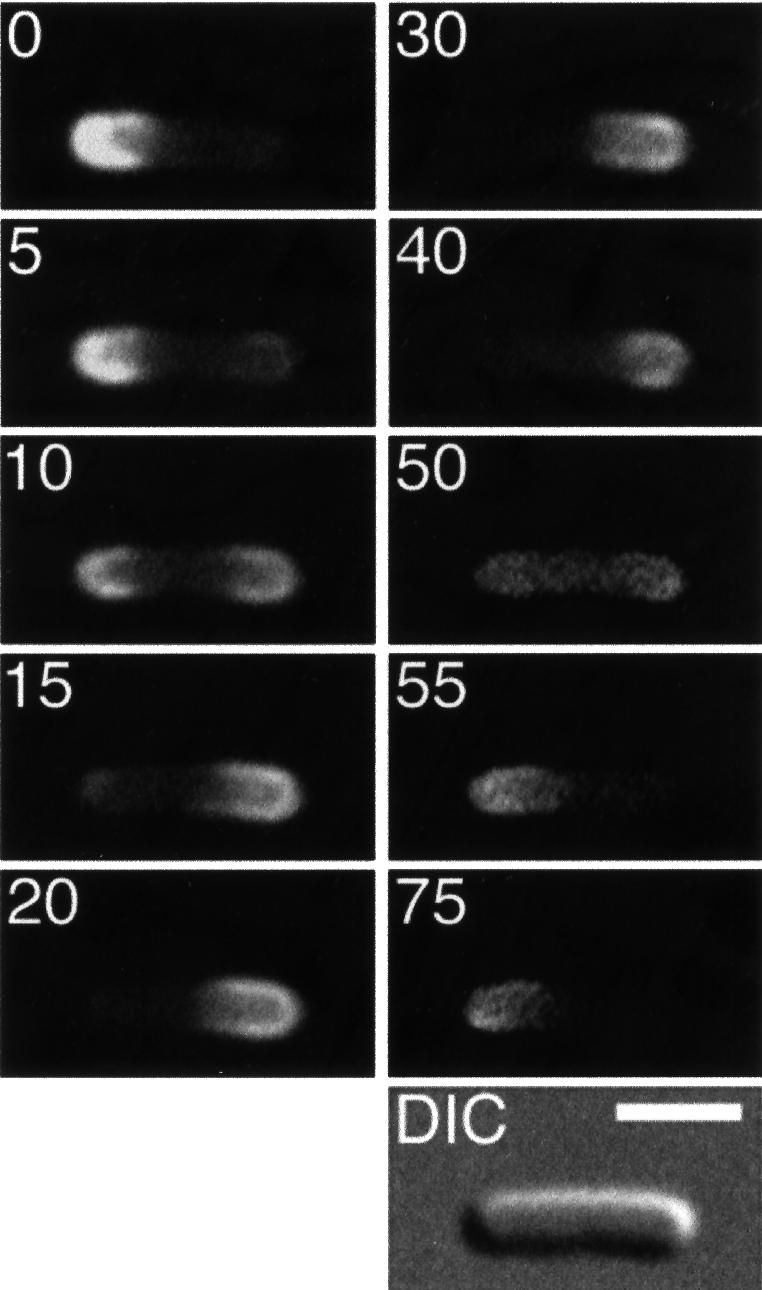
Fig. 2. Assembly and disassembly of the MinD tube. Fluorescence and differential interference contrast (DIC) images showing the dynamic behavior of GFP–MinD in a typical cell of strain HL1/pDB213 [ΔminDE/Plac:: gfp-minD, minE-bfp]. Cells were grown in the presence of 25 µM IPTG and displayed a wild-type division pattern. Fluores cence images constitute a time-lapse series and represent a complete GFP–MinD oscillation/localization cycle. Times are indicated in seconds. The bar represents 2 µm.
As shown before (Raskin and de Boer, 1999b; Rowland et al., 2000), GFP–MinD dynamically assembled underneath the membrane into a structure shaped like a test-tube in that it is round-bottomed at one end (corresponding to a cell pole) and open-ended at the other (Figure 2). During residence periods (0, 20–40 and 55–75 s), the tube initially appeared static for a few seconds and the rim of the tube reached to close to the middle of the cell (20 and 55 s). Then, the tube shortened as its rim retracted towards its bottom (0–15, 30–40 and 55–75 s) until all the fluorescence in that cell half had disappeared (20 and 55 s). (Graphs showing this redistribution of signal in a more quantitative manner are available as Supplementary data at The EMBO Journal Online.)
In about half of all events, we observed that during disassembly of a tube, a new one already developed in the opposite cell half (5–20 s). In other events, this was less clear due to a transient, but relatively high fluorescent signal in the cytoplasm, which obscured more detail during the shift period (40–55 s). Nevertheless, when it could be observed clearly, the manner of tube assembly appeared as a reversal of the manner of disassembly. Thus, a faint fluorescent signal was first seen at the pole (5 s), and this signal developed into a brightly fluorescent tube that lengthened as its rim grew towards the cell center (5–20 s). Similar dynamics, where the bottom of the tube is the first to assemble and the last to disassemble, were also noticed in cells expressing GFP–MinC (Hu and Lutkenhaus, 1999; Raskin and de Boer, 1999a; our unpublished results). These observations indicate that, when averaged over time, membrane occupancy by the MinC/MinD division inhibitor is highest at the cell poles and lowest at or near the middle of the cell.
Dynamic behavior of MinE–Gfp in live cells
Prolonged observation of the MinE–GFP ring in live cells that had been grown in rich medium was impeded by instability of the structure during microscopy (Raskin and de Boer, 1997). The reason for this instability is still unclear. Nevertheless, we have since found that microscopy-induced dispersal of MinE–GFP is greatly suppressed by growth of cells in minimal medium (Raskin and de Boer, 1999b), allowing us to follow the distribution of the fusion in live cells for up to several minutes.
HL1/pDR112 [ΔminDE/Plac:: minD, minE-gfp] and HL1/pDR174 [ΔminDE/Plac:: bfp-minD, minE-gfp] cells were grown in the presence of IPTG and individual live cells were observed by fluorescence microscopy. Although the division phenotypes of these cells were Min– and wild type, respectively (Table I), the distribution patterns of the MinE–GFP fusion were identical in both strains. As seen before (Raskin and de Boer, 1997), cells showed a prominent accumulation of MinE–GFP in a ring-like shape (the E-ring), as well as a weaker extra-annular signal (PEA) along the membrane on only one side of the E-ring (Figures 3 and 4).

Fig. 3. Localization cycle of MinE–GFP in live cells. Fluorescence time-lapse images showing the dynamic behavior of MinE–GFP in a typical cell of strain HL1/pDR112 [ΔminDE/Plac:: minD, minE-gfp]. Cells were grown in the presence of 100 µM IPTG and displayed a Min– division pattern (see text). Fluorescence images represent a complete MinE–GFP localization cycle. Times are indicated in seconds. Note the accumulation of MinE–GFP in the shape of a ring (the E-ring) as well as in a peripheral extra-annular pattern (PEA signal), which is present between the ring and one of the cell poles. Note the net movement of a ring towards the pole with the PEA signal (0–75, 105–180 and 210–240 s), the disappearance of a ring and PEA signal when the former approaches a cell pole (90 and 195 s), and the subsequent assembly of a new ring at or near midcell concomitant with the appearance of a new PEA signal between the new ring and the pole previously devoid of signal (0, 105 and 210 s). Arrowheads (< or >) indicate both the position of the ring and the direction of its movement. During the 135–150 s interval, the ring appeared to reverse direction for a short instance, a rare phenomenon that we observed only occasionally. In the DIC panel, the cell poles are numbered 1 and 2, arbitrarily (see text), and the bar represents 2 µm.

Fig. 4. Localization cycle of MinE–GFP in live and normally dividing cells. Fluorescence time-lapse images showing the dynamic behavior of MinE–GFP in a typical cell of strain HL1/pDR174 [ΔminDE/Plac::bfp-minD, minE-gfp]. Cells were grown in the presence of 50 µM IPTG and displayed a wild-type division pattern. The dynamics of both the ring and PEA signals were identical to those observed in HL1/pDR112 cells, except that the length of the localization cycle was significantly shorter. For further explanation, see the legend to Figure 3 and the text.
Interestingly, both the E-ring and PEA signal clearly showed dynamic behavior in both strains. Time-lapse images of HL1/pDR112 and HL1/pDR174 cells are shown in Figures 3 and 4, respectively. Beginning from a position at or near the middle of cells (Figure 3, 0 s), the ring moved towards the cell pole (pole 1) containing the PEA signal. As the ring moved, the PEA signal remained confined to the decreasing portion of the cell membrane defined by the ring and pole 1 (Figure 3, 0–60 s; Figure 4, 0–6 s). When the ring reached a position close to or at pole 1, it appeared to dissolve (Figure 3, 75–90 s; Figure 4, 12–18 s). During dissolution of the ring at one cell end, another ring appeared to form de novo. In most cells, the new structure became clearly visible only at or near the middle of the cell (Figure 3, 90–105 s; Figure 4, 18–24 s). In some instances, however, we observed the new ring develop as a very weakly fluorescent structure that was first visible in the area between pole 2 and midcell and which gained signal intensity as it quickly moved to settle at or near midcell (not shown, and see below). In the interval between disappearance of an old ring and formation of a new one, the fluorescent signal became ill defined and a significant amount of fluorescence appeared to become transiently dispersed throughout the cell (Figure 3, 90 s and 195 s; Figure 4, 12–18 s and 72 s). This suggests that a portion of MinE–GFP may become cytoplasmic during this interval. Concomitant with the development of a new ring at or near midcell, a new PEA signal appeared between the ring and pole 2 (Figure 3, 90–105 s; Figure 4, 18–24 s). The newly formed ring appeared to dwell for several seconds at or near midcell, before moving towards pole 2 (Figure 3, 90–180 s; Figure 4, 24–60 s) where it appeared to dissolve again (Figure 3, 195 s; Figure 4, 66–72 s). Then, a new structure developed at or near midcell again (Figure 3, 195–210 s; Figure 4, 78 s), and this new ring remained for several seconds before moving towards pole 1, starting the next localization cycle (Figure 3, 210–240 s; Figure 4, 78–96 s).
Although in the majority of cases movement of the E-ring appeared smooth, we sometimes observed a ring stall or even, in rare instances, reverse direction for a short while before moving on again (Figure 3, 120–150 s). However, net movement of the ring was invariantly directed towards the pole containing the PEA signal.
Compared with the dynamics of MinE–GFP in HL1/pDR174 cells, movement of the fusion in HL1/pDR112 was remarkably slow. We determined the lengths of half-cycles by measuring the time interval between the appearance of consecutive E-ring structures at or near midcell in randomly chosen cells. As indicated in Table II, half-cycles in HL1/pDR174 cells ranged from 25 to 72 s, with an average of 46 s. In contrast, HL1/pDR112 cells showed a very wide range (45–460 s) and averaged 149 s. Thus, on average, a complete localization cycle in HL1/pDR112 cells took almost 5 min, which is more than three times as long as in HL1/pDR174 cells (1.5 min).
We argue below that the length of the MinE localization cycle is likely to be equal to the length of the MinD oscillation cycle in the same cell. Accordingly, it is likely that the inability of pDR112 to correct the Min– phenotype of HL1 is due to a MinC/MinD oscillation cycle that is too slow to prevent Z-ring formation efficiently at the cell poles (Raskin and de Boer, 1999b).
Model for MinD oscillation and MinE dynamics
Several lines of evidence indicate that the dynamic cellular distributions of MinD and MinE are interdependent. In the absence of MinD, MinE–GFP does not accumulate in a ring nor in a PEA pattern, but remains evenly distributed throughout the cytoplasm (Raskin and de Boer, 1997). Conversely, in the absence of MinE, GFP–MinD fails to segregate/oscillate, but appears evenly distributed over the entire cell membrane (Raskin and de Boer, 1999b). In addition, the oscillation frequency of MinD is directly related to the cellular level of MinE, suggesting that the latter may stimulate one or more steps in the membrane association/dissociation cycle of the former (Raskin and de Boer, 1999b). In combination with these observations, as well as with theoretical considerations which will be described elsewhere (H.Meinhardt and P.A.J.de Boer, in preparation), the results above suggest a model in which the dynamics of MinE are intimately coupled to the oscillatory behavior of MinD.
This model (Figure 5A) has the following features. (i) A portion of MinE in the cell exactly co-localizes with membrane-associated MinD. This portion decorates both the bottom and walls of the MinD ‘tube’, and gives rise to the PEA signal seen with MinE–GFP. (ii) The bulk of MinE, however, localizes more specifically at the MinD–non-MinD border on the membrane. This portion decorates the ‘rim’ of the tube and gives rise to the strong fluorescent signal of MinE–GFP in the shape of a ring. (iii) MinE stimulates the disassembly of MinD from the membrane, causing the rim of the MinD tube to retract towards the pole. As MinE remains associated with this rim, the ring of MinE–GFP fluorescence is also seen to migrate towards the pole. (iv) When a sufficient amount of MinD has begun to reassemble at the opposite pole to form a new ‘tube’, the E-ring will disappear as it nears the pole towards which it was moving, to reassemble on the rim of the new MinD structure at or near the middle of the cell. Meanwhile, a portion of MinE again associates with the wall of the new MinD tube, resulting in the new PEA signal. (v) MinE again stimulates disassembly of this new structure, causing the ring to move towards pole 2, etc.

Fig. 5. Model of coupled MinD and MinE dynamics. Schematic interpretation of the dynamic behavior of the Min proteins during a full localization cycle in a wild-type cell (A) and in a short filament (B). Dark spheres, MinD; light spheres, extra-annular MinE (PEA signal); large triangles, annular MinE (E-ring); small triangles, E-ring in the process of assembly. MinC is not drawn separately, but follows the localization of MinD (dark spheres). MinD assembles on the membrane in the shape of a test tube (e.g. panel 1) or, when the protein decorates an internal membrane segment in filamentous cells, in the shape of tubing (e.g. panel b5). A portion of MinE co-localizes with MinD, giving rise to the PEA signal seen in cells expressing MinE–GFP. In addition, a substantial portion of MinE accumulates more specifically at the rim of MinD structures, giving rise to a ring-shaped signal. During disassembly of a MinD tube from the membrane, the rim of the tube, together with the associated E-ring, moves towards a pole [(A) 1–3 and 5–7; (B) 1–3]. When the tube has disassembled, the E-ring has dissipated as well [(A) 4 and 8; (B) 4]. Meanwhile, in wild-type cells, a new MinD tube forms on the membrane in the opposite cell half, and a new E-ring forms on the rim of the new tube [(A) 1 and 5]. In filaments, disassembly of a polar tube is followed by assembly of MinD on a neighboring internal membrane segment and MinE accumulates on both rims [(B) 3–5]. During disassembly of MinD from such a segment, the two rims of the MinD tubing each, together with their associated E-ring, move towards the center of the segment until it is devoid of MinD and the two E-rings dissipate [(B) 5–8]. Assembly of MinE on the rim(s) of MinD structures can be seen to start even before these structures are fully extended (panels 4 and 8).
Coupling of MinD oscillation and MinE dynamics
If the MinD oscillation cycle is coupled to E-ring dynamics as predicted by the model, the frequencies of the MinD and MinE localization cycles in any one cell ought to be equal. This supposition is supported by a comparison of the localization cycle frequencies of MinE–GFP and GFP–MinD in normally dividing cells of strains HL1/pDR174 [ΔminDE/Plac:: bfp-minD, minE-gfp] and HL1/pCH213 [ΔminDE/Plac:: gfp-minD, minE-bfp], respectively (Table II). Thus, the average time that elapsed during the displacement of an E-ring from midcell towards a pole, the dissolution of the structure and the subsequent reappearance of a new ring at or near midcell in HL1/pDR174 was virtually equal to the average time that elapsed during disassembly of the MinD tube from the membrane on one cell half and reassembly on the other in HL1/pCH213 cells (46 and 45 s, respectively). In both cases, these values represent the average length of half a localization cycle.
To obtain more direct visual evidence for the coupling of MinD and MinE dynamics, we also wished to observe fluorescent versions of both proteins in the same cell. The blue fluorescent derivatives encoded by pDR174 and pCH213 (BFP–MinD and MinE–BFP, respectively) were not useful for this purpose, however. Even when using optics optimized for imaging BFP, the blue fluorescent signal in HL1 cells carrying either plasmid was virtually undetectable. Similarly, plasmid derivatives encoding yellow and cyan fluorescent versions of MinD and MinE produced unsatisfactory results, because signals were either too weak and/or too short lived (results not shown).
As a next best alternative, we used plasmid pDR156 [Plac:: gfp-minD, minE-gfp] in which both minD and minE are fused to gfp. Strain HL1/pDR156 divided normally in the presence of IPTG, and the average length of a fluorescence localization cycle (96 s) was very close to that observed with strains HL1/pDR174 and HL1/pCH213 (Tables I and II). Consistent with this finding, the ratios of MinD/MinE fusion protein were practically identical (0.8–0.9) in all three strains, as determined by quantitative immunoblotting using anti-GFP/BFP antibodies.
A time-lapse series of a HL1/pDR156 cell is shown in Figure 6. The fluorescence patterns observed in these cells, and the way they behaved, were precisely in accordance with predictions of the model (Figure 5A). Thus, the fluorescence distribution was very similar to that in cells in which GFP–MinD was the only fluorescent species in that the bulk of fluorescence accumulated in a membrane-associated ‘tube’ extending from one cell pole up to, maximally, midcell. However, in contrast to the situation in HL1/pDR122 or HL1/pCH213 cells, in which the rim area of the tube usually appears as the weakest fluorescent region of the structure, we frequently observed a distinct, additional, accumulation of fluorescence at the ‘rim’ of the tube in HL1/pDR156 cells. Quite often this signal could be seen as membrane-associated spots that were clearly distinguishable from the tube portion of the signal. Furthermore, these spots always moved along the membrane with the retracting rim of the tube. It is reasonable to assume that this rim signal corresponds to the E-ring seen in HL1/pDR174 cells. It is also important to point out that during the residence phases of the cycle, virtually all fluorescence was still contained within the region of the membrane in between the ring and the proximal pole, which is consistent with the prediction that the PEA signal of MinE–GFP coincides with the tube-shaped signal of GFP–MinD.

Fig. 6. Dynamic localization of both GFP–MinD and MinE–GFP in the same cell. Fluorescence time-lapse images showing the combined dynamic signals of both GFP–MinD and MinE–GFP in a typical cell of strain HL1/pDR156 [ΔminDE/Plac::gfp-minD, minE-gfp]. Cells were grown in the presence of 50 µM IPTG and displayed a wild-type division pattern. The images represent a complete localization cycle with time indicated in seconds. Note the tube-like signal, which is similar to the GFP–MinD signal in Figure 2, as well as to the PEA portion of the MinE–GFP signal in Figures 3 and 4. During residence portions of the cycle (0, 30–60 and 80–100 s), only a single tube-shaped signal can be detected, suggesting that the PEA portion of MinE–GFP coincides with the GFP–MinD tube. Also note the presence of fluorescent dots that can often be distinguished at the rim of the tube (arrowpoints). These dots remain associated with the rim as it retracts towards a cell pole (0, 30–60 and 80–100 s), and probably represent the ring portion of the MinE–GFP signal. For further explanation, see the legend to Figure 3 and the text.
Dynamics of MinE–GFP in FtsZ-depleted cells
The localization of the Min proteins in E.coli does not require the formation of the FtsZ/septal ring. In FtsZ– filaments, multiple E-ring structures are present and distinct PEA signals can be seen on one side of each ring, giving rise to a zebra-like staining pattern (Raskin and de Boer, 1997). Similarly, MinC/MinD oscillation continues in these filaments. However, rather than moving en masse between the two cell halves, MinC/MinD accumulates in multiple, regularly spaced segments on the membrane, and moves back and forth between these and intervening membrane segments. Furthermore, these segments have one of two different shapes. Polar segments are shaped as in wild-type cells like a test tube with a single rim, but internal segments resemble more ‘tubing’ with a rim at both ends (Raskin and de Boer, 1999a,b).
Here, we studied the dynamics of MinE–GFP localization in FtsZ– filaments using strain DR102/pDB346 [ΔminCDE::aph, ftsZ0, recA::Tn10/PλR::ftsZ, cI857] in which ftsZ transcription is repressed when cells are grown at 30°C. The strain was transformed with pDR174 [Plac:: bfp-minD, minE-gfp] and transformants were examined after growth at 30°C in the presence of IPTG.
A typical example of a short filament with two E-rings is shown in Figure 7. At t = 0, the filament showed three membrane segments as defined by the positions of the two rings and the cell poles. The internal segment contained little or no MinE–GFP, whereas the two outer segments showed clear PEA signals. The distance between the ring structures increased as each moved in the direction of the adjacent PEA signal (0–20 s). Both rings appeared to dissipate as two new structures became visible at approximately one-third and two-thirds positions along the long axis of the filament (20–30 s). Concomitantly, a new PEA signal developed in the central segment between the two new rings (30 s). The distance between the two new rings became smaller as they now both moved towards the center of the filament (30–190 s). When the rings approached the center, they dissipated and two new rings were formed yet again at approximately one-third and two-thirds positions. Meanwhile, new PEA signals became visible in the two polar segments (195–205 s). The two new rings began to move away from each other again, completing a full localization cycle (205–240 s). Longer filaments containing three or more rings showed identical movements of ring and PEA signals (not shown). The oscillatory localization cycle of the PEA signal(s) is very similar to that of GFP–MinD and GFP–MinC in FtsZ-depleted filaments (Raskin and de Boer, 1999a,b), reinforcing the proposal that the PEA signal marks the location of MinD in the cell.

Fig. 7. MinE–GFP dynamics in FtsZ– filaments. Time-lapse series showing the dynamic localization of MinE–GFP in a short filament of strain DR102/pDB346/pDR174 [ΔminCDE::aph, ftsZ0, recA::Tn10/PλR::ftsZ, cI857/Plac::bfp-minD, minE-gfp]. Cells were grown in the presence of 50 µM IPTG at 30°C and displayed a filamentous phenotype due to the depletion of FtsZ. The images represent a complete localization cycle with times indicated in seconds. The origin of the rapidly fading bright spot at the right pole is unclear. Such spots were absent in other filaments, and no inclusion bodies were observed. For further explanation, see the legend to Figure 3 and the text.
Figure 7 also shows weakly fluorescent and rapidly moving ring structures (small arrowheads at 25 and 195 s), which only seconds later appear as fully formed E-rings at approximately the two-thirds and one-third position, respectively, and then begin to move in the opposite direction. Similar weakly fluorescent rings were also observed in normal sized cells (not shown), and their presence and behavior suggest that MinE–GFP can begin to accumulate on the rim(s) of the MinD tube, or tubing, even before these structures are fully extended (Figure 5, panels 4 and 8).
Oscillation of MinC/MinD does not require FtsZ (Raskin and de Boer, 1999a,b), and we conclude that the same is true for the dynamic behavior of MinE–GFP described here. In addition, we conclude that the behavior of MinE in FtsZ-depleted filaments is essentially the same as in normally dividing cells (Figure 5B). One difference is that the single ring in wild-type cells always moves towards a pole, whereas in filaments neighboring rings can also move towards each other. Nevertheless, the overriding principle is that net movement of E-rings always occurs into the segment(s) of the cell membrane decorated by MinD (as monitored by the location of the PEA signal). This is so, regardless of whether these segments are bounded by a ring and a pole, as is the case in wild-type cells and in polar segments of filaments, or by two rings, as is the case in internal segments of filaments.
Discussion
In previous models of MinCDE action, it was assumed that the E-ring was a relatively static structure which remained localized at or near the center of the cell throughout most of the division cycle (Raskin and de Boer, 1997, 1999a,b; King et al., 2000; Rowland et al., 2000). Here, we studied the behavior of functional GFP-tagged MinE protein in live, and phenotypically wild-type, cells. An important conclusion of this work is that the cellular location of MinE–GFP is not static but, in fact, remarkably dynamic. As seen previously (Raskin and de Boer, 1997), MinE–GFP accumulated in a ring as well as in a weaker PEA pattern. However, both signals were seen to undergo a well defined and rapid localization cycle. Similar dynamics were also observed recently by Fu et al. (2001). The present observations clearly obviate the need for a mechanism to fix MinE at midcell (Raskin and de Boer, 1997; King et al., 2000), but raise the question of what drives MinE movement.
Several lines of evidence indicate that the localization cycle of MinE is intimately coupled to the oscillatory behavior of the MinD protein: (i) MinE–GFP remains in the cytoplasm in the absence of MinD whereas, conversely, GFP–MinD fails to segregate/oscillate in the absence of MinE (Raskin and de Boer, 1997, 1999b; Rowland et al., 2000); (ii) MinD directly interacts with MinE and this interaction is involved in recruiting MinE to the membrane (Huang et al., 1996; Raskin and de Boer, 1997); (iii) the length of the MinE–GFP localization cycle is identical to that of the oscillation cycle of GFP–MinD, when measured under comparable conditions (Table II); (iv) the frequencies of both these cycles appear to be inversely related to the ratio of MinD/MinE activities in the cell; and (v) in normally dividing cells that express both functional GFP–MinD and functional MinE–GFP, the signal of the former and the PEA signal of the latter do not separate, indicating that the PEA portion of MinE directly co-localizes with membrane-associated MinD during the time that the latter resides in one cell half. In addition, the signal that most probably corresponds to the E-ring in these cells often appears as a distinct accumulation of fluorescence at the ‘rim’ of the fluorescent ‘tube’ and remains associated with this rim as it retracts towards a cell pole. The finding that in cells in which only MinE is tagged with GFP, the E-ring always moves towards the PEA signal is fully consistent with this interpretation.
In conclusion, the data from this and previous studies indicate that the primary role of the MinE protein is in the mechanism of MinC/MinD oscillation, rather than as a marker for the site of Z-ring assembly. The preferential accumulation of MinE at the rim of the MinD tube indicates that, at least, a substantial fraction of the protein recognizes some special molecular feature at this rim and also suggests that this may be its primary site of action. One attractive possibility is that MinE stimulates the disassembly of the MinD tube, as proposed here. This would provide a straightforward explanation for the inverse relationship between protein oscillation frequencies and the MinD/MinE ratio in cells, and is also consistent with all other known properties of the Min system in E.coli. Further experiments are required to test this possibility more directly.
Although a substantial portion of MinE–GFP accumulates at the rim of MinD assemblies, the portion that appears to co-localize with the body of the MinD tube (or tubing) is not insignificant. The existence of two distinguishable populations of MinE in the cell raises the question of whether the two are also functionally and/or structurally distinct. MinE is thought to exist as a mixture of monomers and dimers, and the dimerization domain resides in the C-terminal portion of the peptide (Pichoff et al., 1995; Zhang et al., 1998; King et al., 1999, 2000). MinE mutants lacking this domain fail to accumulate in a ring, but localize along the membrane in a MinD-dependent fashion (Raskin and de Boer, 1997; Rowland et al., 2000). Therefore, one interesting possibility is that the PEA and ring signals represent monomeric and dimeric forms of the protein, respectively. In this scenario, it would be the dimerization of MinE that endows it with a specific affinity for the rim of the MinD tube.
If MinE does not mark the site for Z-ring assembly directly, how does the Min system control the correct placement of the division site? We proposed previously that an oscillator such as MinC/MinD in E.coli could be used as a cellular measuring device, since the midpoint of the cell would be uniquely identifiable as the site where the time-integrated concentration of membrane-associated MinC/MinD would be lowest (Raskin and de Boer, 1999b). The present observations on the modes of MinD tube assembly/disassembly and MinE movement imply that, as a function of time, membrane occupancy by MinC/MinD along the length of a cell must indeed assume a symmetrical curve that is highest at the cell poles and lowest at midcell. Furthermore, the use of an oscillator as a means of defining the center of a field can be demonstrated readily by computer simulations based on well established algorithms that are more generally used to describe oscillatory phenomena (Meinhardt and Gierer, 2000; H.Meinhardt and P.A.J.de Boer, in preparation). In principle, any molecule or process sensitive to the concentration of MinC/MinD might become restricted to the middle of the cell. The results of this study show that this molecule is not MinE. Therefore, we propose that it is the process of Z-ring assembly itself that directly responds to the cellular MinC gradient, which is generated, in effect, by its MinDE-induced oscillation. Especially in light of the recent biochemical evidence that MinC can both directly bind FtsZ and block its polymerization in vitro (Hu et al., 1999; Hu and Lutkenhaus, 2000), it can be expected that FtsZ assemblies in vivo are most stable at the site of the membrane with the lowest average concentration of MinC. Thus, in this view, it is not MinE that finds the center by sensing the concentration of MinD (Raskin and de Boer, 1999b), but rather FtsZ itself which finds the center by sensing MinC. The nucleoid occlusion effect, furthermore, prevents a completely random division pattern in Min– cells (Yu and Margolin, 1999). Given its directness, this modification of the model for MinCDE action in E.coli is very attractive.
Materials and methods
Strains and plasmids
Strains RS3242 [zcf117::Tn10] (Simons et al., 1980), PB103 [dadR trpE trpA tna] and DR102/pDB346 [PB103, ΔminCDE::aph, ftsZ0, recA::Tn10 /PλR::ftsZ, cI857] (Raskin and de Boer, 1997) were described before. BW10724 [recA::cat] was kindly provided by David Weiss and Jon Beckwith.
HL1 [PB103, ΔminDE zcf117::Tn10 recA::cat] was obtained in several steps. PB103 was transformed with plasmid pDB380 [repAts, minC0, ΔminDE], and the ΔminDE mutation on the plasmid was exchanged with the wild-type minDE genes on the chromosome essentially as described before (Hamilton et al., 1989). This yielded strain PB147/pDB387 [ΔminDE/repAts, minC0, minDE+], which was cured of the plasmid by growth at 42°C. To link the chromosomal ΔminDE deletion of PB147 with a convenient selectable marker, the zcf117::Tn10 allele of RS3242 was introduced by P1-mediated transduction, with selection for tetracycline resistance and Min–. The resulting strain (PB148) was infected with P1 and the lysate was used to transduce PB103 to Tetr. This step yielded strain PB149 [ΔminDE zcf117::Tn10], which was made RecA– by the introduction of the recA::cat allele of BW10724 by P1-mediated transduction with selection for Camr, resulting in strain HL1.
Plasmids pDB175 (de Boer et al., 1989), pDR112, pDB346 (Raskin and de Boer, 1997) and pDR122 (Raskin and de Boer, 1999b) were described before. Relevant features of the other plasmids used in this study are given in Figure 1 and the text. Details of their construction can be found in the Supplementary material, or obtained from the authors.
Microscopy and other methods
Unless stated otherwise, cells were grown at 30°C in M9 minimal salts medium (18.7 mM NH4Cl, 410.3 mM Na2HPO4, 220.4 mM KH2PO4, 85.6 mM NaCl, 1.0 mM MgSO4, 0.1 mM CaCl2 pH 7.4) supplemented with l-tryptophan (50 µg/ml), casamino acids (0.2%), maltose (0.2%), ampicillin (50 µg/ml) and IPTG as indicated, to an optical density (600 nm) of 0.21–0.31. Protein dynamics and division phenotypes were determined by microscopy at 20°C as described before (Raskin and de Boer, 1999b). Doubling times of all HL1 strains were ∼225 min at 30°C and ∼500 min at 20°C.
Quantitative immunoblotting with polyclonal anti-GFP antibodies was performed essentially as described (Hale et al., 2000).
Supplementary data
Supplementary data for this paper are available at The EMBO Journal Online.
Acknowledgments
Acknowledgements
We thank David Raskin and Hui Li for help with strain and plasmid construction, Laura Lackner for testing the usability of various CFP and YFP derivatives, and Wim de Boer for useful discussions. This work was supported by NIH grant GM-57059 (to P.A.J.d.B.).
References
- Bi E. and Lutkenhaus,J. (1993) Cell division inhibitors, SulA and MinCD prevent formation of the FtsZ ring. J. Bacteriol., 175, 1118–1125. [DOI] [PMC free article] [PubMed] [Google Scholar]
- de Boer P.A.J., Crossley,R.E. and Rothfield,L.I. (1989) A division inhibitor and a topological specificity factor coded for by the minicell locus determine proper placement of the division septum in E.coli. Cell, 56, 641–649. [DOI] [PubMed] [Google Scholar]
- de Boer P.A.J., Crossley,R.E. and Rothfield,L.I. (1990) Central role for the Escherichia coli minC gene product in two different cell division-inhibition systems. Proc. Natl Acad. Sci. USA, 87, 1129–1133. [DOI] [PMC free article] [PubMed] [Google Scholar]
- de Boer P.A.J., Crossley,R.E., Hand,A.R. and Rothfield,L.I. (1991) The MinD protein is a membrane ATPase required for the correct placement of the Escherichia coli division site. EMBO J., 10, 4371–4380. [DOI] [PMC free article] [PubMed] [Google Scholar]
- Fu X., Shih,Y.-L., Zhang,Y. and Rothfield,L.I. (2001) The MinE ring required for proper placement of the division site is a mobile structure that changes its cellular location during the E.coli division cycle. Proc. Natl Acad. Sci. USA, 98, 980–985. [DOI] [PMC free article] [PubMed] [Google Scholar]
- Hale C.A., Rhee,A.C. and de Boer,P.A.J. (2000) ZipA-induced bundling of FtsZ polymers mediated by an interaction between C-terminal domains. J. Bacteriol., 182, 5153–5166. [DOI] [PMC free article] [PubMed] [Google Scholar]
- Hamilton C.M., Aldea,M., Washburn,B.K., Babitzke,P. and Kushner,S.R. (1989) New method for generating deletions and gene replacements in Escherichia coli. J. Bacteriol., 171, 4617–4622. [DOI] [PMC free article] [PubMed] [Google Scholar]
- Hu Z. and Lutkenhaus,J. (1999) Topological regulation of cell division in Escherichia coli involves rapid pole to pole oscillation of the division inhibitor MinC under the control of MinD and MinE. Mol. Microbiol., 34, 82–90. [DOI] [PubMed] [Google Scholar]
- Hu Z. and Lutkenhaus,J. (2000) Analysis of MinC reveals two independent domains involved in interaction with MinD and FtsZ. J. Bacteriol., 182, 3965–3971. [DOI] [PMC free article] [PubMed] [Google Scholar]
- Hu Z., Mukherjee,A., Pichoff,S. and Lutkenhaus,J. (1999) The MinC component of the division site selection system in Escherichia coli interacts with FtsZ to prevent polymerization. Proc. Natl Acad. Sci. USA, 96, 14819–14824. [DOI] [PMC free article] [PubMed] [Google Scholar]
- Huang J., Cao,C. and Lutkenhaus,J. (1996) Interaction between FtsZ and inhibitors of cell division. J. Bacteriol., 178, 5080–5085. [DOI] [PMC free article] [PubMed] [Google Scholar]
- King G.F., Rowland,S.L., Pan,B., Mackay,J.P., Mullen,G.P. and Rothfield,L.I. (1999) The dimerization and topological specificity functions of MinE reside in a structurally autonomous C-terminal domain. Mol. Microbiol., 31, 1161–1169. [DOI] [PubMed] [Google Scholar]
- King G.F., Shih,Y.L., Maciejewski,M.W., Bains,N.P., Pan,B., Rowland,S.L., Mullen,G.P. and Rothfield,L.I. (2000) Structural basis for the topological specificity function of MinE. Nature Struct. Biol., 7, 1013–1017. [DOI] [PubMed] [Google Scholar]
- Lutkenhaus J. and Addinall,S.G. (1997) Bacterial cell division and the Z ring. Annu. Rev. Biochem., 66, 93–116. [DOI] [PubMed] [Google Scholar]
- Margolin W. (2000) Themes and variations in prokaryotic cell division. FEMS Microbiol. Rev., 24, 531–548. [DOI] [PubMed] [Google Scholar]
- Marston A.L. and Errington,J. (1999) Selection of the midcell division site in Bacillus subtilis through MinD-dependent polar localization and activation of MinC. Mol. Microbiol., 33, 84–96. [DOI] [PubMed] [Google Scholar]
- Meinhardt H. and Gierer,A. (2000) Pattern formation by local self-activation and lateral inhibition. BioEssays, 22, 753–760. [DOI] [PubMed] [Google Scholar]
- Mulder E. and Woldringh,C.L. (1989) Actively replicating nucleoids influence positioning of division sites in Escherichia coli filaments forming cells lacking DNA. J. Bacteriol, 171, 4303–4314. [DOI] [PMC free article] [PubMed] [Google Scholar]
- Pichoff S., Vollrath,B., Touriol,C. and Bouché,J.-P. (1995) Deletion analysis of gene minE which encodes the topological specificity factor of cell division in Escherichia coli. Mol. Microbiol., 18, 321–329. [DOI] [PubMed] [Google Scholar]
- Raskin D.M. and de Boer,P.A.J. (1997) The MinE ring: an FtsZ-independent cell structure required for selection of the correct division site in E.coli. Cell, 91, 685–694. [DOI] [PubMed] [Google Scholar]
- Raskin D.M. and de Boer,P.A.J. (1999a) MinDE dependent pole-to-pole oscillation of division inhibitor MinC in Escherichia coli. J. Bacteriol., 181, 6419–6424. [DOI] [PMC free article] [PubMed] [Google Scholar]
- Raskin D.M. and de Boer,P.A.J. (1999b) Rapid pole-to-pole oscillation of a protein required for directing division to the middle of Escherichia coli. Proc. Natl Acad. Sci. USA, 96, 4971–4976. [DOI] [PMC free article] [PubMed] [Google Scholar]
- Rothfield L., Justice,S. and García-Lara,J. (1999) Bacterial cell division. Annu. Rev. Genet., 33, 423–448. [DOI] [PubMed] [Google Scholar]
- Rowland S.L., Fu,X., Sayed,M.A., Zhang,Y., Cook,W.R. and Rothfield,L.I. (2000) Membrane redistribution of the Escherichia coli MinD protein induced by MinE. J. Bacteriol., 182, 613–619. [DOI] [PMC free article] [PubMed] [Google Scholar]
- Simons R.W., Egan,P.A., Chute,H.T. and Nunn,W.D. (1980) Regulation of fatty acid degradation in Escherichia coli: isolation and characterization of strains bearing insertion and temperature-sensitive mutations in gene fadR. J. Bacteriol., 142, 621–632. [DOI] [PMC free article] [PubMed] [Google Scholar]
- Woldringh C.L., Mulder,E., Huls,P.G. and Vischer,N. (1991) Toporegulation of bacterial division according to the nucleoid occlusion model. Res. Microbiol., 142, 309–320. [DOI] [PubMed] [Google Scholar]
- Yu X.-C. and Margolin,W. (1999) FtsZ ring clusters in min and partition mutants: role of both the Min system and the nucleoid in regulating FtsZ ring localization. Mol. Microbiol., 32, 315–326. [DOI] [PubMed] [Google Scholar]
- Zhang Y., Rowland,S., King,G., Braswell,E. and Rothfield,L. (1998) The relationship between hetero-oligomer formation and function of the topological specificity domain of the Escherichia coli MinE protein. Mol. Microbiol., 30, 265–273. [DOI] [PubMed] [Google Scholar]