Abstract
Rotaviruses are important human pathogens with a triple-layered icosahedral capsid. The major capsid protein VP6 is shown here to self-assemble into spherical or helical particles mainly depending upon pH. Assembly is inhibited either by low pH (<3.0) or by a high concentration (>100 mM) of divalent cations (Ca2+ and Zn2+). The structures of two types of helical tubes were determined by electron cryomicroscopy and image analysis to a resolution of 2.0 and 2.5 nm. In both reconstructions, the molecular envelope of VP6 fits the atomic model determined by X-ray crystallography remarkably well. The 3-fold symmetry of the VP6 trimer, being incompatible with the helical symmetry, is broken at the level of the trimer contacts. One type of contact is maintained within all VP6 particles (tubes and virus), strongly suggesting that VP6 assemblies arise from different packings of a unique dimer of trimers. Our data show that the protonation state and thus the charge distribution are important switches governing the assembly of macromolecular assemblies.
Keywords: electron cryomicroscopy/image analysis/rotavirus/small angle X-ray scattering/VP6
Introduction
Recognition and assembly are essential properties of the constituents of life and are required for the achievement of biological functions. The subtlety of the structural switches governing interactions between proteins is well illustrated in atomic detail by the architecture of spherical viruses (reviewed by Johnson and Speir, 1997). The capsid of spherical viruses is built from a limited number of proteins and often displays icosahedral symmetry. In most cases, the protein lattice at the surface of spherical viruses is predicted by the quasi-equivalence theory, i.e. the presence of 5-fold and local 6-fold axes (Caspar and Klug, 1962). Depending upon their location on the lattice, the subunits have different environments and make different contacts associated or not with conformational changes. The extent of the difference in the structure of each independent subunit appears to be specific for each virus. Accordingly, the process of assembly of spherical viruses is generally referred to as based either on the quasi-equivalence rule or on structural switches (Kellenberger, 1976). This distinction is often arbitrary since there are many examples of assemblies that are in between the two extreme cases. Despite considerable efforts, the structural basis underlying the assembly of large icosahedral viruses, and in particular the controlled formation of different types of contacts between identical subunits, is not yet fully understood.
Orbiviruses, reoviruses and rotaviruses are three genera of the family Reoviridae. They present similar morphologies, each having specific structural characteristics. Crystal structures of the bluetongue virus (BTV; an orbivirus) core (Grimes et al., 1998) and of the reovirus core (Reinisch et al., 2000) have been determined recently. In the case of BTV, the crystal structure shows the arrangement of the two concentric protein layers of the core in atomic detail. The subunits (protein VP7) forming the external layer exhibit a single conformation on the capsid lattice and make similar types of contacts (Grimes et al., 1998). Isolated BTV VP7 is, however, capable of adopting two strikingly different conformations (Grimes et al., 1995; Basak et al., 1997).
Rotaviruses have a segmented double-stranded RNA genome enclosed in a complex capsid (Prasad et al., 1988) formed by three concentric protein layers (Yeager et al., 1990). The proteins forming the capsid are VP2 (internal layer, with triangulation T = 1 and an asymmetric dimer in the icosahedral repeating unit), VP6 (intermediate layer, T = 13 symmetry), VP7 (external layer, T = 13) and VP4, which forms a spike inserted in the outermost two layers. In vitro, VP2, VP6 and VP7 self-assemble to form virus-like particles (VLPs). Different VLPs may be formed: VLP2/6/7 (Crawford et al., 1994), VLP2/6 and VLP2 (Labbé et al., 1991). The formation of VLPs requires the presence of VP2. However, VP6 alone, isolated from the virus, can form spherical or tubular aggregates (Ready and Sabara, 1987). VP6 can be overexpressed (Estes et al., 1987) and purified in large quantities. The atomic structure of VP6 has been determined by X-ray crystallography to 0.2 nm resolution and fitted into reconstructions of the viral particles (Mathieu et al., 2001).
Here we describe the different types of assemblies formed in vitro by VP6. Using small angle X-ray scattering (SAXS) and electron microscopy, we explored the conditions necessary for the self-assembly of VP6. We show that depending upon the pH, different types of particles (either spherical or tubular) are formed. To determine the interactions between VP6 trimers in these assemblies and their possible role in the capsid structure, we determined the structure of two types of tubes by electron cryomicroscopy (cryo-EM) and image processing methods to a resolution of 2.0 and 2.5 nm. The molecular envelope of the VP6 trimers is clearly evident in the reconstructions, and the atomic model of VP6 fits remarkably well, allowing the identification of the amino acids participating in the contacts. The reconstructions show that for both types of assemblies the helical repeating unit is a single dimer of VP6 trimers. Our data show that the particular contacts between these dimers of trimers are specified by their protonation state. These results, together with those resulting from fitting the VP6 trimer into the reconstructions of the virion (Mathieu et al., 2001), have important implications for understanding the assembly of both rotavirus particles in particular and macromolecular assemblies in general.
Results
Conditions for the self-assembly of VP6
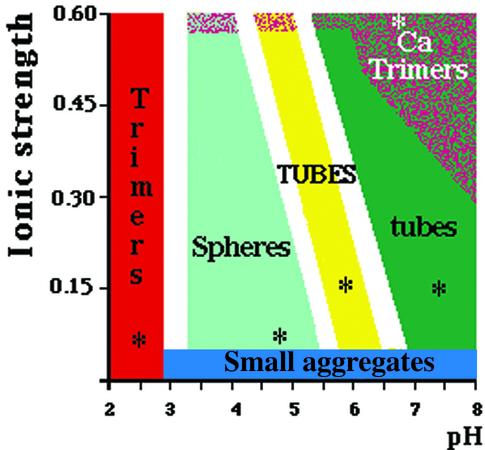
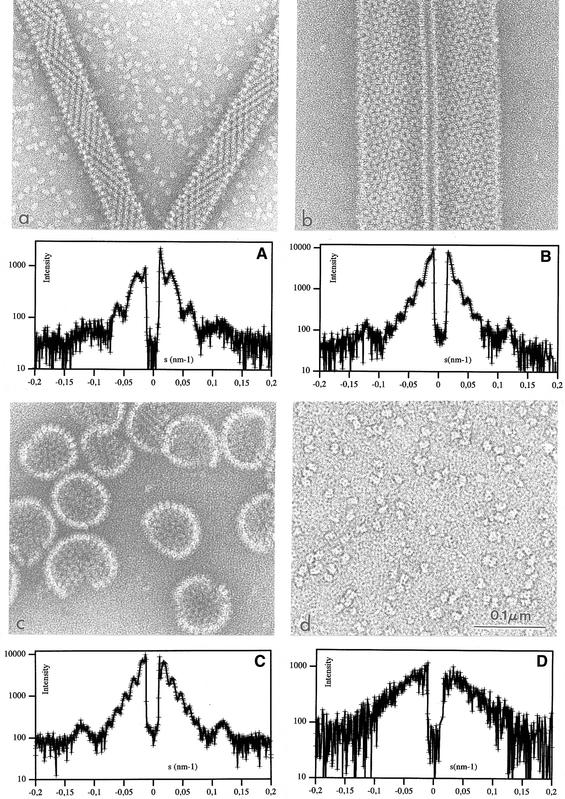
VP6 self-assembles into different types of particles depending on conditions such as pH, ionic strength and divalent cation concentration (Figure 1). Determination of the phase diagram of VP6 required the examination of a large number of physicochemical conditions. Negative staining was used in the initial screening because it is a fast preparation method for electron microscopy. To discard possible artifacts due to the preparation method, we also analyzed the samples by SAXS. In the absence of divalent cations, pH is the main parameter controlling the aggregation state of VP6. Above pH 7.0, we observe tubular particles with a diameter of ∼45 nm and a length of several micrometers (Figure 2a). The corresponding SAXS pattern is characterized by minima at 0.021, 0.049 and 0.077 nm–1 (Figure 2A). This profile is in agreement with the dimensions of the tubes observed by electron microscopy. Indeed, the expected minima for cylindrical or spherical objects are located at spatial frequencies roughly proportional to n/D, n being an integer and D the diameter of the particle. For pH values in the range 5.5–7.0, we observe larger tubes, with a diameter of 75 nm and several micrometers in length (Figure 2b). Accordingly, in what follows, we will refer to large and small tubes for helical particles observed below and above pH 7, respectively. The SAXS profile corresponding to the large tubes is characterized by minima at 0.012, 0.028, 0.042, 0.056 and 0.072 nm–1 (Figure 2B). In the pH range 3.0–5.5, we observe roughly spherical particles that are heterogeneous in size. From here on, we will refer to the latter as spheres. While most of the observed spheres have a diameter of 75 nm, particles with larger diameters are also present (Figure 2c). The corresponding SAXS pattern, displaying minima at 0.012, 0.029, 0.042, 0.057 and 0.070 nm–1 (Figure 2C), is very similar to the profile of the large tubes. All three SAXS patterns from tubes or spheres display a diffuse maximum at 0.12 nm–1 arising from the internal structure of the scattering objects. The VP6 particles, tubes and spheres alike exhibit a quasi- hexagonal surface lattice (a = ∼10 nm) of VP6 trimers. This lattice is clearly visible in micrographs containing projections of partially disrupted tubes that show only one side of the particle (data not shown; Petitpas et al., 1998). In contrast to the small tube preparations (Figure 2a), isolated VP6 trimers are very rare in the background of micrographs of both large tubes and spheres (Figure 2b and c).
Fig. 1. Phase diagram (pH and ionic strength) of VP6. The portions of the phase diagram where a particular assembly is the major constituent have been colored as follows: red, acidic trimer; light green, spheres; yellow, 75-nm-diameter tubes (TUBES); dark green, 45-nm-diameter tubes (tubes). When CaCl2 (or ZnCl2) is used to increase the ionic strength, up to a concentration of 100–200 mM, the phase diagram is similar to that obtained with NaCl. Above this concentration, calcium (or zinc) ions destabilize the assemblies and only VP6 trimers are present in solution (Ca trimers). More than 100 conditions were explored to determine this diagram. The white areas represent the uncertainty boundaries. The asterisks indicate conditions for which a particular assembly can be considered as a pure constituent.
Fig. 2. Electron microscopy by negative staining (panels labeled in lower case) and SAXS (panels labeled in upper case) characterization of the VP6 assemblies. (A) 45-nm-diameter tubes; (B) 75-nm-diameter tubes; (C) spheres; (D) VP6 Ca trimer.
Divalent cations (Ca2+ or Zn2+) do not affect the phase diagram of VP6 up to a concentration of ∼200 mM. However, above this concentration, only isolated trimers are detected by both electron microscopy and SAXS (Figure 2d and D; Petitpas et al., 1998). At very acidic pH (<3), we observe trimers independently of the concentration of divalent cations (data not shown). Low pH and Ca2+ trimers seem to be similar, as probed by SAXS, although small structural differences can not be ruled out.
Three-dimensional structure of helical assemblies of VP6
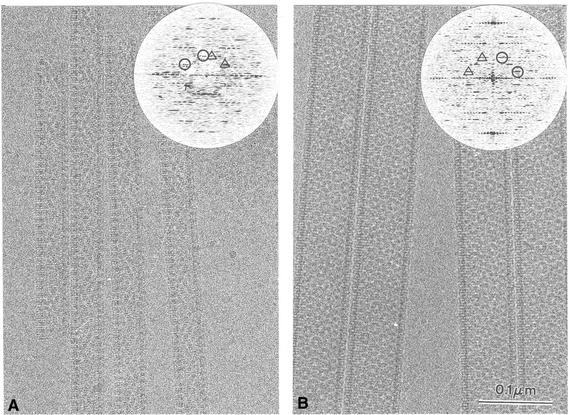
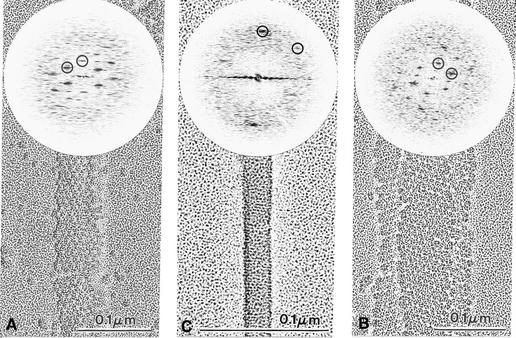
Electron cryomicrographs of small and large tubes are shown in Figure 3A and B, respectively. In contrast to negatively stained samples (Figure 2a and b), tubes embedded in vitrified ice display a constant diameter. Cryo-EM greatly minimizes flattening, thereby better preserving the symmetry of helical objects (Lepault, 1985). The optical diffraction patterns of images of both small and large tubes extend to a resolution better than 3.0 nm (insert in Figure 3). The selected patterns of the small and large tubes were indexed (see Materials and methods) with the selection rule (Klug et al., 1958) l = ±9n + 103m and l = ±35n + 293m and axial repeats of 82 and 122 nm, respectively. The + or – signs correspond to the two possible hands of the basic helix. We used tobacco mosaic virus (TMV) as a standard to determine the handedness of the helices and thereby the correct sign of the Bessel functions. In order to visualize a single side of the particles, we used freeze–drying followed by heavy metal rotary shadowing of the tubes (Figure 4A and C) and TMV (Figure 4B). The first three layer lines of the TMV pattern can be observed in the Fourier transforms of the images. Since the sign of the Bessel function for these layer lines is known (n = –16, n = 17 and n = 1 for the first, second and third, respectively; Holmes et al., 1972), the signs of the functions extracted from the VP6 diffraction patterns can be attributed. The correct selection rules for the small and large tubes are then l = –9n + 103m and l = –35n + 293m, respectively, so that the basic helix is left-handed in both cases.
Fig. 3. Images of tubes embedded in amorphous ice. (A) 45-nm-diameter tubes; (B) 75-nm-diameter tubes. The respective power spectra of the Fourier transform are inserted. Circles (triangles for the opposite side) define the reciprocal ‘base vectors’ a* and b* on which the transform can be indexed. They are ∼60° apart and their length is ∼0.115 nm.
Fig. 4. Images of small (A) and large (C) tubes freeze–dried and rotary shadowed with a film of tantalum–tungsten. Only the far side lattice is visualized under these conditions. For each type of tube, all images and corresponding Fourier transforms are similar. TMV was used as a reference (B) to determine the handedness of the pattern.
Layer lines were extracted from the Fourier transforms and averaged. Eight and four images were used for the small and large tubes, respectively. Coefficients up to 1.7 nm resolution were included in the reconstructions. Similar layer line averages were obtained when a Wiener filter (Lepault and Pitt, 1984) was applied (data not shown). To assess the quality of our layer lines and in particular the effect of the envelope of the transfer function (Frank, 1973), we compared the spherical averages of the Fourier coefficients with the corresponding SAXS profiles. The Wilson plot (in the range 0.01–0.2 nm–1) gives temperature factors of 3 and 16 nm2 for the small and large tubes, respectively. SAXS data to higher angles would be necessary in order to quantify better the effect of the envelope of the transfer function, but these measurements are difficult because the tubes are weak scatterers and the solutions are polydisperse. We therefore used an empirical factor of 1/3 to compensate for the effect of the temperature factors without overemphasizing the high-resolution frequencies. Accordingly, we corrected each coefficient in the three-dimensional reconstructions by exp(B × s2/3), where B is the corresponding temperature factor and s is the spatial frequency.
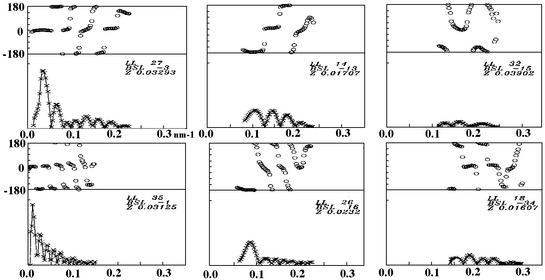
Preliminary reconstructions suggested the presence of 2-fold axes perpendicular to the helical axis. Such a symmetry was confirmed by the fact that we were able to find an origin of the Fourier transform for which the coefficients of the layer lines are very close to real numbers (Figure 5). The 2-fold symmetry was then imposed on the reconstructions. The resulting three-dimensional reconstructions for both small and large tubes are shown in Figure 6. The two reconstructions exhibit tower-like structures displaying local 3-fold symmetry, in agreement with the trimeric nature of VP6. The repeating unit of the helix contains a pair of trimers related by a radial dyad (Figure 6). The VP6 trimer is composed of two domains: a head (external) and a base (internal), displaying a central cavity that is clearly visible in our reconstructions. Because a 3-fold symmetry axis perpendicular to the helix axis is incompatible with helical symmetry, the local 3-fold symmetry of VP6 is broken at the level of the contacts with adjacent molecules, resulting in three different lateral contacts per trimer (see Figure 6C and D). In both reconstructions, one of the three contacts is weaker (w, W) than the other two, resulting in a ribbon-like appearance of the tube. In the small tubes, one of the two intertrimeric contacts within the ribbon shows a double density connectivity (d) and the other a single connection (s). In the large tubes, two similar double contacts are observed (D1 and D2). The double contact seems to be maintained in both types of tubes (d = D1 = D2).
Fig. 5. Amplitude and phase variations of three layer lines of the small (upper frames) and large tubes (lower frames). Typical strong (right frames), medium (center frames) and weak (left frames) amplitude layer lines are shown. The phases are close to 0 or 180°, particularly when the amplitudes are strong, indicating the presence of a 2-fold symmetry axis perpendicular to the tube axis. Phases are in degrees and amplitudes in arbitrary units. For each type of tube, the amplitudes are displayed on the same scale.
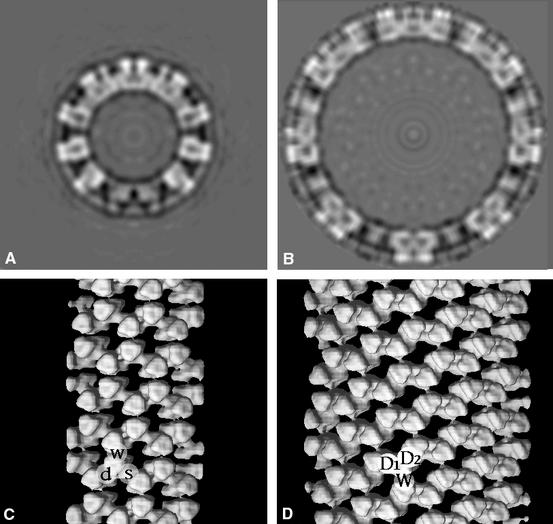
Fig. 6. Sections and three-dimensional representation of the reconstruction of the small (A and C) and large tubes (B and D). The three different contacts of each VP6 trimer are labeled d (D1 and D2), s and w (W) (lower case, small tube; upper case, large tube). Contact d (D1 and D2) displays a double density connectivity in contrast to contact s (single connectivity). Contacts d, D1 and D2 are similar. Contact w (W) is weak.
Fit of the atomic model of VP6 into the cryo-EM reconstructions
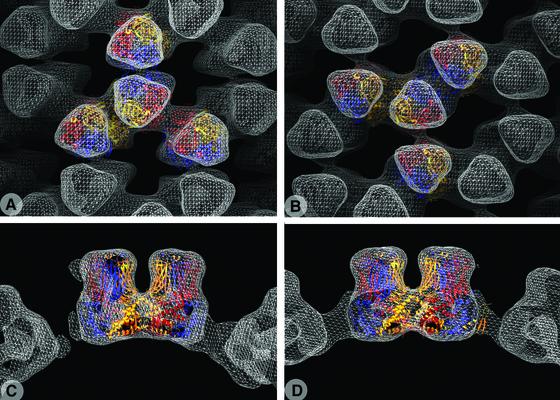
Figure 7 displays the fitting of the atomic model of VP6 into the three-dimensional reconstructions of both tubes. It shows in particular that the molecular envelope obtained by electron microscopy is very similar to that calculated from the X-ray structure. The excellent visual fit is verified by the values of the correlation coefficient (0.93 and 0.92) and the R-factor (0.35 and 0.42) between structure factors calculated from the reconstructions and from the fitted atomic model for small and large tubes, respectively. These figures preclude any important conformational change of VP6 in its different forms (i.e. in the three-dimensional crystals and in the helical arrays). The extent of the differences between intertrimeric contacts can be quantified by the root mean square deviation (r.m.s.d.) obtained by superposing a pair of trimers involved in a given contact on the other pairs. The figures are listed in Table I and indicate that the d, D1 and D2 contacts, for which the r.m.s.d. is <0.3 nm, are the same at the resolution of the reconstruction, confirming our visual observations. Each VP6 trimer thus makes three different contacts in the small tubes (d, s and w) and only two (D, D and W) in the large tubes. Figure 7C and D shows a section parallel to a plane containing the molecular 3-fold axes of the two trimers, centered on the d and D contact (small and large tubes, respectively) for comparison. The angle formed by the two trimer axes is the same, showing that the different curvatures of the two tubes derive from alternative packing of this particular dimer of trimers. Interestingly, the preserved contact (d, D1 or D2) is indistinguishable at this resolution from the most common intertrimeric contact found in the viral particle (Q contact; see Table I and Mathieu et al., 2001).
Fig. 7. Fit of the X-ray atomic model into the reconstruction of the small (A and C) and large tubes (B and D). While (A) and (B) are side views of the tubes, (C) and (D) are sections centered at contact d (D) and passing through neighboring trimers.
Table I. R.m.s.d. (nm) between pairs of trimers corresponding to three different contacts in the small and large tubes as well as representative pairs from the viral particle (PP, PP′ and P′D)a,b.
| Small tubes | Large tubes | Viral particle | ||||||
|---|---|---|---|---|---|---|---|---|
| |
s |
w |
D1 |
D2 |
W |
PP (N1) |
PP′(Q) |
P′D (N2) |
| d | 0.59 | 0.32 | 0.16 | 0.07 | 0.61 | 0.46 | 0.08 | 0.60 |
| s | 0.72 | 0.61 | 0.61 | 0.59 | 0.28 | 0.54 | 0.42 | |
| w | 0.24 | 0.32 | 0.49 | 0.64 | 0.32 | 0.69 | ||
| D1 | 0.12 | 0.58 | 0.52 | 0.14 | 0.66 | |||
| D2 | 0.65 | 0.50 | 0.10 | 0.66 | ||||
| W | 0.57 | 0.58 | 0.41 | |||||
aSee Mathieu et al. (2001) for definition of contacts Q, N1 and N2 in the viral particles.
bSee text for definition of the different contacts in the tubes (d, s, w, D1, D2 and W).
Discussion
In this work, we have characterized the structural polymorphism of recombinant rotavirus protein VP6 by determining its phase diagram as a function of pH and ionic strength, and by analyzing the effect of divalent cations. We found that pH is the main parameter controlling the type of interactions leading to different assemblies. Spherical particles were observed in the pH range 3.5–5.5, large tubes in the range 5.5–7, and small tubes above pH 7. These results suggest that the protonation state of VP6 defines the type of assembly, very probably by affecting specific lateral intertrimeric contacts. The accompanying manuscript (Mathieu et al., 2001) shows that the lateral surface of the VP6 trimer, which is implicated in the contacts, is negatively charged. Protons are thus required to counteract repulsive electrostatic forces. Accordingly, the stability of the assemblies seems to be a function of pH: isolated trimers are only visible in micrographs of small tubes (at pH >7). The latter observation shows that the critical concentration for these particles is higher than for assemblies formed at lower pH and indicates that small tubes are thermodynamically less stable.
All assemblies of VP6 display a quasi-hexagonal packing of trimers, which is destabilized by concentrations of divalent cations (Ca2+ and Zn2+) >100 mM. This suggests that VP6 possesses low affinity binding sites for the metals that will affect the intertrimer interaction when occupied. The X-ray structure indeed shows several calcium binding sites, which are involved mainly in the packing of trimers in the crystal (Mathieu et al., 2001).
The spherical particles formed by VP6 at pH <5.5 are heterogeneous in size, but the smallest spheres, with a diameter of ∼75 nm, are larger than viral double-layered particles or VLP2/6, which have an external diameter of 70 nm (Prasad et al., 1988). This observation highlights the importance of VP2 in the assembly of rotavirus particles. While protonated VP6 by itself has the capacity to form spherical assemblies, which probably display icosahedral symmetry, the correct geometry of the viral particle is determined by VP2. The VP2 layer in the viral particle must provide a positive electrostatic environment necessary to form the spherical particles at neutral pH; indeed, the negatively charged surfaces of interaction between VP6 trimers are found to extend towards the region that contacts VP2 (Mathieu et al., 2001).
In this work, we did not attempt to obtain icosahedral reconstructions of the spherical particles because their heterogeneity imposes a difficult selection process. We have focused our efforts on helical particles that are all identical under given conditions and determined their three-dimensional structure. The atomic model of the VP6 trimer fits the cryo-EM density very well, which allowed us to generate a crude atomic model for the tubes in order to examine the protein surfaces that participate in the different contacts. The nominal resolution of our reconstructions is 1.7 nm (see Materials and methods). However, comparison of electron densities calculated by back-transforming the structure factors of the atomic model with a series of resolution cut-offs shows that the effective resolution of the EM reconstructions is 2.0 and 2.5 nm for the small and large tubes, respectively. This is important to mention because the resolution limits quoted by electron microscopists are often ill-determined [effects of the contrast transfer function (CTF), partial completion of the data, among others].
The accuracy obtained by fitting atomic models into EM reconstructions of ∼2 nm resolution is generally accepted to be equal to 0.4 nm (Smith et al., 1993; Grimes et al., 1997). Accordingly, we have analyzed the types of contacts by superposing pairs of trimers related by three of the four alternative helical radial dyads of the p2 helical surface lattice. The r.m.s.d. in the superposition of such pairs (Table I) gives a quantitative measure of the similarity of the contacts. We have used a cut-off of 0.3 nm r.m.s.d. for deciding whether the reconstructions reveal significant differences in the trimer contacts (bold values in Table I). Table I shows that, in the large tubes, two of the contacts (D1 and D2) are very similar and can not be distinguished by the criterion defined above. In addition, it shows that this type of contact is also present in the small tubes (d). At first sight, this is a striking result because the two types of tubes have quite different curvatures. In fact, analysis of the crude atomic model shows that the different curvatures are obtained by alternative packing of a ‘rigid’ dimer of trimers, which in the large tubes can accommodate a second contact very similar to the intra-dimer contact. Interestingly, this ‘dimer of trimers’ is indistinguishable at this resolution from pairs of trimers related by the Q contact in the viral particle (see Table I and Mathieu et al., 2001). While W and probably w are characteristic contacts of the large and small tubes, the N2 (or P′D) contact is specific to the virus capsid. The trimers located close to the 3-fold axis of the icosahedral capsid present three Q contacts, another characteristic of icosahedral particles. In the absence of VP2, spherical particles (which probably exhibit icosahedral symmetry) are only formed at low pH, suggesting that VP6 trimers can only make three Q (d, D1 or D2) contacts when they are completely protonated. At intermediate pH, the assemblies show that this contact is adopted twice (large tubes), and only once at neutral pH (small tubes). These observations suggest that all assemblies of VP6 are controlled by the protonation state of the VP6 subunits forming the trimer. The charge distribution on the VP6 trimer can be modified by the interaction of VP6 with other proteins such as VP2.
A simple model accounts for the process of VP6 assembly: if we consider that only one residue is responsible for the process of VP6 assembly, depending upon the pH, up to three residues can be charged. The 3-fold symmetry of the charge distribution is lost when one or two monomers are charged. We can then suppose that assembly of spheres, large tubes and small tubes requires trimers having three, two and one neutral subunits, respectively. VP6’s property of forming different contacts depending upon the charge may play an important role in the formation of viral particles. This property can also be generalized to other proteins and thus explain the flexibility of macromolecular assemblies.
Materials and methods
Protein preparation
Rotavirus VP6 was produced and purified as described by Petitpas et al. (1998). Briefly, Spodoptera frugiperda caterpillars were infected with the recombinant baculovirus (Tosser et al., 1992) and, 4 days post-infection, ground with a polytron in a 1:1 mixture of Freon 113 and 50 mM PIPES pH 6.6, 4 mM dithiothreitol, 10 mg/ml aprotinin, 20% glycerol. VP6 tubes, present in the aqueous phase, were purified by differential centrifugation. The pellet was solubilized in 500 mM CaCl2, 50 mM MOPS pH 7.0 and the resulting solution subjected to size exclusion chromatography (Superose 6HR 10/30; Pharmacia) using the same buffer. The various forms of VP6 were recovered after dialysis of the fractions corresponding to the major peak (VP6 trimers) in appropriate buffers. Depending upon the desired pH range, different buffers, at 10 or 50 mM, were used: glycine–HCl (pH <3.0), sodium acetate–acetic acid (pH 3.0–5.5); NaOH–MOPS (pH 5.5–7.0); or Tris–HCl (pH 7.0–8.5). All experiments were carried out at room temperature (20°C).
Electron microscopy
Negative staining was performed with a 2% uranyl acetate solution. Freeze–drying and shadowing were performed as described by Lepault et al. (1981). The samples were deposited on an air glow-discharged grid coated with a carbon film. The excess was blotted with a filter paper and the grid plunged into liquid nitrogen. The grids were mounted in a rotating holder under liquid nitrogen and the holder transferred into a high-vacuum evaporator (Escaig and Nicolas, 1976). Samples were maintained at –80°C for at least 2 h. Grids rotating at a speed of ∼30 turns/min were shadowed with a 2-nm-thick tungsten–tantalum film. Evaporation was achieved in 1–2 min. An automated shutter, alternately opened and closed, minimized the temperature rise of the sample during the metal evaporation (Costello and Escaig, 1989). Images of negatively stained and shadowed samples were recorded on SO163 Image Film (Kodak) developed for 5 min in full-strength D19.
Cryo-EM was performed as described earlier (Adrian et al., 1984). Samples were observed with a Philips CM12 microscope operated at 100 kV and a Philips CM200 equipped with a field emission gun operated at 200 kV. Micrographs were recorded at magnifications of ×35 000 and ×38 000 on SO163 Image Film developed for 12 min in full-strength D19.
Image processing
The quality of the negatives was controlled on an optical bench. The best negatives were scanned with an Optronics P1000 densitometer using a 25 µm raster size. Tube images were boxed to a length corresponding to three or four axial repeats and embedded in 512 × 1024 pixel images. Image processing was performed as described by DeRosier and Moore (1970). The Fourier transforms of the images were calculated and the helix transforms were indexed. Pattern indexation is a difficult step (Moody, 1971), which is achieved by finding the helical net that best predicts the axial position of the layer lines constituting the Fourier transform and is compatible with the apparent diameter of the particle. At this stage, only particles obeying the same helical selection rule and diffracting to a resolution better than 3 nm were processed further. In particular, we selected particles that had the same axial repeats. For both tubes, no overlap of Bessel functions occurs at the resolution at which we are working. The indexed layer lines were then extracted after corrections for the tilt of the particle and the position of the origin on the particle axis. Particles tilted by >4° were discarded. Initially, image analysis was performed on the 12 strongest layer lines that can be seen in the pattern (low-resolution layer line set). Each layer line contained 60–100 sample points, allowing comparisons on >800 sample points. For each image, the far and near side layer lines were averaged if the phase residual between them was <60°; otherwise, the image was discarded. The averaged layer lines were corrected for the CTF effects either by applying a Wiener filter (Lepault and Pitt, 1984) or by just adding 180° to the CTF inverted coefficients (Erickson and Klug, 1971). The corrected layer lines were set to a common origin (Amos, 1976). The phase residuals between different images were <45°. The layer lines were then averaged and a reconstruction calculated. For both types of tubes, the maps strongly suggested the presence of a dyad axis perpendicular to the tube axis. We therefore searched an origin for which the Fourier coefficients were closest to real numbers. Indeed, origins can be determined so that the phase residual between the layer lines and their closest values to 0 or 180° is <20°. The presence of the dyad axis allowed a strategy for a high-resolution layer line set to be obtained (Unwin, 1993). All possible layer lines up to a resolution of 1.7 nm (55 layer lines) were extracted from the Fourier transforms of the selected images and then averaged with the origin parameters (shift to common origin plus centering) found during the building of the low-resolution layer line set. Each layer line was then cut radially. The smallest radius was defined as six sample points before the first maximum of the Bessel function. The position of the first maximum is defined by (1.03n + 1)/2πR, where n is the Bessel function order of the layer line and R the maximum radius of the particle. The largest radius of the layer line is defined by the position where the phase of the Fourier coefficient differs by >40° from a value equal to 0 or 180. With this procedure, 41 and 33 layer lines were retrieved for the small and large tubes, respectively. The spatial frequency of the highest resolution Fourier coefficient included in the layer line set corresponds to 1.7 nm. The layer lines arise from different images (eight and four for small and large tubes, respectively) under-focused by 1–2.8 µm. The averaging of data arising from images taken with different focus minimizes the effects of the CTF. The loss of information in the minima of the CTF for an image is compensated by the data from another image. Plots of the sum of the moduli of CTF show that the Fourier coefficients are well transferred in the spatial frequency range 0.1–0.5 nm–1 (data not shown). The phase residual between the selected layer lines and their closest values to 0 or 180° is <15°. All reconstructions shown have been calculated with an imposed dyad axis. They are, however, similar to those calculated with raw phases (data not shown).
Small angle X-ray diffraction
SAXS experiments were defined initially on a bench mounted on a rotating anode generator (GX3; Elliot), operated at 800 W with a 100 µm cup. The linear X-ray beam is focused with a gold-coated mirror. Two adjustable slits minimize the parasitic scattering. In the recording plane, the half-width of the X-ray beam is ∼0.015 × 5 mm. The specimen to detector distance used here was 870 mm. To reduce air scattering, an evacuated tube was placed between the specimen and the detector. The window nearest to the sample was a thin mica sheet and that closest to the detector a mylar sheet. Samples were contained in a 1-mm-thick cell with mica windows. X-rays were detected with a linear position-sensitive proportional counter (Gabriel, 1977).
Experiments were also performed on the small angle instrument D24 (Depautex et al., 1987) using synchrotron radiation from a bending magnet of the DCI storage ring at LURE (Orsay, France). The data acquisition system has already been described (Boulin et al., 1986). The sample to detector distance was 2577 mm and the wavelength of the X-rays was 1.488 Å (Ni K absorption edge). Samples were contained in a quartz capillary under vacuum (Dubuisson et al., 1997) with the temperature maintained at 20°C.
Comparison of EM and SAXS data
The layer line intensity was spherically averaged and interpolated at the same spatial frequency values as those of the SAXS pattern. This spherical average was then divided by the SAXS profile, and the logarithm of this ratio was plotted against the square of the spatial frequency and fitted with a straight line. The slope of the line is the relative temperature (B) factor. For the small and large tubes, the B-factors are equal to 3 and 16 nm2, respectively, in the spatial frequency range 0.01–0.2 nm–1. While the first factor is in agreement with previous estimates (∼5 nm; Grimes et al., 1997; Thuman-Commike et al., 1999), the second one is larger. The temperature factor accounts for the envelope of the contrast transfer function as well as disorder in the object induced by the preparation method. The larger the diameter of the helical object, the more susceptible it is to distortion, and the larger the contribution to the temperature factor. In the absence of electron diffraction data, it is impossible to distinguish the respective contributions of the two effects. In order to avoid overemphasizing the weight of erroneous high-resolution terms, we weighted the temperature factor corrections by a factor of 1/3. Such corrections, associated or not with a Wiener filter, do not drastically alter the reconstructions. In particular, no internal structure within the envelope of the VP6 trimer can be obtained, indicating that improvements in the maps do not rely on a better estimate of the amplitude of the low-resolution Fourier coefficients, but on measurements of higher resolution terms.
Fit of the atomic model in the reconstruction
The atomic model was fitted by a least square minimization procedure (J.Navaza, in preparation; see also Mathieu et al., 2001). The solution obtained with this method is similar to that obtained visually using program O (Jones et al., 1991), showing that the resolution of the reconstruction is good enough to place the crystallographic model of VP6 unambiguously by visual inspection.
The correlation factor (CC) and the R-factor were calculated as: CC = Σh (FobshFcalc*h)/[Σh (Aobsh)2 (Acalch)2]1/2 and R = Σh (Aobsh – Acalch)/Σh Aobsh, where Fobs and Fcalc are the complex Fourier coefficients, Aobs and Acal are the amplitude of the observed and calculated Fourier coefficients, respectively, and the asterisk denotes complex conjugation. The calculated Fourier terms were computed using X-ray atomic scattering factors.
Acknowledgments
Acknowledgements
We thank Drs Stephen Fuller and Kevin Leonard (EMBL, Heildelberg, Germany) for allowing us to use their Philips CM 200 FEG microscope. We acknowledge the FRM, the FRFMMIP (to J.C. and F.A.R) and the PCV program of the CNRS for financial support.
References
- Adrian M., Dubochet,J., Lepault,J. and McDowall,A.W. (1984) Cryo-electron microscopy of viruses. Nature, 308, 32–34. [DOI] [PubMed] [Google Scholar]
- Amos L.A. (1976) Combination of data from helical particles: correlation and selection. J. Mol. Biol., 99, 65–73. [DOI] [PubMed] [Google Scholar]
- Basak A.K., Grimes,J.M., Gouet,P., Roy,P. and Stuart,D.I. (1997) Structures of orbivirus VP7: implications for the role of this protein in the viral life cycle. Structure, 5, 871–883. [DOI] [PubMed] [Google Scholar]
- Boulin C., Kempf,R., Koch,M.H.J. and McLaughlin,S.M. (1986) Data appraisal, evaluation and display for synchrotron radiation experiments: hardware and software. Nucl. Instrum. Methods, A249, 399–407. [Google Scholar]
- Caspar D.L.D. and Klug,A. (1962) Physical principles in the construction of regular virus. Cold Spring Harb. Symp. Quant. Biol., 27, 1–27. [DOI] [PubMed] [Google Scholar]
- Costello M.J. and Escaig,J. (1989) Preparation of thin, fine-grained, tantalum metal replicas for freeze-fracture electron microscopy. Scanning Microsc. Suppl., 3, 189–199. [PubMed] [Google Scholar]
- Crawford S.E., Labbe,M., Cohen,J., Burroughs,M.H., Zhou,Y.J. and Estes,M.K. (1994) Characterization of virus-like particles produced by the expression of rotavirus capsid proteins in insect cells. J. Virol., 68, 5945–5952. [DOI] [PMC free article] [PubMed] [Google Scholar]
- Depautex C., Desvignes,C., Feder,P., Lemonnier,M., Bosshard,R., Leboucher,P., Dagneaux,D., Benoit,J.-P. and Vachette,P. (1987) The small angle X-ray scattering instrument D24. In Activity Report 1985–1987, LURE, Orsay, France, p. 75.
- DeRosier D.J. and Moore,P.B. (1970) Reconstruction of three-dimensional images from electron micrographs of structures with helical symmetry. J. Mol. Biol., 52, 255–369. [DOI] [PubMed] [Google Scholar]
- Dubuisson J.M., Decamps,T. and Vachette,P. (1997) Improved signal-to-background ratio in small-angle X-ray scattering experiments with synchrotron radiation using an evacuated cell for solutions. J. Appl. Crystallogr., 30, 49–54. [Google Scholar]
- Erickson H.P. and Klug,A. (1971) Measurement and compensation of defocusing and aberrations by Fourier processing of electron micrographs. Philos. Trans. R. Soc. Lond. B Biol. Sci., 261105–118. [Google Scholar]
- Escaig J. and Nicolas,G. (1976) Cryo-fractures de matériel biologique réalisées à très basse températures en ultra-vide. C. R. Acad. Sci. Paris Sér. D, 283, 1245–1248. [PubMed] [Google Scholar]
- Estes M.K., Crawford,S.E., Penaranda,M.E., Petrie,B.L., Burns,J.W., Chan,W.K., Ericson,B., Smith,G.E. and Summers,M.D. (1987) Synthesis and immunogenicity of the rotavirus major capsid antigen using a baculovirus expression system. J. Virol., 61, 1488–1494. [DOI] [PMC free article] [PubMed] [Google Scholar]
- Frank J. (1973) The envelope of electron microscopic transfer functions for partially coherent illumination. Optik, 38, 519–536. [Google Scholar]
- Gabriel A. (1977) Position sensitive X-ray detector. Rev. Sci. Instrum., 48, 1303–1305. [Google Scholar]
- Grimes J., Basak,A.K., Roy,P. and Stuart,D. (1995) The crystal structure of the bluetongue virus VP7. Nature, 373, 167–170. [DOI] [PubMed] [Google Scholar]
- Grimes J.M., Jakana,J., Ghosh,M., Basak,A.K., Roy,P., Chiu,W., Stuart,D.I. and Prasas,B.V.V. (1997) An atomic model of the outer layer of the bluetongue virus core derived from X-ray crystallography and electron cryomicroscopy. Structure, 5, 885–893. [DOI] [PubMed] [Google Scholar]
- Grimes J.M., Burroughs,J.N., Gouet,P., Diprose,J.M., Malby,R., Zientaras,S., Mertens,P.P.C. and Stuart,D.I. (1998) The atomic structure of the bluetongue virus core. Nature, 395, 470–477. [DOI] [PubMed] [Google Scholar]
- Holmes K.C., Mendelkow,E. and Barrington Leigh,J. (1972) The determination of the heavy atom positions in tobacco mosaic virus from double heavy atom derivatives. Naturwissenschaften, 59, 247–254. [DOI] [PubMed] [Google Scholar]
- Johnson J.E. and Speir,J.A. (1997) Quasi-equivalent viruses: a paradigm for protein assemblies. J. Mol. Biol., 269, 665–675. [DOI] [PubMed] [Google Scholar]
- Jones T.A., Zou,J.Y., Cowan,S.W. and Kjeldgaard,M. (1991) Improved methods for building protein models in electron density maps and the location of errors in these models. Acta Crystallogr. A, 47, 110–119. [DOI] [PubMed] [Google Scholar]
- Kellenberger E. (1976) DNA viruses. Philos. Trans. R. Soc. Lond. B Biol. Sci., 276, 3–13. [DOI] [PubMed] [Google Scholar]
- Klug A., Crick,F.H.C. and Wyckoff,H.W. (1958) Diffraction by helical structures. Acta Crystallogr., 11, 199–213. [Google Scholar]
- Labbé M., Charpilienne,A., Crawford,S.E., Estes,M.K. and Cohen,J. (1991) Expression of rotavirus VP2 produces empty core like particles. J. Virol., 65, 2946–2952. [DOI] [PMC free article] [PubMed] [Google Scholar]
- Lepault J. (1985) Cryo-electron microscopy of helical particles: TMV and T4 polyheads. J. Microsc., 140, 73–80. [DOI] [PubMed] [Google Scholar]
- Lepault J. and Pitt,T. (1984) Projected structure of unstained frozen–hydrated T-layer of Bacillus brevis. EMBO J., 3, 101–105. [DOI] [PMC free article] [PubMed] [Google Scholar]
- Lepault J., Weiss,H., Homo,J.-C. and Leonard,K. (1981) Comparative electron microscopic studies of partially negatively stained, freezed-dried and freeze-fractured cytochrome reductase membrane crystals. J. Mol. Biol., 149, 275–284. [DOI] [PubMed] [Google Scholar]
- Mathieu M., Petitpas,I., Navaza,J., Lepault,J., Kohli,E., Pothier,P., Prasad,B.V.V., Cohen,J. and Rey,F.A. (2001) Atomic structure of the major capsid protein of rotavirus: implications for the architecture of the virion. EMBO J., 20, 1485–1497. [DOI] [PMC free article] [PubMed] [Google Scholar]
- Moody M.F. (1971) Application of optical diffraction to helical structures in the bacteriophage tail. Philos. Trans. R. Soc. Lond. B Biol. Sci., 261, 181–195. [DOI] [PubMed] [Google Scholar]
- Petitpas I., Lepault,J., Vachette,P., Charpilienne,A., Mathieu,M., Kohli,E., Pothier,P., Cohen,J. and Rey,F. (1998) Crystallization and preliminary X-ray analysis of rotavirus protein VP6. J. Virol., 72, 7615–7619. [DOI] [PMC free article] [PubMed] [Google Scholar]
- Prasad B.V., Wang,G.J., Clerx,P.M. and Chiu,W. (1988) Three-dimensional structure of rotavirus. J. Mol. Biol., 199, 269–275. [DOI] [PubMed] [Google Scholar]
- Ready K.F.M. and Sabara,M. (1987) In vitro assembly of bovine rotavirus nucleocapsid protein. Virology, 157, 189–198. [DOI] [PubMed] [Google Scholar]
- Reinisch K.M., Nilbert,M.L. and Harrison,S.C. (2000) Structure of the reovirus core at 3.6 Å resolution. Nature, 404, 960–967. [DOI] [PubMed] [Google Scholar]
- Smith T.J. et al. (1993) Structure of human rhinovirus complexed with Fab fragments from a neutralizing antibody. J. Virol., 67, 1148–1158. [DOI] [PMC free article] [PubMed] [Google Scholar]
- Thuman-Commike P.A., Tsuruta,H., Grenne,B., Prvelige,P.E., King,J. and Chiu,W. (1999) Solution X-ray scattering-based estimation of electron cryomicroscopy imaging parameters for reconstruction of virus particles. Biophys. J., 76, 2249–2261. [DOI] [PMC free article] [PubMed] [Google Scholar]
- Tosser G., Labbe,M., Bremont,M. and Cohen,J. (1992) Expression of the major capsid protein VP6 of group C rotavirus and synthesis of chimeric single-shelled particles by using recombinant baculoviruses. J. Virol., 66, 5825–5831. [DOI] [PMC free article] [PubMed] [Google Scholar]
- Unwin N. (1993) Nicotinic acetylcholine receptor at 9 Å resolution. J. Mol. Biol., 229, 1101–1124. [DOI] [PubMed] [Google Scholar]
- Yeager M., Dryden,K.A., Olson,N.H., Greenberg,H.B. and Baker,T.S. (1990) Three-dimensional structure of rhesus rotavirus by cryoelectron microscopy and image reconstruction. J. Cell Biol., 110, 2133–2144. [DOI] [PMC free article] [PubMed] [Google Scholar]


