Abstract
CD59 blocks formation of the membrane attack complex of complement by inhibiting binding of C9 to the C5b-8 complex. To investigate a role for CD59 in promoting T cell responses, we compared T cell activation in CD59a-deficient (Cd59a−/−) and wild-type (WT) mice after in vitro stimulation and after infection with recombinant vaccinia virus. Virus-specific CD4+ T cell responses were significantly enhanced in Cd59a−/− mice compared to WT mice. Similarly, Cd59a−/− T cells responded more vigorously to in vitro stimulation with CD3-specific antibodies compared to WT mice. This effect of CD59a on T cell proliferation was found to be complement-independent. Collectively, these results demonstrate that CD59a down-modulates CD4+ T cell activity in vitro and in vivo, thereby revealing another link between complement regulators and T cell activation.
Keywords: viral, Cell proliferation, T Cells
Introduction
Human CD59 is a 18– 20 kDa GPI-anchored protein expressed in all circulating cells and in most tissues (1). In common with other GPI-anchored proteins, it is found in membrane microdomains, lipid rafts, which serve as platforms for antigen receptor signaling complexes in lymphocytes. CD59 acts as a complement (C) regulator by inhibiting the formation of the membrane attack complex (MAC) (2). Others have suggested that CD59 also acts as a costimulatory molecule for T cell activation. Ab-mediated cross-linking of CD59 on PMA-treated human T cells caused enhanced proliferation and IL-2 production (3).
In order to explore the role of CD59 in T cell activation in vivo, we examined T cell function in mice lacking the species analogue, CD59a (4). T cell activity was compared in Cd59a−/− and Cd59a+/+ (WT) mice after in vitro stimulation and after infection of mice with recombinant vaccinia virus (rVV). CD8+ T cell responses were unaltered in the absence of CD59a; however, CD4+ T cells displayed enhanced proliferation to several stimuli both in vivo and in vitro. C inhibition did not influence the enhanced responses, indicating that CD59a modulates CD4+ T cell activation independent of C.
Materials and Methods
Mice
C57BL/6 (H-2b) mice (WT) were obtained from Harlan (Oxford, UK). B6.129- Cd59atm1Bpm (Cd59a−/−) mice were generated as previously described (4) and back-crossed onto the C57BL/6 background for 8 generations. Cd59a−/− mice were intercrossed with the B6.129S4-C3tm1Crr (C3−/−) mice (5)also on the C57BL/6 background. Experiments were performed in compliance with Home Office regulations.
Cell Culture
Yac-1 cells, T cells and V8E, a mouse CD4+ T cell hybridoma (6)( Provided by Dr Annette Oxenius, University of Zurich), were maintained in RPMI medium supplemented with 10% FCS, penicillin-streptomycin, L-glutamine, and 2-ME. V8E cells were transfected with CD59a using standard methods.
Infection with Recombinant Vaccinia Virus and Determination of Anti-Virus Response
Recombinant vaccinia virus (VV) expressing the gp of lymphocytic choriomeningitis virus (LCMV) has been previously described (7). Mice were injected ip with 50 μl of rVVGP at 108 PFU/ml. At day 3 and 8 after infection, ovaries were harvested for virus titres and immunostaining and spleens were harvested for CTL assays and T cell proliferation assays. For memory responses, spleens were harvested 6 weeks after infection and CTL assays and CD4+ T cell proliferation assays were performed.
Fluorescence Staining
Cy5 conjugated antibodies were utilized for CD4 staining (Caltag Laboratories, Burlingame, CA). Cells were incubated with 5 μg/ml of mAb for 30 min washed and resuspended in FACS buffer. IFNγ staining was performed using IFNγ–FITC mAbs (BD PharMingen, San Diego, CA) after incubating ovary-derived lymphocytes for 4 hr at 37°C in the presence of ionomycin (1μg/ml), PMA (20ng/ml) and monensin (3μM) (Sigma-Aldrich). CFSE staining (Molecular Probes, Eugene, OR) was carried out by incubating the cells for 10 min at 37°C with 0.5 μM CFSE. In all cases, cells were resuspended in FACS buffer and analysed by FACS (FACS-CALIBUR®; Beckton Dickinson, CA).
Immunoprecipitation and western Blotting
Immunoprecipitation was performed as previously described (8). Lysates of mouse CD4+ or CD8+ T cells were incubated with 10 μg of mouse mAb against CD59a (mCD59.4) (9) and 50 μl of protein A-Sepharose beads for 2 h at 4°C .The immunoprecipitates were washed in lysis buffer and boiled in nonreducing SDS-PAGE sample buffer. Beads were removed by centrifugation, supernatants resolved on non-reducing 12% SDS-PAGE, and transferred to nitrocellulose. The membrane was probed with the CD59a-specific mAb mCD59.1 as described previously (9).
T Cell Proliferation
CD4+ and CD8+ T cells from single cell suspensions of splenocytes were purified by positive MACS MicroBeads selection (Miltenyi Biotec). For APCs, spleen cells were panT depleted (dynabeads) and irradiated with 2400 cGy CD4+ or CD8+ cells (2x10⁴ cells) were incubated with 105 APCs and 1μg/ml of anti-CD3 mAb in a 96 multi-well (MW) plate. Cell proliferation was assessed by thymidine incorporation or CFSE FACS analysis at day 3. For anti-CD28 and anti-CD3 mAb stimulation, 105 CD4+ T cells were incubated in a 96MW plate with 2 μg/ml of anti-CD28 and 2 μg/ml of anti-CD3 (Leinco Technologies, St. Louis, MO). Vaccinia-specific CD4+ T cell proliferation was performed by incubation of 105 CD4+T cells with 6x10⁵ irradiated splenocytes and 2.5 μg/ml of P13 peptide (GLNGPDIYKGVYQFKSVEFD) (LCMV-GP, I-Ab) or P61 peptide (SGEGWPYIACRTSVVGRAWE) (LCMV-NP, I-Ab). CD8+ T cell proliferation was carried out against the Db-restricted peptide gp33. Cells were incubated for 6 days and thymidine added for the last 18 hr.
Exogenous Incorporation of CD59a
CD59a was purified as previously described (10). CD4+ T cells (5x10⁶ cells) were incubated with 5μg of CD59a for 20 min at 37°C to permit incorporation via the GPI anchor. Cells then were washed and incubated for another 2 hr to allow migration of CD59a into lipid rafts (11).
CTL Assay
Spleen cells (4x10⁶ cells) were stimulated in vitro with 1x10⁶ gp33 (KAVYNFATM) (LCMV-GP, Db) peptide-loaded (10−5 M) splenocytes and IL-2 was added at day 2. After one week, cells were re-stimulated with 1x10⁶ gp33 splenocytes and IL-2 (10 U/ml). rVV-specific CTL activity was measured 5 days later as described (12).
Virus Titres
rVVGP titres were determined in ovaries at day 3 and 8 post infection. Ovaries were homogenized and incubated on a monolayer of TK− cells as described (13).
CD59a Cross-linking and IL-2 ELISA
V8E, a mouse CD4+ T cell hybridoma negative for CD59a expression by FACS, was transfected with CD59a as described (9). Purified CD4+ T cells from Cd59a−/− or WT mice or V8E cells, untransfected or transfected with CD59a, were incubated with mCD59.1 or isotype control mAb for 15 min at 4°C. After washing, cells were plated at 105 cells/well in triplicate in a 96 MW plate. Where appropriate, 5μg/ml of F(ab’)2 rabbit anti-rat IgG Ab (Serotec, Oxford, UK) was added to the wells to cross-link (3). Cells were activated with 0.5 ng/ml PMA and incubated at 37°C. After 18 hrs, IL-2 was measured by ELISA according to the manufacturer’s instructions (BD, Pharmingen).
C Inhibition
For inhibition of C activity in vitro, 1 μg/ml recombinant human soluble CR1 (sCR1; gift of T Cell Sciences) was added to each well of a 96 MW plate. Cell proliferation was assayed after 3 days by thymidine incorporation. For in vivo inhibition, mice were injected iv. daily with 20mg/kg sCR1. To confirm C inhibition, mice were bled daily and serum tested for C haemolytic activity using rabbit erythrocytes (RbE) sensitized with mouse anti-RbE antiserum. Serial dilutions of test or control sera were incubated with 2% RbE. Hemolysis was measured by absorbance in supernatants at 415nm (A415 (sample)-A415 (min) / A415 (max)-A415(min)x100). Haemolytic activity in samples taken 24 h post-treatment was always <15% of controls.
Results and Discussion
Induction of IL-2 Production by Anti-CD59 mAb
Previous cross-linking experiments indicate that human CD59 acts as an accessory molecule for T cell activation (3). In order to confirm this finding in the mouse system, we stimulated purified splenic CD4+ T cells with PMA, CD59a-specific mAb and cross-linking anti-Ig. CD59a cross-linking on mouse CD4+ T cell did not induce IL-2 production (Figure 1A). Since this may be due to the low level of CD59a on mouse lymphocytes (as assessed by FACS (9)) we overexpressed CD59a in a murine CD4+ T cell hybridoma (V8E) (6). Transfected cells expressed CD59a (Figure 1C) and, when stimulated with PMA, cross-linking of CD59a, yielded enhanced IL2 production in comparison to untransfected cells subjected to the same stimuli (Figure 1B). These data indicate that when CD59a is expressed at a sufficient level on murine T cells, cross-linking CD59a, does enhance IL2 production in a manner similar to that described for human T cells.
Figure 1. CD59a cross-linking induces secretion of IL-2.
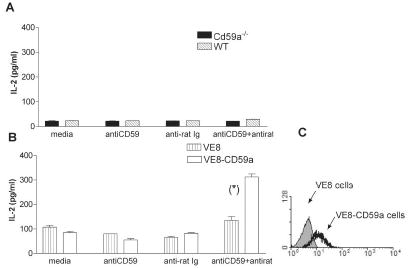
Expression of CD59a inVE8 and VE8-CD59a cells was detected by flow cytometry (C). Purified CD4+ splenic T cells from WT and Cd59a−/− mice (A) or VE8 and VE8-CD59a cells (B) were incubated with mCD59.1 mAb followed by an anti-Ig Ab. After 18 hrs, IL-2 production was detected by ELISA.Values shown are mean ± SD. The results are representative of two experiments. Statistical significance (*) was evaluated using Student’s T test (p<0.001).
Mouse T Cells Express CD59a
CD59a expression is not detectable on murine lymphocytes by FACS (9). More sensitive methods were therefore employed to determine whether primary murine CD4+ and CD8+ T cells express CD59a. CD59a expression was detectable by RT-PCR (data not shown) and immunoprecipitation followed by western blotting (Figure 2A) in both, CD4+ and CD8+ T cells from WT but not Cd59a−/− mice.
Figure 2. rVVGP specific CD8+ T cell activity and CD4+T cell proliferation.
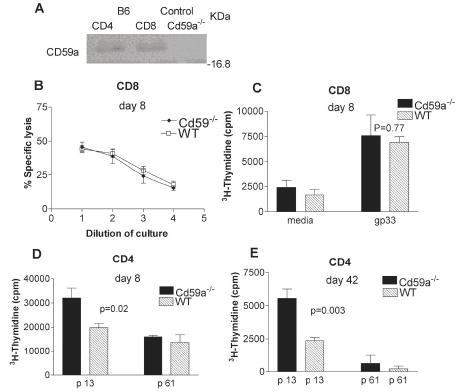
CD59a expression was analyzed from immunoprecipitates of purified CD4+ T and CD8+ T cells from WT and control T cells from Cd59a−/− mice. Expression was detected using specific antibodies in western blotting (A). CD8+ T cell cytotoxic activity (B) and cell CD8+ T cell proliferation (C) was analyzed at day 8 after rVVGP infection. Non-specific lysis in the experiment shown in (B) was less than 10%. CD4+ T cells purified from rVVGP infected mice were tested for proliferation against peptides p61 and p13 8 days (D) and 6 weeks (E) post-infection. Mice were analyzed individually and values shown are the mean ± SEM (n= 3 mice/group). The results are representative of three independent experiments. Statistical significance was evaluated using Student’s T test.
Immune Responses in Cd59a−/− Mice Following Infection with rVV
In order to determine whether physiological levels of CD59a plays any role in modulation of murine T cell activation in vivo, T cell responses were compared in WT and Cd59a−/− mice after rVVGP infection. rVVGP contains several MHC-restricted peptide epitopes recognized by T cells in WT mice. One peptide, gp33, derived from the gp, is presented by H2-Db to CD8+ T cells (14), while another epitope, p13, is presented by H2-I-Ab to CD4+ T cells (12). No significant difference in CTL activity (Figure 2B) or antigen-specific CD8+ T cell proliferation (Figure 2C) was observed between groups of mice at 8 days after infection. There was also no significant difference in CTL activity, measured at day 42 after infection (data not shown). Virus-specific CD4+ T cell proliferation assays performed at the same time-points revealed stronger proliferative responses to the specific peptide, p13 in Cd59a−/− mice compared to WT mice whilst no differences were observed in background proliferation to an irrelevant peptide p61, (Figures 2D and E). These data are similar to those reported recently using CD55-deficient mice where CD4+ T lymphocytes from these mice were found to proliferate more vigorously in response to a range of antigens compared to WT mice (15, 16). Another study reported that T cells isolated from Ly-6A-deficient animals also proliferate more vigorously than those isolated from their WT counterparts (17). Interestingly Ly-6A, CD59 and CD55 are all GPI-anchored molecules localized in lipid rafts, and all have previously been found in cross-linking studies to promote T cell activation in vitro (3, 17, 18). Despite this, all three molecules negatively regulate T cell activity in vivo. Since GPI-linked proteins weakly associate with protein tyrosine kinases, it is possible that they can act either as positive or negative regulators of T cell activation by sequestering signalling molecules or interfering with assembly of signalling complexes in lipid rafts, the net effect dependent upon the trigger.
Immune Responses in Ovaries and Virus Titres
In order to determine whether the enhanced proliferation of gp-specific CD4+ T cells observed after in vitro stimulation reflected a stronger anti-viral CD4+ T cell response in vivo, numbers of CD4+ T cells at the site of rVVGP infection (ovary) were compared in WT and Cd59a−/− mice at day 8 after infection. Higher numbers of infiltrating CD4+ T cells (Figure 3A) and IFNγ-producing CD4+ T cells (Figure 3B) were observed in the ovaries of Cd59a−/− mice compared to WT mice. The same analysis was performed for ovary-infiltrating CD8+ T cells (Figures 3C and D). Although higher numbers of CD8+ T cells were observed in the ovaries of Cd59a−/− mice compared to WT mice, this difference was not statistically significant and may reflect enhanced helper CD4+ T cell activity rather than a direct effect of CD59a on CD8+ T activity. Virus titres were also compared in both groups of mice at days 3 and 8 post-infection. Virus titres were significantly lower in Cd59a−/− mice compared to WT mice at day 3 post-infection, whereas both groups of mice had controlled the infection by day 8 (Figure 3E). These data indicate that the more robust CD4+ T cell response observed in Cd59a−/− mice does not reflect an inability to clear the virus efficiently but may rather contribute to more rapid control of the infection.
Figure 3. rVVGP clearance in Cd59a−/− mice.
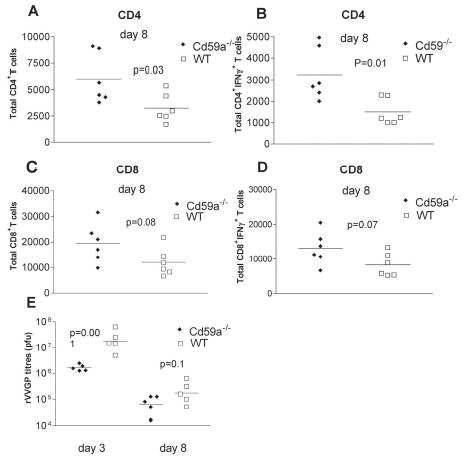
Ovary-infiltrating lymphocytes were stained for intracellular IFN , CD4 and CD8 expression at day 8 post-infection and analyzed by FACS. Total numbers of infiltrating CD4+ and CD8+ T cells are shown in A and C respectively and total numbers of IFN producing CD4+ and CD8+ T cells are shown in B and D respectively. Virus titres in the ovaries of infected mice were determined at day 3 and 8 post infection (E). Each symbol represents an individual mouse and similar data was observed in two independent experiments. Mean titres are also indicated in each graph. Statistical significance was evaluated using Student’s t test.
Analysis of CD4+ T Cell Proliferation In Vitro
We next compared proliferation of T cells from WT mice and Cd59a−/− mice after in vitro stimulation with CD3-specific mAb and APCs. Whilst no difference was observed in proliferation of CD8+ T cells (Figure 4B), CD4+ T cells from Cd59a−/− mice exhibited more proliferation in vitro compared to T cells from WT mice (2.5-fold increase; Figure 4A). The increase in proliferation of CD4+ T cells from Cd59a−/− mice compared to WT mice was only apparent when CD3-specific mAb and APCs were used for in vitro stimulation and not when CD3- and CD28-specific antibodies were used (compare Figures 4B and C). To determine whether CD59a expression on APCs affected proliferation of the responding T cells, CD4+ T cells were incubated with APCs from WT or Cd59a−/− mice. CD4+ T cell proliferation was not influenced by the presence or absence of CD59a on APCs indicating that the difference in proliferation of CD4+ T cells from WT and Cd59a−/− mice is due to expression of CD59a on the T cells (data shown). Incorporation of GPI-anchored CD59a into CD4+ T cells from Cd59a−/−mice (Figure 4D) caused a reduction in proliferation to levels the same as cells from WT mice (Figure 4E). Together, these data imply that CD59a down-modulates CD4+ T cell proliferation and requires the presence of APCs to exert this effect. It is possible that CD59a engages with a ligand on the APC or alternatively, a soluble factor produced by the APC. To test the possibility that C activation and formation of the MAC mediates CD59a modulation of T cell activity, CD4+ T cells purified from both WT and Cd59a−/−mice were stimulated with CD3-specific mAb and APCs in the presence and absence of a soluble inhibitor of C (sCR1). sCR1 blocks activation of the classical and the alternative pathways of C by binding C3b and C4b and mediating proteolytic degradation of these molecules (19). Inhibition of C in vitro did not affect the proliferative response of Cd59a −/− T cells, indicating that the enhanced proliferation was C independent (Figure 5A).To determine whether this was also true in vivo, mice infected with rVVGP were injected daily with sCR1, a treatment that efficiently inhibited C throughout the course of the experiment. gp-specific CD4+ T cell responses were measured 9 days after infection and no difference was observed in virus-specific proliferative responses induced in the presence or absence of C inhibition (Figure 5B). To confirm this result, Cd59a−/− mice were intercrossed with C3−/− mice and then infected with rVV GP. Virus-specific CD4+ T cell response were enhanced equally in Cd59a−/− and Cd59a−/−C3−/− mice compared to WT and C3−/− mice (Figure 5C).These data demonstrate that the enhanced proliferation of Cd59a−/− CD4+ T cells is C independent and contrast with a recent report for the C regulator CD55 (15). Enhanced CD4+ proliferative responses observed in CD55 deficient mice were largely, although not exclusively, C dependent.
Figure 4. In vitro proliferation assays.
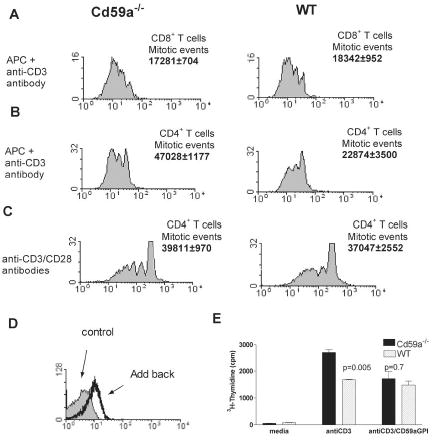
Purified CD4+ or CD8+ T cells (>90%) were CFSE labeled and incubated with anti-CD3 mAb and APCs (A and B) or anti-CD28 mAb (C). Calculation of the number of mitotic events was performed as previously described (22). One representative result of at least three independent experiments is shown. Values indicating mitotic events are the means of three experiments ± SD. To confirm that lack of CD59a expression was responsible for enhanced proliferation of T cells from Cd59a−/− mice, lymphocytes were incubated with GPI-anchored CD59a (CD59a-GPI) before the proliferation assay (E). Incorporation of CD59a-GPI on CD4+ T cells was confirmed by immunostaining (D).Values shown represents the mean ± SD. The experiment was performed on three separate occasions. Statistical analysis was performed by the Student’s T test.
Figure 5. Role of C in CD4+ T cell proliferation.
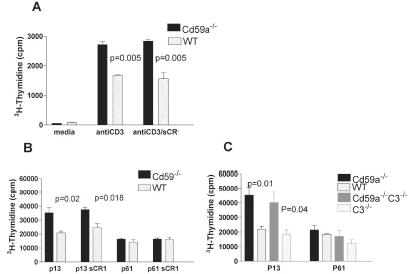
C was inhibited in vitro in assays where CD4+ T cells were stimulated with CD3-specific mAb and APCs (A) Data is representative of two experiments and values are shown as mean ± SD. C was inhibited in vivo by administration of sCR1 to mice for the first 9 days of infection with rVVGP (B) In vivo experiments were repeated with Cd59a−/−C3−/− mice (C). Mice were individually analyzed and the values shown indicate the mean ± SEM (n= 3 mice/group). The results were analysed statistically by Student's T test
In summary, this report identifies a role for the GPI-anchored C regulator CD59a in negative modulation of T cell activity in vivo. Due to the GPI anchor, CD59a is sequestered in membrane microdomains, which serve as platforms for antigen receptor signalling complexes in lymphocytes. CD59a may influence the re-arrangement of lipid rafts after APC/CD4+ T cell association. T cell activation induces a rapid compartmentalisation of signalling machinery into lipid rafts. Costimulatory molecules are important for this redistribution (20) and it is possible that the presence of CD59a within rafts result in recruitment of different raft-associated kinases leading to modulation of T cell activity. No difference was found with CD8+cells, possibly due to differences in lipid raft composition between CD4+ and CD8+ cells (21).
Further analyses of Cd59a−/− mice are required to provide insight into the precise nature of the molecular events underlying the effect of CD59a on T cell activity. Such an understanding will reveal pathways through which CD59a and its human analogue may be exploited for therapeutic approaches designed to either up-regulate beneficial T cell responses or down modulate those that are harmful.
Acknowledgments
The authors wish to thank Dr Claire Harris and Dr Paul Brennan for critical reading of the manuscript and Dr Rossen M. Donev for advice.
Footnotes
M.P. Longhi is supported by a Prize Studentship awarded by The Wellcome Trust (Ref. No. 073055). B.P. Morgan and N. Omidvar are supported by a Wellcome Trust program grant (Ref No. 068590). B. Sivasankar is supported by the Wellcome Trust International Travelling Research Fellowship (Ref No.068280). A. Gallimore is supported by an MRC Senior Fellowship (Ref No.G117/488).
References
- 1.Meri SWH, Lachmann PJ. Distribution of protectin (CD59), a complement membrane attack inhibitor, in normal human tissues. Lab Invest. 1991;65:532–537. [PubMed] [Google Scholar]
- 2.Farkas I, Baranyi L, Ishikawa Y, Okada N, Bohata C, Budai D, Fukuda A, Imai M, Okada H. CD59 blocks not only the insertion of C9 into MAC but inhibits ion channel formation by homologous C5b-8 as well as C5b-9. J Physiol (Lond) 2002;539:537–545. doi: 10.1113/jphysiol.2001.013381. [DOI] [PMC free article] [PubMed] [Google Scholar]
- 3.Korty P, Brando C, Shevach E. CD59 functions as a signal-transducing molecule for human T cell activation. J Immunol. 1991;146:4092–4098. [PubMed] [Google Scholar]
- 4.Holt DS, Botto M, Bygrave AE, Hanna SM, Walport MJ, Morgan BP. Targeted deletion of the CD59 gene causes spontaneous intravascular hemolysis and hemoglobinuria. Blood. 2001;98:442–449. doi: 10.1182/blood.v98.2.442. [DOI] [PubMed] [Google Scholar]
- 5.Wessels M, Butko P, Ma M, Warren H, Lage A, Carroll M. Studies of Group B Streptococcal Infection in Mice Deficient in Complement Component C3 or C4 Demonstrate an Essential Role for Complement in both Innate and Acquired Immunity. PNAS. 1995;92:11490–11494. doi: 10.1073/pnas.92.25.11490. [DOI] [PMC free article] [PubMed] [Google Scholar]
- 6.Oxenius MB, Mathis D, Benoist C, Zinkernagel RM, Hengartner H. Functional in vivo MHC class II loading by endogenously synthesized glycoprotein during viral infection. J Immunol. 1997;158:5717–5726. [PubMed] [Google Scholar]
- 7.Bachmann MF, Kundig TM, Freer G, Li Y, Kang CY, Bishop DH, Hengartner H, Zinkernagel RM. Induction of protective cytotoxic T cells with viral proteins. Eur J Immunol. 1994;24:2228–2236. doi: 10.1002/eji.1830240944. [DOI] [PubMed] [Google Scholar]
- 8.Baalasubramanian S, Harris CL, Donev RM, Mizuno M, Omidvar N, Song WC, Morgan BP. CD59a Is the Primary Regulator of Membrane Attack Complex Assembly in the Mouse. J Immunol. 2004;173:3684–3692. doi: 10.4049/jimmunol.173.6.3684. [DOI] [PubMed] [Google Scholar]
- 9.Harris CL, Hanna SM, Mizuno M, Holt DS, Marchbank KJ, Morgan BP. Characterization of the mouse analogues of CD59 using novel monoclonal antibodies: tissue distribution and functional comparison. Immunology. 2003;109:117–126. doi: 10.1046/j.1365-2567.2003.01628.x. [DOI] [PMC free article] [PubMed] [Google Scholar]
- 10.Stefanova I, Horejsi V. Association of the CD59 and CD55 cell surface glycoproteins with other membrane molecules. J Immunol. 1991;147:1587–1592. [PubMed] [Google Scholar]
- 11.van den Berg C, Cinek T, Hallett M, Horejsi V, Morgan B. Exogenous glycosyl phosphatidylinositol-anchored CD59 associates with kinases in membrane clusters on U937 cells and becomes Ca(2+)-signaling competent. J Cell Biol. 1995;131:669–677. doi: 10.1083/jcb.131.3.669. [DOI] [PMC free article] [PubMed] [Google Scholar]
- 12.Oxenius A, Karrer U, Zinkernagel RM, Hengartner H. IL-12 Is Not Required for Induction of Type 1 Cytokine Responses in Viral Infections. J Immunol. 1999;162:965–973. [PubMed] [Google Scholar]
- 13.Fitzgerald JC, Gao GP, Reyes-Sandoval A, Pavlakis GN, Xiang ZQ, Wlazlo AP, Giles-Davis W, Wilson JM, Ertl HCJ. A Simian Replication-Defective Adenoviral Recombinant Vaccine to HIV-1 Gag. J Immunol. 2003;170:1416–1422. doi: 10.4049/jimmunol.170.3.1416. [DOI] [PubMed] [Google Scholar]
- 14.Whitton JL, Lewicki JRGH, Tishon A, Oldstone MB. Molecular definition of a major cytotoxic T-lymphocyte epitope in the glycoprotein of lymphocytic choriomeningitis virus. J Virol. 1988;62:687–695. doi: 10.1128/jvi.62.3.687-695.1988. [DOI] [PMC free article] [PubMed] [Google Scholar]
- 15.Liu J, Miwa T, Hilliard B, Chen Y, Lambris JD, Wells AD, Song WC. The complement inhibitory protein DAF (CD55) suppresses T cell immunity in vivo. J Exp Med. 2005;201:567–577. doi: 10.1084/jem.20040863. [DOI] [PMC free article] [PubMed] [Google Scholar]
- 16.Heeger PS, Lalli PN, Lin F, Valujskikh A, Liu J, Muqim N, Xu Y, Medof ME. Decay-accelerating factor modulates induction of T cell immunity. J Exp Med. 2005;201:1523–1530. doi: 10.1084/jem.20041967. [DOI] [PMC free article] [PubMed] [Google Scholar]
- 17.Stanford WL, Haque S, Alexander R, Liu X, Latour AM, Snodgrass HR, Koller BH, Flood PM. Altered Proliferative Response by T Lymphocytes of Ly-6A (Sca-1) Null Mice. J Exp Med. 1997;186:705–717. doi: 10.1084/jem.186.5.705. [DOI] [PMC free article] [PubMed] [Google Scholar]
- 18.Davis L, Patel S, Atkinson J, Lipsky P. Decay-accelerating factor functions as a signal transducing molecule for human T cells. J Immunol. 1988;141:2246–2252. [PubMed] [Google Scholar]
- 19.Kalli K, Fearon D. Binding of C3b and C4b by the CR1-like site in murine CR1. J Immunol. 1994;152:2899–2903. [PubMed] [Google Scholar]
- 20.Martin M, Schneider H, Azouz A, Rudd CE. Cytotoxic T Lymphocyte Antigen 4 and CD28 Modulate Cell Surface Raft Expression in Their Regulation of T Cell Function. J Exp Med. 2001;194:1675–1682. doi: 10.1084/jem.194.11.1675. [DOI] [PMC free article] [PubMed] [Google Scholar]
- 21.De Mello Coelho V ND, Giri B Bunbury A, Schaffer E Taub D. Quantitative differences in lipid raft components between murine CD4+ and CD8+ T cells. BMC Immunology. 2004;5:2. doi: 10.1186/1471-2172-5-2. [DOI] [PMC free article] [PubMed] [Google Scholar]
- 22.Yamazaki S, Iyoda T, Tarbell K, Olson K, Velinzon K, Inaba K, Steinman RM. Direct Expansion of Functional CD25+ CD4+ Regulatory T Cells by Antigen-processing Dendritic Cells. J ExpMed. 2003;198:235–247. doi: 10.1084/jem.20030422. [DOI] [PMC free article] [PubMed] [Google Scholar]


