

Abstract
The study of parasitic protozoa plays a major role in cell biology, biochemistry and molecular biology. Numerous cytochemical techniques have been developed in order to unequivocally identify the nature of subcellular compartments. Enzyme and immuno-cytochemistry allow the detection of, respectively, enzymatic activity products and antigens in particular sites within the cell. Energy-filtering transmission electron microscopy permits the detection of specific elements within such compartments. These approaches are particularly useful for studies employing antimicrobial agents where cellular compartments may be destroyed or remarkably altered and thus hardly identified by standard methods of observation. In this regard cytochemical and spectroscopic techniques provide valuable data allowing the determination of the mechanisms of action of such compounds.
Keywords: histochemistry, cell compartmentation
Introduction
Parasitic protozoa comprise valuable tools in cell biology, providing excellent and often unique experimental models (e.g. 1, 2). The use of microbial pathogens to approach basic questions in cell biology is considered a new science termed 'cellular microbiology' (3, 4). The first living cells observed under a microscope were most probably parasitic protozoa (Giardia lamblia, Opalina, Nyctotherus and coccid parasites of rabbits) as well as bacteria collected by Antoni van Leeuwenhoek. Knowledge about cell functioning and structure relied largely on the development of microscopic approaches and the protozoology of parasites plays a pivotal role in the advancement not only of parasitology, but also of cell biology, biochemistry and molecular biology.
Ultrastructural And Cytochemical Study Of Parasitic Protozoa
The study of parasitic protozoa using light and transmission electron microscopy has often been faced with difficulties in subcellular compartment identification. Organelles with similar structural features but rather distinct compositions were frequently subsumed under the same designation and vice versa. Therefore the identification of a compartment by routine TEM may be considered purely arbitrary (5). We have previously studied the effects of the putrescine analogue 2,4-diamino butanone on the trichomonad parasite Tritrichomonas foetus. The drug remarkably reduced protozoan proliferation in vitro and led to profound alterations in the redox organelles termed hydrogenosomes. These organelles are important in the chemotherapy of trichomoniasis since the drugs of choice, the 5-nitroimidazoles such as metronidazole (flagyl®) are activated by reduction within these compartments. The TEM of the drug-treated parasites strongly suggested that the organelles were drastically altered and destroyed after prolonged incubations. We were only able to confirm the hydrogenosomal destruction by the putrescine analogue by the use of immunogold cytochemistry employing a monoclonal antibody to a marker enzyme i.e. β-succinyl-CoA synthetase (6).
Sterol biosynthesis inhibitors (SBI) are potent antifungal compounds that comprise important candidates for the chemotherapy of Chagas disease and leishmaniasis (7-10). We have previously noticed that SBI such as ketoconazole and terbinafine induced uncontrolled autophagy in Leishmania amazonensis parasites (8). The cytochemical detection of acid phosphatase was employed to confirm the autophagic nature of multivesicular bodies observed in SBI-treated parasites. More recently we used cytochemistry and electron energy-loss spectroscopy (EELS) to further address the SBI effects on Leishmania (11). In this report, we demonstrate that cytochemistry and energy-loss spectroscopy are valuable tools in protozoology.
Energy-Filtering Transmission Electron Microscopy
Energy-filtering transmission electron microscopy has become a powerful tool to study the element distribution in cellular compartments. This technique allows the calculation of element distribution images in a sample with high spatial resolution and sensitivity (12). The underlying principle of this technique is the fact that beam electrons in a transmission electron microscope lose characteristic or element-specific energies during inelastic collisions with the sample atoms. The electron energy-loss spectrum shows the features of this interaction with the specimen.
The excitation events of inner-shell electrons of a certain atom that compose the specimen appear in the spectrum as an increase in electron counts in the core-loss ionization edge followed by a progressive decrease with the increasing energy loss. Every ionization edge is superimposed on a spectral background due to other energy-loss processes. To obtain an image that represents the characteristic energy-loss electrons, and consequently reflects the elemental distribution in the specimen, the background contribution must be subtracted. Various methods have been developed to obtain the element distribution in a specimen. In the spectrum-imaging and image-EELS techniques, a three-dimensional dataset of the electron energy-loss spectrum is collected for each pixel of the analysed field. In spectra imaging in a scanning transmission electron microscope, a small area of the sample is analysed and a parallel EELS spectrum is acquired for each point. Alternatively, the element distribution can be calculated from a small number of images acquired at defined energy losses. The images are obtained in a fixed beam transmission electron microscope that contains either an in-column or a post-column filter (13). The filter separates electrons according to their energy losses after interaction with the specimens and a slit is used to define an energy window that will contribute to the recorded image. The image is recorded with a camera at energy losses related to the element to be mapped and sorted in the computer' memory for future calculations. To obtain an elemental map with energy-filtered images it is necessary to remove the non-element-specific background from the specific signal of the ionization edge.
Thickness of the sample is an important parameter to be considered in electron energy-loss spectroscopy of sections of biological specimens. This is mainly because, when an accelerated beam electron passes through a specimen, it is possible that it is scattered twice or even several times. The probability of plural or multiple scattering increases in proportion to the specimen thickness and rising atomic number or density. All scattering combinations can occur (elastic plus elastic, elastic plus inelastic or multiple inelastic) and multiple-scattered electrons lose energy with each inelastic impact. The information content of the element-characteristic single scatter electrons is greatly reduced when multiple scatter increases. Multiple scattered electrons provide no information value for energy loss analysis, especially for elemental mapping. The more multiple scatter a sample may present, the less reliable the analysis for the element-characteristic single scatter. This leads to a considerable reduction of the signal-to-noise ratio and a decrease in detectability. Thus, the section thickness of a specimen for acquisition of an electron energy-loss spectrum or calculation of a elemental map should be optimised for best results.
Different protocols are used to estimate the background and identify the element signal to calculate the elemental map from the element-enhanced image. The most common are the two- and three-window methods. In the two-window method, a background image is a pre-edge image that is subtracted (difference method) or divided (jump-ratio method) from the element-enhanced image. The two-window method gives elemental maps with high signal to noise ratios because it uses only two images instead of three as in the case of the three-window-power-law method. The three-window-power-law method is the most conventional method for background subtraction and calculation of elemental maps. In this case, the background is estimated by a power-law function I = A . E-r, where I is the electron count, E is the energy loss and A and r are the two independent fitting parameters (13). To calculate the elemental map with this method, two images below and one image above the ionization edge are acquired. Background correction is done by extrapolating the background image according to the power function model. Both A and r vary within the samples as a result of variations in the thickness and composition and a separate estimation of the background is required at each pixel. To do this, extrapolated background is subtracted pixel by pixel from the element enhanced edge (the image above the ionization edge). The net result of this subtraction is considered the elemental map for that element. Variations of the two- and three-window methods were developed (12).
Materials and Methods
Cytochemical Identification Of Leishmania Subcellular Compartments
In order to identify the parasite organelles, we performed the detection of acid phosphatase (14). This technique is based on the cerium chloride-mediated capture of liberated phosphate groups in the presence of a phosphatase substrate such as glycerophosphate or p-nitrophenylphosphate (p-NPP). The use of p-NPP poses the advantage of having as a product p-nitrophenol, which is easily detected spectrophotometrically allowing a parallel quantitative approach. Nevertheless the use of p-NPP is associated with its non-enzymatic hydrolysis in the presence of cerium chloride.
The cells were fixed in 1% glutaraldehyde (type I, Sigma, St. Louis) in 0.1M sodium cacodylate buffer, pH 7.2, for 10 min. at 4°C. Afterwards they were washed twice in the same buffer and once in Tris-HCl buffer, pH 5.0. The cells were then incubated for 60 min. in Tris-HCl buffer, pH 5.0 with 1mM sodium-β-glycerophosphate, 5% (w/v) sucrose and 2mM CeCl3. After that, the cells were washed in the same buffer and fixed in 2.5% glutaraldehyde in cacodylate buffer, pH 7.2, for 60 min at room temperature and processed for TEM.
Endocytic compartments can be detected by the use of tracers such as peroxidase and gold-labelled proteins that can be readily identified by electrondense reaction product precipitates and characteristic particles, respectively. We employed horseradish peroxidase (HRP) as a fluid-phase endocytic tracer. Living cells were incubated with HRP for 60-120 min. and then with 500 μg/ml 3:3'-diaminobenzidine (DAB), and 0.01 % (w/v) hydrogen peroxide (H2O2) as substrates for more 60 min. at room temperature. Afterwards the cells were processed for TEM. Endocytic compartments can be also traced by incubation of living cells with cationized ferritin, which binds to anionogenic sites on the cell surface. Living Leishmania amazonensis promastigotes were incubated with 10 mg/ml cationized ferritin for 60-120 min. and then washed, fixed in 2.5% glutaraldehyde and processed for TEM.
Subcelullar compartments can also be studied by the use of gold-conjugated lectins. We incubated thin sections of lowicryl K4M-embedded parasites with several gold-labelled lectins (15). For this procedure, the cells were fixed in 1% glutaraldehyde, 4% formaldehyde (freshly prepared) in cacodylate buffer, pH 7.2, for 60 min. at 4°C, dehydrated in methanol and embedded in lowicryl K4M by the progressive lowering of temperature method (16).
Gold-labelled transferrin and cystatin C were also employed as endocytic tracers. Living cells were incubated with the gold-conjugated proteins for 60 min. and then processed for TEM.
Elemental Mapping By Energy-Filtered Transmission Electron Microscopy
In order to detect the elements present in subcellular structures of the parasites, we prepared cells for electron microscopy. The most prevalent elements in the spectra, which we decided to map, were calcium, oxygen and phosphorus. Cells were fixed in 2.5 % glutaraldehyde in cacodylate buffer 0.1 M, pH 7.2, for 2 h at room temperature, washed in the same buffer, post-fixed in a buffered 1% OsO4 solution for 20 minutes, washed in buffer, dehydrated through an acetone series and then embedded and polymerized in PolyBed 812 resin. Unstained 30-50 nm-thick sections were analysed with a Zeiss CEM902 transmission electron microscope equipped with an IBAS (Kontron Elektronik GmbH) image analysis system. For elemental mapping, the two or three window method was used to map phosphorus (post-edge: 150 eV; pre-edge: 100 and 110 eV; energy-selecting window of 20 eV), calcium (post-edge: 360 eV; pre-edge: 330 eV; energy-selecting window of 20 eV and O (post-edge: 545 eV; pre-edge: 515 and 490 eV; energy-selecting window of 20 eV). The objective aperture was 90 μm (17 mrad approximately) and the accelerating voltage was 80 kV. Elemental maps were directly photographed from the host computer monitor. For electron energy-loss spectroscopy, the microscope was operated in spectrum mode with an objective aperture of 30 μm (5.8 mrad approximately) and accelerating voltage of 80 kV. The energy-selecting window was of approximately 2 eV. Electron counts were measured at 2 eV intervals by a digital multimeter connected to a photomultiplier attached to the microscope. The output readings were fed into the computer memory and processed by the software developed by Kontron Elektronik GmbH.
Results and Discussion
Ultrastructural Cytochemistry Of Leishmania
Cytochemical approaches have allowed the bona fide identification of subcellular compartments within whole cells. Cell organelles such as nucleus and mitochondria are readily identified under TEM. Nevertheless, other less conspicuous or drug-modified compartments cannot be unequivocally recognised simply by structural features (6).
Different protozoa species display compartments termed acidocalcisomes, which are acidic and store calcium (17). Nevertheless this definition is mainly based on functional assays and methodological artefacts have hampered the identification of these organelles in TEM.
Since we have previously noticed (8) that Leishmania parasites treated with the antifungal compounds presented structural alterations that included increased numbers of organelles resembling the acidocalcisomes (Figs. 1a and b), we decided to further approach this phenomenon. We employed cytochemical methods to characterize the SBI-treated parasites. Although these compartments are acidic and accumulate calcium, experiments carried out using other protozoa indicate that they do not take part in the endocytic pathway (18, 19). Nevertheless different endocytic tracers and long incubation periods should be tested. The observation of membranous, material could be indicative of a presumably autophagic nature to this compartment and the cytochemical detection of acid phosphatase (Fig. 1c) activity would corroborate this inference. Nevertheless these compartments present high pyrophosphatase activity (these enzymes may also be detected by cerium-based cytochemical procedures) and considerable amounts of inorganic phosphates (20). Thus the acid phosphatase detection within this compartment may be misleading unless suitable controls are carried out.
Fig. 1.
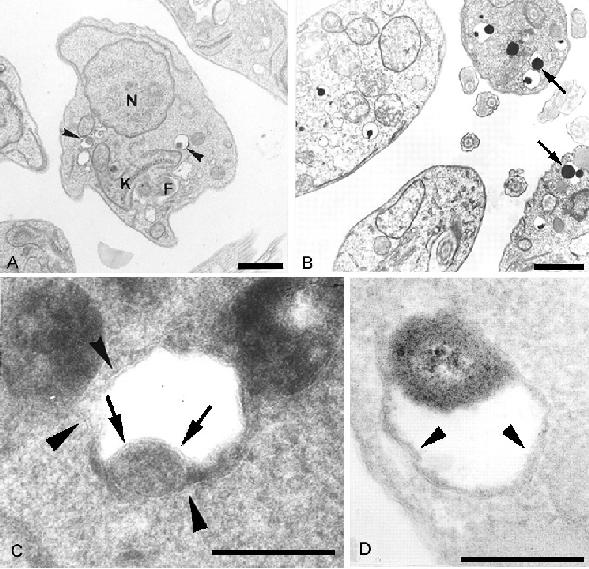
A) TEM of control Leishmania amazonensis promastigotes displaying the normal organelles, including some acidocalcisomes (arrowheads) N - nucleus, K - kinetoplast.; B) Terbinafine-treated promastigote showing numerous and large acidocalcisomes (Arrows).; C) Acid phosphatase detection in L. amazonensis acidocalcisome (arrowheads) Note the presence of membrane unit lining the organelle core (arrows). D) HRP activity detection in acidocalcisome (arrowheads); Scale bars indicate 1 μm (A-B) and 0.25 μm (C-D); (reproduced from (11) with publisher permission).
Interestingly under such conditions it was possible to observe a membrane unit lining the organelle core (Fig. 1c).
The use of endocytic tracers makes possible the identification of compartments of the endosomal/lysosomal/autophagic pathway in different cell types. The use of peroxidase and DAB in ultrastructural cytochemistry was introduced by Graham and Karnovsky (21, 22) to trace endocytosis but it was also widely employed for the demonstration of catalase and cytochrome oxidase as well as for detection of endogenous peroxidase activities. Heme-derivatives can also mediate the oxidative polymerization of DAB. This would not be a problem here since trypanosomatid parasites do not produce heme groups, which therefore must be incorporated from the medium. Thus if ingested these groups would also be found in endocytic compartments. The oxidation leads to DAB polymerization via nitrogen atoms and the resulting polymer is highly osmiophilic and insoluble, therefore allowing easy identification of electrondense precipitates of the enzymatic reaction product with minimal diffusion artefacts.
The incubation of SBI-treated and control parasites with HRP as an endocytic tracer resulted in the acidocalcisome labelling (Fig. 1d).
Living Leishmania parasites incubated with cationized ferritin presented labelled acidocalcisomes (Fig. 2a). Similarly, we have previously observed (15) the Leishmania acidocalcisome staining (Fig. 2b) by the gold-labelled lectin from Limax flavus (specific for neuraminic acid).
Fig. 2.
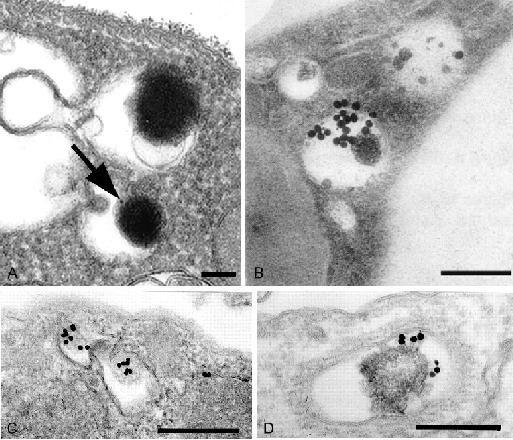
Living Leishmania parasites were incubated with the endocytic tracers: A) cationized ferritin; C) transferrin-Au and D) cystatin C-Au, for 60-120 min or fixed and processed for post-embedding cytochemistry (see methodology section) and the Limax flavus agglutinin-binding sites (B) were detected using the gold conjugated lectin. In the conditions tested here labelling was observed in acidocalcisome-like compartments. Scale bars indicate 0.1 μm (A), 0.2 μm (B) and 0.25 μm (C-D); (reproduced from (11) and (15) with publishers permission).
Gold-labelled proteins can also be used successfully as endocytic tracers (23). They pose the remarkable advantage of allowing the use of different proteins conjugated with different particle diameters but it must be kept in mind that the gold conjugation, particularly with particles larger than 5nm, may alter the endocytic pathway of a protein such as transferrin (24). In such cases, the protein may be followed by immunocytochemistry (e.g. 25, 26). Interestingly, immunocytochemical detection of one or more proteins may be performed simultaneously with the cytochemical detection of an enzyme (e.g. 27).
Here we employed gold-conjugated transferrin and cystatin C. In both cases acidocalcisome-like organelles were labelled (Figs. 2c and d), indicating a possible endosomal/autophagic nature. Unfortunately, we presently cannot exclude the possibility of mistaking other compartments with structural similarity.
Application Of The Eftem To Microbiological And Chemotherapeutical Studies In Leishmania
In our previous report (11), electron spectroscopic imaging was used to map phosphorous, oxygen and calcium in thin sections of polybed-embedded parasites. Inelastically scattered electrons with element-specific energy losses were used to determine the distribution of several elements in Leishmania promastigotes before and after cultivation of the SBI ketoconazole and terbinafine. Both the electron energy-loss spectra and elemental maps of the acidocalcisomes revealed the presence of phosphorous, oxygen and calcium.
Elemental mapping of acidocalcisomes showed a homogenous distribution of phosphorous (Fig. 3b), calcium (Fig. 3d) and oxygen (Fig. 3c) all over the organelle dense core (Fig. 3a). Electron energy-loss representative spectra confirmed the presence of these elements by demonstrating calcium L2,3 (346 eV), oxygen K (532 eV) and nitrogen (402 eV) edges (Fig. 4a). The L2,3 edge for phosphorous (132 eV; Fig. 4b) and occasionally zinc (not shown) were also detected in this organelle. We cannot exclude the possibility that other elements were washed out during sample processing and/or sectioning. The detection of P and O confirm the organelles studied were indeed the acidocalcisomes and phosphate groups could be found within these compartments due to the polyphosphate and/or pyrophosphate breakdown (20) or to the degradation of material derived from the endocytic/autophagic pathway (11).
Fig. 3.
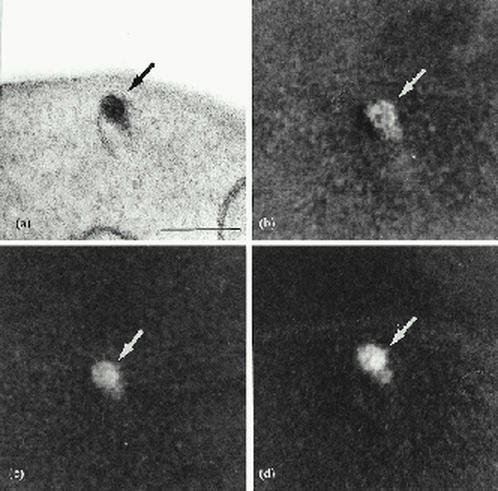
Elemental mapping (b-d) of an L. amazonensis acidocalcisome shown in (a). The phosphorus (b) and oxygen (c) maps were calculated by the three-window methods from two energies below and one above the energy edge for each element. The calcium map (d) was calculated by the two-window method using one energy below and one above the energy edge of that element. Scale bar indicates 0.5 μm (reproduced from (11) with publisher permission).
Fig. 4.
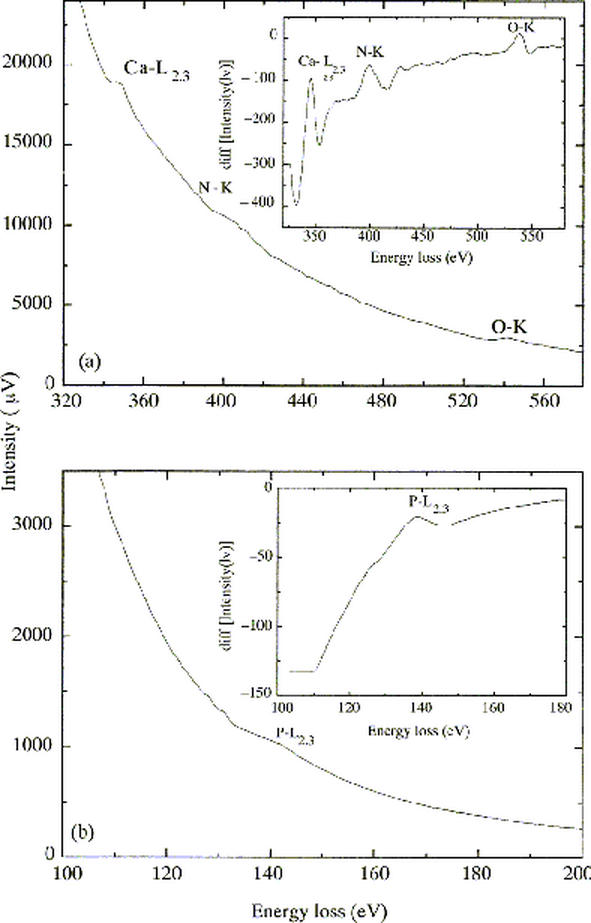
Electron energy loss spectra of an acidocalciosome showing (a) the L2,3 edge of the element calcium (346 eV) and K edges of the elements nitrogen (402 eV) and oxygen (532 eV) and (b) the L2,3 edge of the element phosphorus (132 eV). Insets are the derivatives of the spectra shown, highlighting the edges of the elements. (reproduced from (11) with publisher permission).
Acknowledgments
Financial support: Brazilian agencies and programs PRONEX-MCT, FAPERJ, CNPq, FUJB, CAPES, CEPEG-UFRJ and TWAS.
Abbreviations
- TEM
transmission electron microscopy
- EFTEM
energy-filtering TEM
- EELS
electron energy-loss spectroscopy
- SBI
sterol biosynthesis inhibitors
Appendix
Protocols
1. Equipment
Currently, two major commercial spectrometers are manufactured with different purposes: the magnetic prism spectrometer (Gatan) and the Omega filter ( Leo). The magnetic prism is designed with energy spectrometry as its primary function whereas the omega filter is used mainly for energy-filtered imaging although spectra can be obtained. Besides, the Gatan Image Filter (GIF), which is a variation of the magnetic prism spectrometer, combines both spectral and imaging capabilities and can also be used in an also be used in energy-filtered imaging. The electron spectrometers designed for energy-filtered imaging are of two types: (a) in-column spectrometers such as those found on a Zeiss 902 , LEO 912 and LEO 922 microscope series for electron spectroscopic imaging and (b) post-column imaging filters (the Gatan imaging filters - GIF series). We have been doing electron spectroscopic imaging with a Zeiss CEM 902 (no longer commercially available) and with a LEO 912 transmission electron microscope. These microscopes have a fixed beam and contain an in-column filter that separates electrons according to their energy losses after interaction with the specimens and a slit is used to define an energy window that will contribute to the recorded image. The image is recorded with a camera at energy losses related to the element to be mapped and sorted in the computer' memory for future calculations. We used a SIT (Dage type, series 66x; Michigan city, USA) tube camera to obtain images and a serial detection photomultiplier attached to a digital multimeter to obtain electron energy-loss spectra.
2. Reagents
PBS (phosphate-buffered saline): 0.1M NaCl, 0.01M NaH2PO4, pH 7.4.
Glutaraldehyde (types I and II), osmium tetroxide, cerium chloride, sodium cacodylate, bovine serum albumin, Triton X-100, sucrose, TRIS base, β-glycerophosphate, horseradish peroxidase, hydrogen peroxide, 3:3'-diaminobenzidine, glycine, acetic acid and sodium acetate were purchased from Sigma Chemical Co. (San Mateo CA).
Gold-conjugated secondary antibodies were purchased from Polysciences, Inc
Acetone and methanol were purchased from Merck.
Epon polybed 820 and lowicryll k4M were purchased from EMscope Laboratories or Ted Pella Co.
16-20% p-formaldehyde (PFA) stock solutions are prepared by heating to ~ 60°C and adding 5N NaOH (drop-by-drop). Dissolution is accomplished when the liquid is totally translucent. PFA stock solutions may be frozen until use, but should be kept in capped flasks filled to the top and sealed with parafilm to avoid oxidation. When defrosting (e.g. in a water bath) the PFA solutions usually present a milky appearance and should be used only after becoming translucent. Fixative solutions must be prepared and handled in a fume hood.
3. Methods
Transmission Electron Microscopy
Fix cells in a suitable buffered aldehyde fixative for 2.5% glutaraldehyde either grade I or II (Sigma Chemical Co.) in 0.1M sodium cacodylate buffer pH 7.2 at 4°C overnight. The fixative solution final volume should be at least 10-fold higher than the tissue fragment or cell pellet sample.
Harvest cells by centrifugation in the same buffer.
For pre-embedding cytochemical detection proceed as described in steps 5 and 6 of Post-Embedding Immunocytochemical Detection.)
Post-fix in 1% osmium tetroxide in 0.8% potassium ferricyanide for 30 min at room temperature and protected from light.
Dehydate in increased concentrations of acetone (or other appropriate solvent)
Embed in Epon polybed 820 epoxy resin
Stain ultrathin sections in 5% aqueous uranyl acetate and lead citrate.
Acid Phosphatase Cytochemical Detection
Fix cells mildly in a suitable buffered aldehyde fixative for 15-20 min at 4°C. We used 1% glutaraldehyde grade II (Sigma Chemical Co.) in 0.1M sodium cacodylate buffer pH 7.2.
Harvest cells by centrifugation in eppendorff microtubes (1 min at 14000 r.p.m.) in a buffer other than phosphate.
-
Prepare the complete incubation medium according to the following formula:
Reagent Final concentration 0.2 M Sodium acetate buffer pH 5.0 100 mM β-glycerophosphate 1 mM Cerium chloride or lead nitrate 1-2 mM Triton X-100 0.01% Distilled water - Sucrose (optional) 100-200 mM The sucrose may be omitted depending on the cell type, tissue or fixation used. The components of the incubation medium should be mixed as described above and special care should be taken by adding the substrate. The final medium must be clear when using β-glycerophosphate. Cerium chloride addition must be very slow. It may be dissolved in 1 mM distilled water and added drop-by-drop under constant agitation.. Incubate cells for 10-60 min at 37°C with occasional agitation.
Some alternative buffers and substrates can be used; acetate is a popular buffer but appears to produce some cytological damage, dimethylglutaric acid is suitable for most tissues. Alternative substrates are p-nitrophenyl phosphate (tend to give a precipitate in the incubation medium due to non-enzymatic hydrolysis; equimolar mixture of α - and β-glycerophosphate isomers (with no advantage described); a-naphthyl phosphate (no more than 0.4 mg/ml of the disodium salt should be added due to its lower solubility).
Appropriate controls should be included, such as omission of the substrate from the incubation medium or addition of specific inhibitors of the enzyme. Such controls may still show some staining of the membranes and certain organelles by the led ions.
After incubation , wash cells by centrifugation in 2-3 changes of sucrose-buffer wash consisting of 0.06 M Tris-Maleate buffer at pH 5.2 plus 10% sucrose.
Proceed as described in Transmission electron microscopy, except for do not stain the sections with uranyl acetate and lead citrate.
Horseradish Peroxidase Detection
Incubate living cells with horseradish peroxide for 1-2hs at 37°C.
Fix cells in appropriate fixative solution and peroxidase activity withstands aldehyde fixatives even at room temperature.
Dissolve 5 mg 3:3'-diaminobenzidine (DAB) in 9 ml of 0.05M Tris buffer at pH 7.6 and add 1 ml of a fresly-prepared 0.1% H2O2 solution.
Wash cells and incubate in this medium for 5-30 min at room temperature. Controls should omitt the hydrogen peroxide. If catalase-type activity is present, it can be inhibited by 0.01 M 3-amino-1,2,4-triazole added to the incubation medium.
After washing, proceed as described in Transmission Electron Microscopy section (steps 4-6)
Stain only with lead citrate
Post-embedding Immunocytochemical Detection
Fix cells in Karnovsky's fixative solution, consisting of 0.5-2% glutaraldehyde grade I (Sigma Chemical Co), 4% p-formaldehyde in 0.1M cacodylate buffer pH 7.2 plus 0.01% picric acid at 4°C overnight. The fixative should be pre-cooled before addition to cells.
Wash cells by centrifugation 2-3 times in the same buffer and incubate with 0.1M glycine solution in PBS in other to quench the free aldehyde groups.
-
Dehydate in increased methanol concentrations and in methanol-Lowicyll k4M hydrophyllic resin as follows:
Methanol Concentration Time incubation Temperature 30% methanol 10 4°C 50% methanol 10 4°C 70% methanol 10 -10°C 90% methanol 30 -10°C 2:1 90% methanol-lowicryl 24-48 hs -20°C 1:1 90% methanol-lowicryl 24-48 hs -20°C 1:2 90% methanol-lowicryl 24-48 hs -20°C Lowicryl 24-48 hs -20°C Polymerize the lowicryl embedded cells in appropriate molds or gelatin beads under U.V lamp
Block non-specific protein binding sites of thin sections in blocking solution consisting of 3-5% bovine serum albumin or non-fat milk (when detecting carbohydrate antigens milk should not be used) in PBS pH 8.0 plus 0.01% Tween 20 for 60 min at room temperature
Incubate sections with the antibody of choice in blocking buffer for 1-2hs at room temperature., extensively wash grids with buffer and incubate with the appropriate gold-labeled antibody for 1h. Wash grids.
Stain sections with uranyl acetate and lead citrate as described above. Do not observe the incubated grids under the electron microscopy at the same day of staining, otherwise the humidity of the sections may contaminate the objective microscope lens apertures. If necessary, the grids may be vacuum-dried.
Elemental mapping and electron energy loss spectroscopy
Very thin (30-50 nm) sections are essential for obtaining good maps of elements and energy-loss spectra because of the multiple scattering events that hamper the calculation of maps and good spectra acquisition. Sections should be preferentially made using a diamond knife and collected on 400 mesh nickel grids. Flanking thinnest sections with thicker ones may be helpful for visualization during sectioning. Thickness should be carefully controlled by interference color to be silver or gray.
Observe the sample in a previously aligned microscope under a very good vacuum (8 x 10⁻⁷ mbar, minimum) to avoid contamination of the sample because of excessive radiation. Also, the microscope should be operated with an anti-contamination device (copper wire cooled in liquid nitrogen dewar flask).
Choose the imaging conditions for generation of electron spectroscopic images or electron energy-loss spectra. The objective aperture should match the spectrometer one (60-30 μm for images; 30 μm for spectra). Magnification should be chosen to minimize the signal loss and still maximize resolution in the final map.
Adjust the spectrometer parameters to the element analyzed. Usually an energy-selecting aperture of 10-20 eV is used for obtaining maps and a window of 1-2 eV is chosen for spectra. Adjust and center the spectrometer entrance aperture.
To obtain electron spectroscopic images, run the software for elemental analysis (ESI Pro version 3.0; SIS GmbH, Germany). Open the corresponding module in the software (menu ESI acquisition) and adjust the parameters: element to be analyzed, energy losses for the windows, method for background correction (two- or three-window method). Set the camera to manual mode and adjust the camera settings (brightness and gain) to the dynamic range of the acquisition board (8-bit resolution) for most tube cameras. Digitalize the electron spectroscopic images and store in the computer memory.
To obtain an elemental map with energy-filtered images it is necessary to remove the non-element-specific background from the specific signal of the ionization edge. Choose the method for background correction, two- or three-window method, and calculate the corresponding elemental maps using the system's specific software module (menu ESI Analyze). Evaluate the maps and repeat the step 5 if necessary. Save the image series and the maps on the computer disk. There are possible complications of mass thickness effects, related to section thickness, which may lead to erroneous interpretations of the results. Multiple scattering and scrambling of the signal by the increased local thickness is an important artifact that can occur, especially in cytoplasmic structures with strong variations in mass thickness (density times the thickness). Ideally, the local thickness of a specimen for acquisition of an electron energy-loss spectrum or calculation of an elemental map should be smaller than the mean-free-path of the inelastic scattering processes. The mean free path is the average distance between particular interactions.
To obtain electron energy loss spectra, run the software for elemental analysis (ESI Pro version 3.0; SIS GmbH, Germany). Open the corresponding module in the software (menu Serial EELS) and adjust the parameters: element to be analyzed, energy loss range for the spectra, electron count range, acquisition time, and dwell time. Monitor the electron count with the photomultiplier-multimeter and maximize signal by maximizing electron probe current on the area analyzed. Start acquisition and store data in the computer memory.
Evaluate the spectrum and repeat the step 7, if necessary. Save the data series on the computer disk. The software contains tools for spectra evaluation and processing (smoothing, edge striping, deconvolution etc).
For further information contact the microscope (http://www.leo-em.co.uk) or the software (http://www.soft-imaging.net) manufacturers.
References
- Vickerman K, Coombs GH. Protozoan paradigms for cell biology. J Cell Sci. 1999;112:2797–2798. doi: 10.1242/jcs.112.17.2797. [DOI] [PubMed] [Google Scholar]
- Camus D, Zalis MG, Vannier-Santos MA, Banic DM. The art of parasite survival. Braz J Med Biol Res. 1995;28:399–413. [PubMed] [Google Scholar]
- Cossart P, Boquet P, Normark S, Rappuoli R. Cellular microbiology emerging. Science. 1996;271:315–316. doi: 10.1126/science.271.5247.315. [DOI] [PubMed] [Google Scholar]
- Davies J. Millennium bugs. Trends Cell Biol. 1999;9:M2–M5. [PubMed] [Google Scholar]
- Watson LP, Lee CM. Ultrastructure of Trypanosoma duttoni. Z Parasitenkd. 1975;46:133–140. doi: 10.1007/BF00389954. [DOI] [PubMed] [Google Scholar]
- Reis IA, Martinez MP, Yarlett N, Johnson PJ, Silva-Filho FC, Vannier-Santos MA. Inhibition of polyamine synthesis arrests trichomonad growth and induces destruction of hydrogenosomes. Antimicrob Agents Chemother. 1999;43:1919–1923. doi: 10.1128/aac.43.8.1919. [DOI] [PMC free article] [PubMed] [Google Scholar]
- Maldonado RA, Molina J, Payares G, Urbina JA. Experimental chemotherapy with combinations of ergosterol biosynthesis inhibitors in murine models of Chagas' disease. Antimicrob Agents Chemother. 1993;37:1353–9. doi: 10.1128/aac.37.6.1353. [DOI] [PMC free article] [PubMed] [Google Scholar]
- Vannier-Santos MA, Urbina JA, Martiny A, Neves A, de Souza W. Alterations induced by the antifungal compounds ketoconazole and terbinafine in Leishmania. J Eukaryot Microbiol. 1995;42:337–46. doi: 10.1111/j.1550-7408.1995.tb01591.x. [DOI] [PubMed] [Google Scholar]
- Urbina JA, Payares G, Molina J, Sanoja C, Liendo A, Lazardi K, Piras MM, Piras R, Perez N, Wincker P, Ryley JF. Cure of short- and long-term experimental Chagas' disease using D0870. Science. 1996;273:969–71. doi: 10.1126/science.273.5277.969. [DOI] [PubMed] [Google Scholar]
- Urbina JA. Lipid biosynthesis pathways as chemotherapeutic targets in kinetoplastid parasites. Parasitology. 1997;114:S91–S99. [PubMed] [Google Scholar]
- Vannier-Santos MA, Martiny A, Lins U, Urbina JA, Borges VM, de Souza W. Impairment of sterol biosynthesis leads to phosphorus and calcium accumulation in Leishmania acidocalcisomes. Microbiology. 1999;145:3213–3220. doi: 10.1099/00221287-145-11-3213. [DOI] [PubMed] [Google Scholar]
- Golla U, Kohl H. Theoretical and experimental investigations of resolution and detection limits in energy-filtering electron microscopy. Micron. 1997;28:397–406. doi: 10.1016/S0968-4328(97)00048-6. [DOI] [Google Scholar]
- Egerton RF. Electron energy loss spectroscopy in the electron microscope. 2nd ed. Plenum Press, 1996, New York.
- Robinson JM, Karnovsky MJ. Ultrastructural localization of several phosphatases with cerium. J Histochem Cytochem. 1983;31:1197–208. doi: 10.1177/31.10.6309949. [DOI] [PubMed] [Google Scholar]
- Vannier-Santos MA, Saraiva EM, de Souza W. Nuclear and cytoplasmic lectin binding sites in promastigotes of Leishmania. J Histochem Cytochem. 1991;39:793–800. doi: 10.1177/39.6.2033238. [DOI] [PubMed] [Google Scholar]
- Bendayan M, Nanci A, Kan FW. Effect of tissue processing on colloidal gold cytochemistry. J Histochem Cytochem. 1987;35:983–96. doi: 10.1177/35.9.3302022. [DOI] [PubMed] [Google Scholar]
- Docampo R, Moreno SN. Acidocalcisome: A novel Ca2+ storage compartment in trypanosomatids and apicomplexan parasites. Parasitol Today. 1999;15:443–448. doi: 10.1016/s0169-4758(99)01531-8. [DOI] [PubMed] [Google Scholar]
- Scott DA, Docampo R, Dvorak JA, Shi S, Leapman RD. in situ compositional analysis of acidocalcisomes in Trypanosoma cruzi. J Biol Chem. 1997;272:28020–28029. doi: 10.1074/jbc.272.44.28020. [DOI] [PubMed] [Google Scholar]
- Miranda K, Benchimol M, Docampo R, de Souza W. The fine structure of acidocalcisomes in Trypanosoma cruzi. Parasitol Res. 2000;86:373–84. doi: 10.1007/s004360050682. [DOI] [PubMed] [Google Scholar]
- Moreno B, Urbina JA, Oldfield E, Bailey BN, Rodrigues CO, Docampo R. 31P NMR spectroscopy of Trypanosoma brucei, Trypanosoma cruzi, and Leishmania major. Evidence for high levels of condensed inorganic phosphates. J Biol Chem. 2000;275:28356–28362. doi: 10.1074/jbc.M003893200. [DOI] [PubMed] [Google Scholar]
- Graham RC Jr, Karnovsky MJ. Glomerular permeability. Ultrastructural cytochemical studies using peroxidases as protein tracers. J Exp Med. 1966;124:1123–1134. doi: 10.1084/jem.124.6.1123. [DOI] [PMC free article] [PubMed] [Google Scholar]
- Graham RC Jr, Karnovsky MJ. The early stages of absorption of injected horseradish peroxidase in the proximal tubules of mouse kidney: ultrastructural cytochemistry by a new technique. J Histochem Cytochem. 1966;14:291–302. doi: 10.1177/14.4.291. [DOI] [PubMed] [Google Scholar]
- Handley DA. Receptor-mediated binding, endocytosis and cellular processing of macromolecules conjugated with colloidal gold. Scanning Microsc. 1987;1:359–367. [PubMed] [Google Scholar]
- Neutra MR, Ciechanover A, Owen LS, Lodish HF. Intracellular transport of transferrin- and asialoorosomucoid-colloidal gold conjugates to lysosomes after receptor-mediated endocytosis. J Histochem Cytochem. 1985;33:1134–1144. doi: 10.1177/33.11.2997327. [DOI] [PubMed] [Google Scholar]
- Borges VM, Vannier-Santos MA, de Souza W. Subverted transferrin trafficking in Leishmania-infected macrophages. Parasitol Res. 1998;84:811–22. doi: 10.1007/s004360050493. [DOI] [PubMed] [Google Scholar]
- Bendayan M. Worth its weight in gold. Science. 2001;291:1363–1365. doi: 10.1126/science.291.5507.1363. [DOI] [PubMed] [Google Scholar]
- Vannier-Santos MA, de Souza SJ, Brentani RR, de Souza W. Polymorphonuclear leukocytes present laminin peptides in endocytic compartments. Biochem Biophys Res Commun. 1996;221:837–842. doi: 10.1006/bbrc.1996.0683. [DOI] [PubMed] [Google Scholar]