

Abstract
Nephrotic syndrome is characterized by increased triglycerides resulting from decreased clearance of VLDL and chylomicrons. These triglyceride-rich lipoproteins are structurally altered by interaction with HDL derived from animals with proteinuria and not as a consequence of hypoalbuminemia. HDL isolated from rats with massive proteinuria is depleted in apolipoprotein E (apoE). It is unknown at what threshold of urinary albumin loss HDL structure is altered, and it is unknown what effects proteinuria has on apolipoproteins other than apoE. Two models of albuminuria were used in Sprague-Dawley rats: Adriamycin and passive Heymann nephritis (HN). The adriamycin group was divided into minimal albumin excretion (MAE) and intermediate albumin excretion (MAE, 1 to 40; intermediate albumin excretion, 60 to 210 mg/d per 100 g body wt). Urinary albumin excretion exceeded 300 mg/d per 100 g body wt in the HN rats. HDL apolipoprotein composition was analyzed with SDS-PAGE densitometry and liquid chromatography–time of flight mass spectrometer mass spectrometry. HDL apoA-IV content relative to apoA-I was reduced at all levels of albuminuria (P < 0.0001). ApoE was not reduced in MAE but was significantly reduced in IAE (72%; P < 0.001). By contrast, apoA-II and apoC-III were each significantly increased with increasing UAE. ApoA-IV and apoE were decreased to approximately 10% of control in HDL isolated from rats with HN, whereas apoA-II, apoC-II, and apoC-III were each significantly increased relative to apoA-I. HDL is structurally altered by levels of albuminuria that are insufficient to change serum albumin levels and is progressively altered as albuminuria increases.
Hyperlipidemia in the nephrotic syndrome is a result of increased synthesis (1,2) and decreased catabolism (1,3,4). VLDL levels are increased predominantly as a consequence of decreased catabolism both in rats with the nephrotic syndrome (4) and in humans (5). VLDL from nephrotic rat plasma does not bind normally to vascular endothelial cells, a consequence of reduced apolipoprotein E (apoE) content. Nascent VLDL functions normally when secreted by nephrotic livers but acquires a structural and functional defect through interaction with nephrotic HDL after VLDL secretion (6). The alteration in HDL structure and function results directly from proteinuria (3,6) and not from hypoalbuminemia.
We have shown that defective clearance of VLDL in nephrotic rats requires interaction with HDL from proteinuric animals and that hypoalbuminemia does not deleteriously affect HDL structure. Although we have analyzed the effect of nephrotic range albuminuria on HDL structure, the effects of lesser amounts of albuminuria have not been well examined. Even small amounts of albuminuria are associated with increased relative risk for vascular disease in both diabetes (7,8) and hypertension (9,10). This association is generally believed to reflect underlying endothelial dysfunction in patients with microalbuminuria, causing both the renal albumin leak and the association with vascular disease. Nevertheless, the potential effect of albuminuria on HDL structure could provide a causal link between albuminuria and cardiovascular risk.
Microalbuminuria in humans is often associated with both the metabolic syndrome (11,12) and reduced levels of HDL. As urinary albumin excretion increases among patients with diabetes, the HDL size decreases (13). Activity of systemic lupus erythematosus is associated with proteinuria and low levels of HDL (14,15), but clearly the relationship between disease severity and HDL concentration may be confounded by other variables, including systemic inflammation (14). Although it is known that a nephrotic range of proteinuria decreases HDL apoE content, thereby altering its interaction with VLDL, lower levels of proteinuria may also alter HDL apolipoprotein content. We designed this study to examine the interrelationship between HDL structure and graded albuminuria in the subnephrotic to nephrotic range.
Materials and Methods
Animals
All protocols were approved by the Animal Resources Service committees at University of California Davis and VA Northern California Health Care System. Sprague-Dawley rats were purchased from Charles River (Wilmington, MD). For minimizing effects generated by the experimental model, two methods were used to induce proteinuria. Mild to moderate proteinuria was induced by the introduction of adriamycin by tail-vein injection at 2.5, 5.0, or 7.5 mg/kg as described previously (6). Proteinuria in the nephrotic range was induced by intraperitoneal injection of FX1A antibodies at 0.2 ml/kg. All rats were kept in 24-h light/dark rooms and fed standard rat diet ad libitum until the evening before the experiments. Five weeks after adriamycin injections, animals were housed in metabolic cages that allowed 24-h urine collections. Before all experiments, fasted rats were anesthetized with an intraperitoneal injection of 0.75 g/kg (control) or 0.40 g/kg (nephrotic) sodium pentobarbital and exsanguinated by aortic puncture. Urinary albumin excretion (UAE) was measured using the albumin blue 580 method (16,17). Four animal groups were generated (see Results section): Control (n =6), minimal albumin excretion (MAE; n =7), and intermediate albumin excretion (IAE; n =7). The animals with Heymann nephritis were killed in a separate experiment (n =8) along with independent controls (n =4).
Chemical Analysis
Enzymatic kits were used for the determination of plasma triglyceride concentrations (kit 2780–400H; Thermo DMA, Chatsworth, CA), plasma cholesterol (kit TR12351; Thermo DMA), phospholipids (kit 990–54009; WAKO Chemicals, Richmond, VA), and lecithin-cholesterol acyltransferase (LCAT) (Roar Biomedicals, New York, NY).
Isolation and Content of HDL
HDL was isolated using the sequential flotation method described by Schumaker and Puppione (18). Plasma was handled using the method recommended by Edelstein and Scanu (19).
Apolipoprotein content of HDL was first determined by SDS-PAGE under denaturing conditions on 4 to 20% polyacrylamide gels and stained using SYPRO orange (Molecular Probes, Eugene, OR) and scanned using a STORM imager (Amersham Biosciences, Piscataway, NJ). The resulting images were analyzed using the accompanying ImageQuant software, version 5.0.
Alternatively, HDL composition was analyzed using HPLC (Waters 2795) coupled to an electrospray ionization (ESI) source and time of flight mass spectrometer (TOF; Micromass LCT, Manchester, UK). A 50-μl aliquot of each isolated fraction was separated using reverse-phase column chromatography (2.1 × 250-mm, 5-μm silica, 300-Å pore with polymeric bonded C18; Vydac 218TP52). Samples were separated using a gradient of Solvent A (98:2 water/acetonitrile [vol/vol] with 0.1% trifluroacetic acid) and Solvent B (2:98 water/acetonitrile [vol/vol] with 0.1% trifluroacetic acid). Initial conditions were 75% A, linearly ramped after injection to 42% B at 16 min and held for 4 min, before returning to the initial conditions and reconditioning the column for 2 min. Mass spectral data (800 to 2000 Da) were acquired from 7 to 20 min using the following conditions: Capillary voltage (3.25 kV), extraction cone (3.0 V), and sampling cone voltage (30.0 V). The mass spectrometer was calibrated using a solution of polyalanine and cyclodextrin before analysis, and leucine enkephalin was infused as a lock mass standard throughout the analysis to ensure accurate mass calibration.
Apolipoproteins in HDL then were analyzed by positive mode ESI/ TOF-mass spectrometry (MS). The molecular mass of each identified protein was established by deconvolution of the associated multicharge envelope using MassLynx v 4.0 (Micromass), and individual apolipoproteins were identified by their calculated molecular mass from published sequence information. A published sequence for rat apoC-II is not available, and in this case, the mouse homolog is included for comparison. For allowing estimates of each observed protein, unique ions were selected from the multicharged envelopes and extracted from the total ion chromatograms. Ion selection was made to minimize interferences from closely eluting compounds. The resulting extracted ion chromatograms then were integrated, and the area counts were used to estimate the apolipoprotein content of each analyzed sample. Because quantitative calibration standards were not available, the relative content of each apolipoprotein was normalized to apoA-I in HDL and to total phospholipids in VLDL.
Statistical Analyses
Apolipoprotein abundance was normalized to apoA-I content to assess the apolipoprotein relative abundance per particle. A principal components analysis was performed on these data using Multivariate Analysis Add-in for Excel, Version 1.2 (Bristol Chemometrics, www.chm.bris.ac.uk/org/chemometrics) using mean centered data and allowing for four principal components. Significant differences were determined using linear regression analysis, ANOVA, or t test where appropriate.
Results
Animals
Regardless of the administered dose of adriamycin, animals that received adriamycin were divided into two levels of albuminuria: MAE and IAE. In all cases, including the group that received 7.5 mg/kg adriamycin, UAE was lower than albuminuria levels previously demonstrated to alter HDL structure and function (3,20). Administration of FX1A antibody did not produce graded levels of proteinuria. UAE was significantly increased in the MAE, IAE, and HN groups. Serum albumin was decreased similarly in the IAE and HN rats. UAE, however, was significantly greater in HN than in IAE as were serum triglycerides and serum cholesterol (Figure 1).
Figure 1.
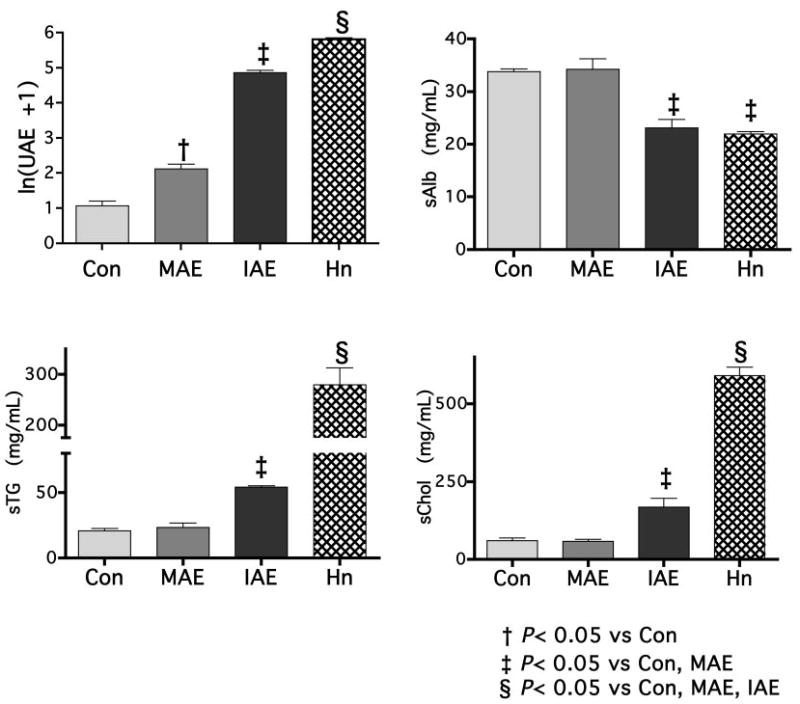
Experimental animals distributed into groups on the basis of proteinuria and albuminuria. Injection of adriamycin at 2.5, 5.0, and 7.5 mg/kg resulted in animals with levels of urinary protein that could be categorized into two groups. Some animals had low albuminuria levels that were insufficient to result in reduced albumin, whereas a second group had levels of albuminuria that were sufficient to result in a reduction in serum albumin as well (68% of control or minimal albumin excretion [MAE]).
HDL Composition by SDS-PAGE
Apolipoproteins were identified on SDS-PAGE by their apparent molecular weight as described previously (6). By SDS-PAGE, only apoA-I, apoE, and apoA-IV were well resolved and identified with confidence. Low molecular weight apolipoproteins, apoC and apoA-II, were summed to determine whether there was a cumulative effect of proteinuria on this subset. The apoA-I/total protein ratio was positively correlated with ln(UAE) (r2 =0.701, P < 0.0001), indicating that with increasing albuminuria, HDL becomes relatively enriched in apoA-I and has less accompanying apoproteins (Figure 2). However, after segregating the adriamycin-treated animals on the basis of albumin excretion, we found that the apoA-I/protein ratio was increased only in the IAE animals (control, 0.403 ± 0.034; MAE, 0.403 ± 0.020; IAE, 0.645 ± 0.025; P <0.001; Figure 2). The apoA-I/cholesterol and the apoA-I/phospholipid ratio were unchanged by albuminuria in animals that had less than nephrotic-range proteinuria (adriamycin group).
Figure 2.
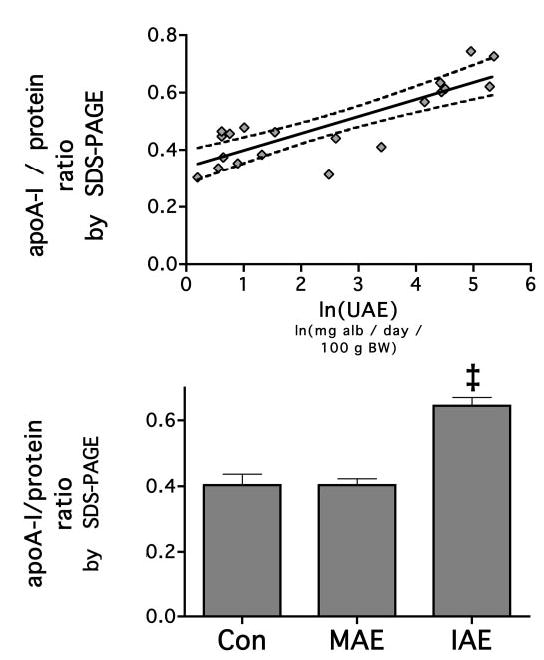
HDL apolipoprotein A-I (apoA-I) content increases with increasing levels of urinary albumin loss. ApoA-I was measured by electrospray ionization time of flight mass spectrometry (ESI-TOF-MS) and its proportion to total protein as measured by BCA analysis of whole HDL. The fraction of apoA-I to total protein was measured, and its relationship to urinary albumin excretion (UAE) was determined by linear regression analysis. The solid line represents the linear relationship, and the dotted line represents the 95% confidence interval (P = 0.0026). When the animals were categorized into groups by UAE, the MAE group was not increased compared with control, but the intermediate albumin excretion (IAE group was). ‡P < 0.05 versus control and MAE.
ApoE and apoA-IV were normalized to apoA-I levels to account for the perparticle abundance content. Both apoE and apoA-IV decreased in abundance with increasing albuminuria. The relationship between apoA-IV and ln(UAE) was strongest (r2 =0.786, P = 0.0001), but apoE also significantly correlated with ln(UAE) (r2 = 0.558, P = 0.0002; Figure 3A). This strong relationship between apoA-IV and urinary albumin was reflected in ANOVA. Compared with control, apoA-IV was consecutively reduced in MAE and IAE animals (0.248 ± 0.023, 0.199 ± 0.017, and 0.069 ± 0.013, respectively; P < 0.0001; Figure 3B). Conversely, apoE was not reduced with low levels of urinary albumin loss. ApoE content was not reduced in MAE HDL but was reduced in IAE rats (control, 0.558 ± 0.060 versus 0.584 ± 0.077 and 0.176 ± 0.029, respectively; P < 0.0001).
Figure 3.
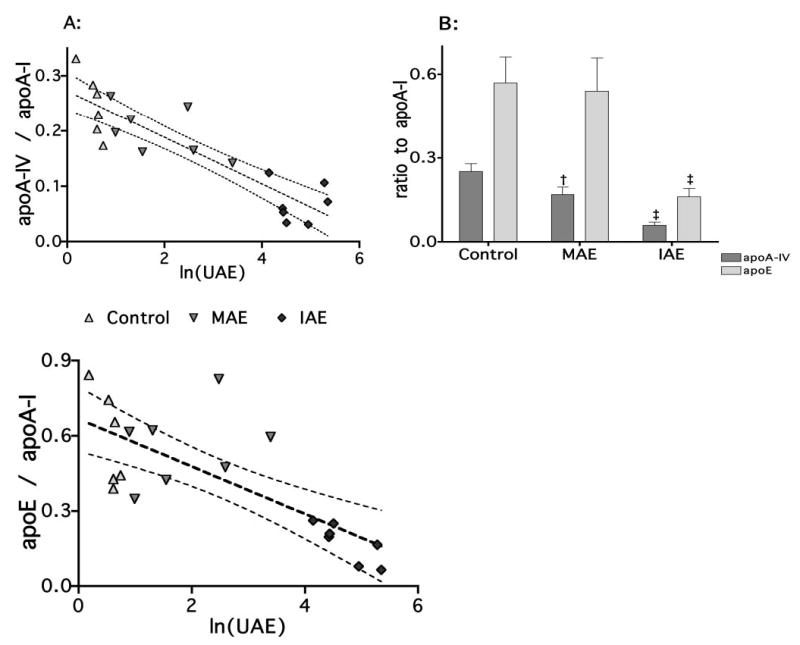
HDL apoE and apoA-IV content decreases as albuminuria increases. Content of HDL apoA-IV and apoE were first measured by SDS-PAGE (A). ApoA-I, apoE, and apoA-IV were clearly resolved. ApoA-IV and apoE were normalized to apoA-I content and analyzed by linear regression and two-way ANOVA. There was a strong linear relationship for both apoA-IV (r2 = 0.7855, P < 0.0001) and apoE (r2 = 0.5577, P = 0.0002). After the animals were sorted into control, MAE, and IAE groups, two-way ANOVA were performed (B). These results demonstrated that whereas apoA-IV decreased continuously with increasing UAE, with apoE, the MAE group was not reduced compared with control when expressed relative to apoA-I, the unit structural apolipoprotein of HDL. In each case, MAE animals have reduced HDL apoA-IV content compared with control, but the HDL content of apoE is not reduced. In IAE animals, the apoE levels are reduced compared with control and MAE, and apoA-IV levels are reduced again compared with control and MAE animals. †P < 0.05 versus control; ‡P < 0.05 versus control and MAE.
HDL Composition by ESI-TOF-MS
To confirm our SDS-PAGE data and overcome the difficulty in resolving low molecular weight apoproteins by SDS-PAGE, we used ESI-TOF-MS to validate and complement the SDS-PAGE analyses. Apolipoproteins were identified by their molecular mass relative to sequences contained in the references described in Table 1. The correspondence between the predicted and measured masses of proteins was within 1% in all but two cases, confirming the stability of the instrument mass calibration and the validity of the applied mass spectral deconvolution routines. An example of a raw and deconvoluted spectrum is shown in Figure 4. The predicted mass for rat apoC-II is not available and had to be compared with mouse apoC-II. The resultant error was 2.06%. The molecular mass of hamster apoC-II is 8204.1 (21), which is a difference of 3.29% with mouse apoC-II and a 1.25% difference with the mass observed in rats. We therefore concluded that the 8308.1 ± 13.9-Da protein observed at 12.45 min was rat apoC-II. The published mass for rat apoA-II is 8950.4 Da. We could not locate a protein with a similar mass. We did locate a protein with a mass of 8804.6 ± 7.0 Da, which corresponds to a mass error of 1.63% with apoA-II and 0.98% with apoC-III. Despite the apparent agreement with apoC-III, we designated this protein as apoA-II because apoC-III was identified with a precision of 0.06%. Furthermore, when the signal sequence of apoA-II is assumed to be ALVRRQ rather than ALVRR, the resultant error is 0.20%, suggesting that mature rat apoA-II may actually include residues 25 to 102 rather than 24 to 102 as previously reported. A similar assumption with any apoC did not produce an improved fit to the measured molecular weight. As described in Table 1, three unidentified proteins were observed in HDL fractions. Two proteins (tR = 11.84 and 11.87 min) showed masses close to those reported for immature apoC-I, but the absolute assignment of these proteins could not be made from the existing data. In addition, a protein that co-eluted with apoE could not be reconciled with any apolipoprotein, having a measured molecular mass of 13027.14 ± 7.95 Da.
Table 1.
Detected apolipoprotein massesa
| Peak | tRb (min) | Quant. Ion | m/z (Da) | Solved Mass (Da) | Predicted Mass (Da) | % Error |
|---|---|---|---|---|---|---|
| apoC-IV | 9.31 | M+5 | 1429.32 | 7142.7 ± 13.2 | 7147.6 (1) | 0.07 |
| apoC-I | 9.79 | M+5 | 1403.40 | 7010.0 ± 6.2 | 7014.6 (2) | 0.07 |
| Unknown Ac | 11.84 | M+6 | 1648.97 | 9888.5 ± 11.6 | 9854.3 (57) | 0.35 |
| Unknown Bc | 11.87 | M+6 | 1656.03 | 9931.0 ± 18.4 | 9854.3 (57) | 0.78 |
| apoC-III | 12.09 | M+6 | 1484.44 | 8897.0 ± 13.4 | 8891.3 (3) | 0.06 |
| apoC-II | 12.41 | M+6 | 1385.81 | 8308.1 ± 13.9 | 8483.0 (4)d | 2.06 |
| apoA-I | 12.74 | M+24 | 1140.95 | 27360.7 ± 20.0 | 27351.8 (5) | 0.03 |
| apoA-I (pro) | 12.90 | M+25 | 1131.67 | 28266.6 ± 19.4 | 28256.2 (60) | 0.04 |
| apoA-II* | 13.49 | M+6 | 1467.89 | 8804.6 ± 7.0 | 8950.4 (6)e 8822.4 | 1.63e 0.20 |
| apoA-IV | 14.70 | M+38 | 1117.52 | 42419.6 ± 28.6 | 42420.9 (7) | <0.01 |
| Unknown C | 15.34 | M+8 | 1628.25 | 13027.1 ± 7.9 | — | — |
| apoE | 15.34 | M+30 | 1128.62 | 33812.4 ± 49.6 | 34108.4 (8) | 0.87 |
apo, apolipoprotein.
The retention time of proteins using the described chromatographic method.
The reported mass of pro-apoC-I is the closest reported mass to unknown A and B and is used as a comparison.
The mouse apoC-II is used for a comparison because the rat apoC-II mass has not been previously reported.
A single amino acid difference in the reported apoA-II signal peptide length (signal peptide = alvrrq; m/z =8822.4 versus alvrr; m/z = 8950.4) reduces the error to within acceptable limits. This protein could also be apoC-III; however, a correlation exists between the proteins assigned as apoA-II and apoC-III (r2 = 0.850, P = 0.001), and the mass correspondence for apoC-III was excellent. Furthermore, two alternative apoC-III signal lengths that do not correspond to any observed plasma proteins have been reported.
Figure 4.
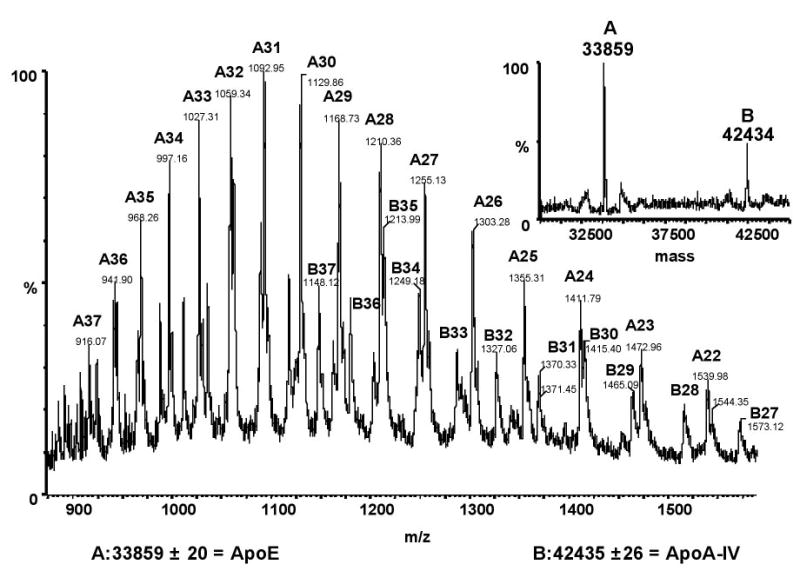
Sample mass spectra from ESI-TOF-MS. Approximately 50 μg of HDL protein was injected on a reversed-phase column and eluted as described. Apo-IV and apoA-E peaks overlapped, with peak apexes at 14.7 and 15.3 min, respectively. The combined spectrum from 14.5 to 15.5 min for the entire acquired mass range (m/z 880 to 1560) is shown. Ions and their associated mass and charge are given for apoE (A) and apoA-IV (B). The inset shows the deconvoluted mass spectrum and the corresponding solved masses of apoE (A) and apoA-IV (B).
The results from the ESI-TOF-MS, although pseudoquantitative, were consistent with the SDS-PAGE analysis. The ratio of apoA-I/total protein ratio positively correlated with ln(UAE) (r2 = 0.804, P < 0.003), again indicating that with increasing albuminuria, HDL becomes relatively enriched in apoA-I and has less accompanying apoproteins (Figure 5A). After the animals were separated into their respective groups, the apoA-I/ protein ratio was increased only in the IAE animals (control, 0.685 ± 0.033; MAE, 0.859 ± 0.057; IAE, 1.104 ± 0.045; P < 0.006; Figure 5B).
Figure 5.
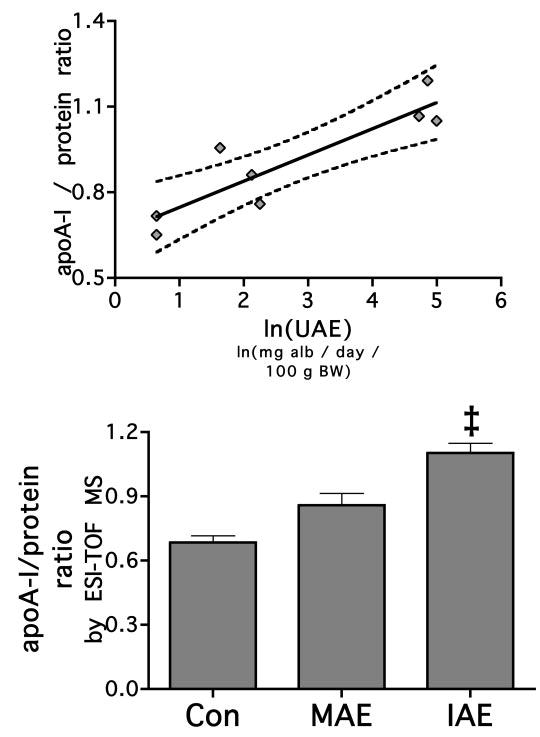
HDL apoA-I content increases with increasing levels of urinary albumin loss. ApoA-I was measured by ESI-TOF-MS and its proportion to total protein as measured by BCA analysis of whole HDL. The fraction of apoA-I to total protein was measured, and its relationship to UAE was determined by linear regression analysis. The solid line represents the linear relationship, and the dotted line represents the 95% confidence interval (P = 0.0026). When the animals were categorized into groups by UAE, the MAE group was not increased compared with control, but the IAE group was. ‡P < 0.05 versus control and MAE.
ApoE and apoA-IV were normalized to apoA-I levels to account for the per-particle abundance content. Both apoE and apoA-IV decreased in abundance with increasing albuminuria; however, although the negative correlation between apoA-IV and ln(UAE) was greater in this analysis (r2 = 0.946, P < 0.0001), there was no similar relationship with apoE (Figure 6A). With ANOVA, apoA-IV again was consecutively reduced in MAE and IAE animals (0.251 ± 0.028, 0.169 ± 0.026, and 0.059 ± 0.011, respectively; P < 0.0001). Conversely, apoE content was not reduced in MAE rats (0.569 ± 0.093 versus 0.540 ± 0.118) but was reduced in IAE rats (0.161 ± 0.030; P < 0.0001; Figure 6B).
Figure 6.
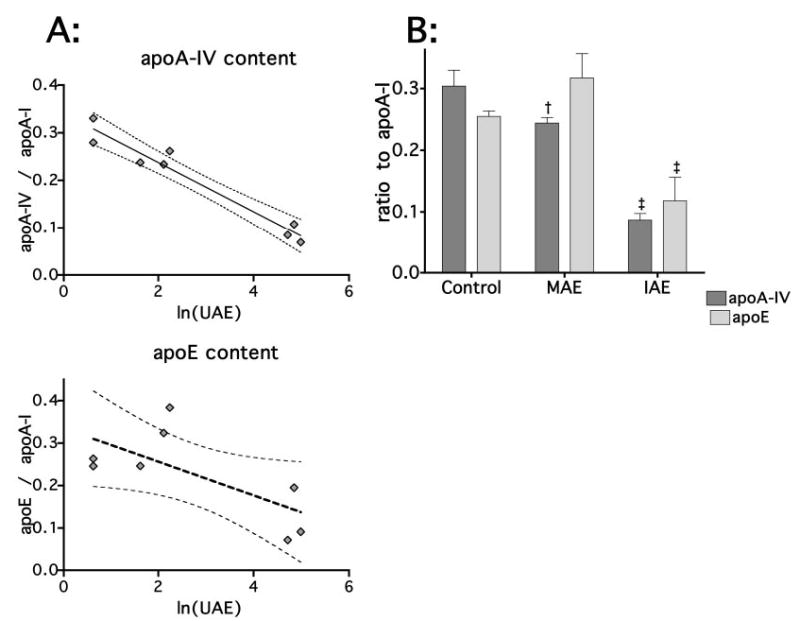
HDL apoE and apoA-IV by ESI-TOF-MS. Two control, three MAE, and three IAE rats were additionally analyzed by liquid chromatography (LC) ESI-TOF-MS (A). ApoA-I, apoE, and apoA-IV were reanalyzed. ApoA-IV and apoE were normalized to apoA-I content and analyzed by linear regression and two-way ANOVA. The improved quantification by MS demonstrated a strong linear relationship for apoA-IV (r2 =0.9460, P < 0.0001); however, the relationship between UAE and apoE was not as strong (r2 = 0.4773, P = 0.0578). After the animals were sorted into control, MAE, and IAE groups, two-way ANOVA replicated the findings using SDS-PAGE. Whereas apoA-IV decreased continuously with increasing UAE, among apoE, the MAE group was not reduced compared with control (B). †P 0.05 versus control; ‡P <0.05 versus control and MAE.
The depletion of non–apoA-I apolipoproteins was not characterized by uniform apolipoprotein depletion (Figure 7). HDL apoC-I, apoC-II, and apoC-IV content was unrelated to urinary albumin loss. Alternatively, HDL apoC-III and apoA-II content correlated positively with urinary albumin loss (r2 = 0.731, P = 0.0068; r2 = 0.604, P = 0.023, respectively). The results indicate that albuminuria-dependent depletion of non–apoA-I apolipoproteins was due to a depletion of apoA-IV and apoE, whereas the content of some small molecular weight apolipoproteins in HDL actually increased.
Figure 7.
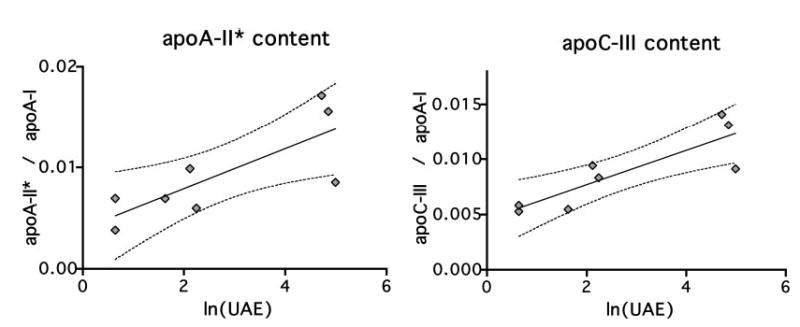
Additional apolipoproteins resolved by MS. In addition to apoA-IV and apoE, the improved resolution of liquid chromatography (LC) ESI-MS-TOF allowed for analysis of apoA-II, apoC-I, apoC-II, apoC-III, and apoC-IV. The proportions of HDL apolipoproteins relative to apoA-I, the unit structural apolipoprotein of HDL, were measured by ESI-TOF-MS, and their relationship to UAE was determined by linear regression analysis. Two additional relationships were significant: apoA-II and apoC-III. The solid line represents the linear relationship, and the dotted line represents the 95% confidence interval. ApoA-II, P =0.0232; apoC-III, P = 0.0068.
Apolipoprotein Composition in HN
We found that animals with nephrotic-range proteinuria exhibited a greater change in HDL apolipoprotein composition than observed in the adriamycin model. The changes observed in the MAE and IAE rats were amplified in HN. The apoA-I protein content was increased as was apoA-II and apoC-III, whereas apoA-IV and apoE content were greatly reduced, each by approximately an order of magnitude relative to control (Table 2).
Table 2.
HDL structural changes in passive Heymann nephritis by ESI-TOF-MSa
| apoA-I/Protein Ratio | apoA-II*b | apoA-IV | apoC-II | apoC-III | apoE | |
|---|---|---|---|---|---|---|
| Heymann | 0.773 ± 0.023 | 72.6 ± 3.5 | 7.9 ± 1.3 | 23.1 ± 0.9 | 102.6 ± 7.9 | 52.0 ± 6.5 |
| Control | 0.642 ± 0.036 | 17.3 ± 5.5 | 72.1 ± 11.5 | 15.8 ± 1.7 | 34.6 ± 2.4 | 415.6 ± 47.1 |
| Corrected P | < 0.0001 | < 0.001 | < 0.001 | 0.576 | < 0.001 | <0.001 |
ESI-TOF-MS, electrospray ionization time of flight mass spectrometry.
See note e in Table 1.
Discussion
We report here that HDL apolipoprotein content is related directly to urinary albumin loss and that even mild albumin loss results in altered HDL structure. In the rat, nephrotic-range proteinuria results in reduced HDL apoE content (3,6). It was reported previously that in rats with puromycin-induced nephrotic syndrome, HDL apoA-IV content is also reduced to approximately 10% that observed in control animals (22). We find similar results in extremely nephrotic rats with HN reported here. Our main finding, however, is that even small levels of urinary albumin loss, insufficient to change serum albumin or lipid levels, result in a decrease in HDL apoA-IV content, whereas HDL apoA-II and apoC-III content are increased.
These changes are unlikely due simply to changes in apolipoprotein gene expression in response to hypoalbuminemia. ApoA-I gene transcription and synthesis rate are increased approximately threefold in nephrotic rats (23). Although this might be expected to yield a particle that is relatively enriched in this apolipoprotein in comparison with others, such an explanation does not explain the relative increases in apoA-II, apoC-II, and C-III that were observed. Marshall reported an increased transcription of apoA-II of approximately 1.9-fold, significantly less than the 6.1-fold increase in apoA-I transcription that they observed (24). Thus, if these same changes in gene expression translate into protein synthesis, then a relative depletion of apoA-II in comparison with apoA-I should have been observed in our model. In addition, apoA-I transcription is increased in rats with hereditary analbuminemia (25), yet they have normal HDL structure. It has been reported that apoA-II displaces apoA-I from the HDL particle (26); however, we found that HDL apoA-I content increased concurrently with increasing apoA-II content.
HDL and components of HDL have been identified in the urine of nephrotic subjects (27). Finding specific apolipoproteins in the urine is not necessarily translated into the changes seen in serum levels of these proteins. Low molecular weight proteins are freely filtered by the kidney; thus, although renal failure might result in their accumulation (28), no change in their clearance would be anticipated to occur after changes in permselectivity. ApoA-II, apoC-II, and apoC-III are examples of such proteins; however, apoA-II and apoC-III are increased in all animals with proteinuria, and among HN animals, even apoC-II is increased relative to apoA-I.
It is equally difficult to explain most alterations in higher molecular weight apolipoproteins by urinary albumin loss. Approximately 25% of apoA-I is cleared by or eliminated by the kidney in normal rats as well as after development of the nephrotic syndrome (25), suggesting that changed permselectivity has little effect on glomerular sieving of this 27-kD apo-lipoprotein. Although HN represents an extreme of urinary protein loss, we find that even minimal levels of albuminuria result in a significant decrease in the content of apoA-IV. ApoA-IV is intermediate in size between apoA-I and LCAT and is approximately evenly distributed between HDL and free fractions (29), a distribution that potentially protects it from urinary loss regardless of dysfunction of the glomerular barrier. We observed here reductions in HDL apoA-IV content at very low levels of albuminuria, levels that are too low to result in a change in serum albumin concentration, thus suggesting that processes other than urinary protein loss may play a role in reducing HDL apoA-IV content. Furthermore, even massive levels of proteinuria do not result in decreased serum apoA-IV levels (30), suggesting that the affinity of HDL for apoA-IV may be reduced under conditions of microalbuminuria. These changes were independent of serum albumin concentration. Our observation that apoA-II and C-III also accumulate in HDL in a linear relationship with albuminuria suggests that processes other than urinary protein loss or dilution of all other apolipoproteins by an increasing apoA-I pool are responsible for changes in HDL structure.
At greater levels of urinary albumin loss, we observed a decrease in HDL apoE as previously observed. It is instructive to note that serum triglyceride or cholesterol levels did not increase at all at low levels of albuminuria, when HDL apoE content was no different from control, supporting our earlier hypothesis that HDL apoE depletion plays a role in hypertriglyceridemia (3).
The changes that we have demonstrated are important in understanding important risk factors associated with albuminuria. Although the role of apoA-IV as an activator of LCAT has been documented (31) and in humans as an activator of cholesterol ester transfer protein (32), its precise function is not well understood. Important for vascular function, apoA-IV reduces atherogenic risk (33,34) and oxidative stress (35). Mice that express human apoA-IV are less susceptible to atherosclerotic lesions even when expressed on a highly proatherogenic background such as the apoE knockout mouse (36). Vaziri et al. (37) demonstrated that LCAT activity was reduced in rats with nephrotic syndrome and albuminuria sufficient to reduce serum albumin levels to 55% of control. The disappearance of LCAT in plasma and the resultant appearance in the urine of LCAT activity (r2 = 0.62) lead Vaziri et al. (37) to speculate that glomerular protein loss explained LCAT depletion and connected urinary protein losses to increased lipid levels through that mechanism. The molecular mass of LCAT is roughly 66 kD (38,39), approximately that of albumin and of a size that would be most effected by changes in glomerular permselectivity. LCAT is loosely bound to HDL, dissociating on average once every catalytic cycle from HDL (40,41) and thus is accessible for filtration; however, apoA-IV levels are reduced in the presence of proteinuria too low to produce urinary loss of LCAT sufficient to anticipate any change in plasma level.
Elevated apoA-II is associated with insulin resistance and reduces the affinity of the HDL particle for the CD36 scavenger receptor (41). ApoA-II also inhibits LCAT activity (42,43) and cholesterol ester transfer protein (44) but increases hepatic lipase activity (45). Whereas increased hepatic lipase activity is associated with reduced atherogenic risk, reduced LCAT is pivotal in the maturation of HDL in this model. Thus, the changes in HDL structure associated with increasing urinary albumin loss should render HDL a less effective substrate for LCAT.
ApoC-III is strongly related to hypertriglyceridemia by inhibition of lipoprotein lipase (LpL) (46,47) and interferes with apoE-mediated binding to LDL receptors (48). Consequently, apoC-III is associated with increased risk for aortic valve sclerosis (49) and likely plays a causative role in cardiovascular disease (50). ApoC-II is an LpL activator, and the apoC-II/C-III ratio has been observed to be decreased in VLDL obtained from nephrotic rats (51). We demonstrate here that this ratio in HDL shows a relationship to urinary albumin loss. It is unclear whether the alteration in VLDL apoC content is conferred upon it by HDL; however, the depletion of apoE from VLDL indeed does result from exposure to HDL obtained from proteinuric animals (6), and similar alterations in apoC composition of VLDL may well result from the changes that we find here in HDL. Because apoC-II is an LpL activator competitively inhibited by C-III, HDL may further contribute to delayed VLDL catabolism in this way. It is unclear what is responsible for the accumulation of these apolipoproteins as a result of proteinuria while the same process depletes HDL of other proteins.
A well-documented relationship exists between microalbuminuria and cardiovascular risk in both diabetic and hypertensive patients (7,8,10,52–54). In this study, the observed that changes in HDL structure associated with minimal albuminuria would mechanistically favor increased cardiovascular risk, suggesting that these changes themselves may indicate novel risk factors to the processes associated with increased cardiovascular disease in nephrotic subjects. It is believed that the association between microalbuminuria and cardiovascular risk is a reflection of either endothelial injury or changes in vascular compliance associated with vascular injury and reported by urinary albumin loss. It is possible, however, that even these small amounts of urinary protein loss may alter lipoprotein structure and perturb normal lipoprotein metabolism contributing to rather than simply reporting vascular injury.
Acknowledgments
This research was supported in part by the research service of the Department of Veteran’s Affairs and in part by a gift from Dialysis Clinics Incorporated (Nashville, TN). Additional support was provided by the National Institute of Environmental Health Sciences (NIEHS; R37 ES02710), NIEHS Superfund Basic Research Program (P42 ES04699), the NIEHS Center for Environmental Health Sciences (P30 ES05707), the NIEHS Center for Children’s Environmental Health & Disease Prevention (1 P01 ES11269), and the National Institutes of Health/National Institute of Diabetes and Digestive and Kidney Diseases University of California Davis Clinical Nutrition Research Unit (P30 DK35747).
References
- 1.de Sain-van der Velden MG, Kaysen GA, Barrett HA, Stellaard F, Gadellaa MM, Voorbij HA, Reijngoud DJ, Rabelink TJ. Increased VLDL in nephrotic patients results from a decreased catabolism while increased LDL results from increased synthesis. Kidney Int. 1998;53:994–1001. doi: 10.1111/j.1523-1755.1998.00831.x. [DOI] [PubMed] [Google Scholar]
- 2.Warwick GL, Packard CJ, Demant T, Bedford DK, BoultonJones JM, Shepherd J. Metabolism of apolipoprotein B-containing lipoproteins in subjects with nephrotic-range proteinuria. Kidney Int. 1991;40:129–138. doi: 10.1038/ki.1991.190. [DOI] [PubMed] [Google Scholar]
- 3.Shearer GC, Stevenson FT, Atkinson DN, Staprans I, Kay-sen GA. Hypoalbuminemia and proteinuria contribute separately to reduced lipoprotein catabolism in the nephrotic syndrome. Kidney Int. 2001;59:179–189. doi: 10.1046/j.1523-1755.2001.00478.x. [DOI] [PubMed] [Google Scholar]
- 4.Kaysen GA, Mehendru L, Pan XM, Staprans I. Both peripheral chylomicron catabolism and hepatic uptake of remnants are defective in nephrosis. Am J Physiol. 1992;263:F335–F341. doi: 10.1152/ajprenal.1992.263.2.F335. [DOI] [PubMed] [Google Scholar]
- 5.de Sain-van der Velden MG, Rabelink TJ, Gadellaa MM, Elzinga H, Reijngoud DJ, Kuipers F, Stellaard F. In vivo determination of very-low-density lipoprotein-apolipoprotein B100 secretion rates in humans with a low dose of l-[1–13C]valine and isotope ratio mass spectrometry. Anal Biochem. 1998;265:308–312. doi: 10.1006/abio.1998.2908. [DOI] [PubMed] [Google Scholar]
- 6.Shearer GC, Couser WG, Kaysen GA. Nephrotic livers secrete normal VLDL that acquire structural and functional defects following interaction with HDL. Kidney Int. 2004;65:228–237. doi: 10.1111/j.1523-1755.2004.00373.x. [DOI] [PubMed] [Google Scholar]
- 7.Dinneen SF, Gerstein HC. The association of microalbuminuria and mortality in non-insulin dependent diabetes mellitus. A systematic overview of the literature. Arch Intern Med. 1997;157:1413–1418. [PubMed] [Google Scholar]
- 8.Mattock MB, Morrish NJ, Viberti G, Keen H, Fitzgerald AP, Jackson G. Prospective study of microalbuminuria as predictor of mortality in NIDDM. Diabetes. 1992;41:736–741. doi: 10.2337/diab.41.6.736. [DOI] [PubMed] [Google Scholar]
- 9.Leoncini G, Sacchi G, Viazzi F, Ravera M, Parodi D, Ratto E, Vettoretti S, Tomolillo C, Deferrari G, Pontremoli R. Microalbuminuria identifies overall cardiovascular risk in essential hypertension: An artificial neural network-based approach. J Hypertens. 2002;20:1315–1321. doi: 10.1097/00004872-200207000-00018. [DOI] [PubMed] [Google Scholar]
- 10.Yudkin JS, Forrest RD, Jackson CA. Microalbuminuria as predictor of vascular disease in non-diabetic subjects. Lancet. 1988;2:530–533. doi: 10.1016/s0140-6736(88)92657-8. [DOI] [PubMed] [Google Scholar]
- 11.Palaniappan L, Carnethon M, Fortmann SP. Association between microalbuminuria and the metabolic syndrome: NHANES III. Am J Hypertens. 2003;16:952–958. doi: 10.1016/s0895-7061(03)01009-4. [DOI] [PubMed] [Google Scholar]
- 12.Hoehner CM, Greenlund KJ, Rith-Najarian S, Casper ML, McClellan WM. Association of the insulin resistance syndrome and microalbuminuria among nondiabetic Native Americans. The Inter-Tribal Heart Project. J Am Soc Nephrol. 2002;13:1626–1634. doi: 10.1097/01.asn.0000015762.92814.85. [DOI] [PubMed] [Google Scholar]
- 13.Jenkins AJ, Lyons TJ, Zheng D, Otvos JD, Lackland DT, McGee D, Garvey WT, Klein RL. DCCT/EDIC Research Group: Lipoproteins in the DCCT/EDIC cohort: Associations with diabetic nephropathy. Kidney Int. 2003;64:817–828. doi: 10.1046/j.1523-1755.2003.00164.x. [DOI] [PubMed] [Google Scholar]
- 14.Svenungsson E, Gunnarsson I, Fei GZ, Lundberg IE, Klareskog L, Frostegard J. Elevated triglycerides and low levels of high-density lipoprotein as markers of disease activity in association with up-regulation of the tumor necrosis factor alpha/tumor necrosis factor receptor system in systemic lupus erythematosus. Arthritis Rheum. 2003;48:2533–2540. doi: 10.1002/art.11264. [DOI] [PubMed] [Google Scholar]
- 15.Manger K, Kusus M, Forster C, Ropers D, Daniel WG, Kalden JR, Achenbach S, Manger B. Factors associated with coronary artery calcification in young female patients with SLE. Ann Rheum Dis. 2003;62:846–850. doi: 10.1136/ard.62.9.846. [DOI] [PMC free article] [PubMed] [Google Scholar]
- 16.Kessler MA, Meinitzerv A, Petek W, Wolfbeis OS. Microalbuminuria and borderline-increased albumin excretion determined with a centrifugal analyzer and the Albumin Blue 580 fluorescence assay. Clin Chem. 1997;43:996–1002. [PubMed] [Google Scholar]
- 17.Kessler MA, Meinitzer A, Wolfbeis OS. Albumin blue 580 fluorescence assay for albumin. Anal Biochem. 1997;248:180–182. doi: 10.1006/abio.1997.2113. [DOI] [PubMed] [Google Scholar]
- 18.Schumaker VN, Puppione DL. Sequential flotation ultracentrifugation. Methods Enzymol. 1986;128:155–170. doi: 10.1016/0076-6879(86)28066-0. [DOI] [PubMed] [Google Scholar]
- 19.Edelstein C, Scanu AM. Precautionary measures for collecting blood destined for lipoprotein isolation. Methods Enzymol. 1986;128:151–155. doi: 10.1016/0076-6879(86)28065-9. [DOI] [PubMed] [Google Scholar]
- 20.Shearer GC, Couser WG, Kaysen GA. Endothelial chylomicron binding is altered by interaction with high-density lipoprotein in Heymann’s nephritis. Am J Kidney Dis. 2001;38:1385–1389. doi: 10.1053/ajkd.2001.29263. [DOI] [PubMed] [Google Scholar]
- 21.Andersson Y, Thelander L, Bengtsson-Olivecrona G. Demonstration of apolipoprotein CII in guinea pigs. Functional characteristics, cDNA sequence, and tissue expression. J Biol Chem. 1991;266:4074–4080. [PubMed] [Google Scholar]
- 22.Sparks CE, Tennenberg SD, Marsh JB. Related catabolism of the apolipoproteins of HDL in control and nephrotic rats. Biochim Biophys Acta. 1981;665:8–12. doi: 10.1016/0005-2760(81)90225-3. [DOI] [PubMed] [Google Scholar]
- 23.Sun X, Martin V, Weiss RH, Kaysen GA. Selective transcriptional augmentation of hepatic gene expression in the rat with Heymann nephritis. Am J Physiol. 1993;264:F441–F447. doi: 10.1152/ajprenal.1993.264.3.F441. [DOI] [PubMed] [Google Scholar]
- 24.Marshall JF, Apostolopoulos JJ, Brack CM, Howlett GL. Regulation of apolipoprotein gene expression and plasma high-density lipoprotein composition in experimental nephrosis. Biochim Biophys Acta. 1990;1042:271–279. doi: 10.1016/0005-2760(90)90153-o. [DOI] [PubMed] [Google Scholar]
- 25.Kaysen GA, Hoye E, Jones H, Jr, van Tol A, Joles JA. Effect of oncotic pressure on apolipoprotein A-I metabolism in the rat. Am J Kidney Dis. 1995;26:178–186. doi: 10.1016/0272-6386(95)90172-8. [DOI] [PubMed] [Google Scholar]
- 26.Labeur C, Lambert G, Van Cauteren T, Duverger N, Vanloo B, Chambaz J, Vandekerckhove J, Castro G, Rosseneu M. Displacement of apo A-I from HDL by apo A-II or its C-terminal helix promotes the formation of pre-beta1 migrating particles and decreases LCAT activation. Atherosclerosis. 1998;139:351–362. doi: 10.1016/s0021-9150(98)00096-3. [DOI] [PubMed] [Google Scholar]
- 27.Short CD, Durrington PN, Mallick NP, Hunt LP, Tetlow L, Ishola M. Serum and urinary high density lipoproteins in glomerular disease with proteinuria. Kidney Int. 1986;29:1224–1228. doi: 10.1038/ki.1986.131. [DOI] [PubMed] [Google Scholar]
- 28.Vincent C, Revillard JP, Traeger J. Alteration of beta2-microglobulin metabolism in terminal chronic renal insufficiency. Pathol Biol (Paris) 1978;26:303–306. [PubMed] [Google Scholar]
- 29.DeLamatre JG, Hoffmeier CA, Lacko AG, Roheim PS. Distribution of apolipoprotein A-IV between the lipoprotein and the lipoprotein-free fractions of rat plasma: Possible role of lecithin:cholesterol acyltransferase. J Lipid Res. 1983;24:1578–1585. [PubMed] [Google Scholar]
- 30.van Goor H, van der Horst ML, Atmosoerodjo J, Joles JA, van Tol A, Grond J. Renal apolipoproteins in nephrotic rats. Am J Pathol. 1993;142:1804–1812. [PMC free article] [PubMed] [Google Scholar]
- 31.Steinmetz A, Utermann G. Activation of lecithin:cholesterol acyltransferase by human apolipoprotein A-IV. J Biol Chem. 1985;260:2258–2264. [PubMed] [Google Scholar]
- 32.Guyard-Dangremont V, Lagrost L, Gambert P. Comparative effects of purified apolipoproteins A-I, A-II, and A-IV on cholesteryl ester transfer protein activity. J Lipid Res. 1994;35:982–992. [PubMed] [Google Scholar]
- 33.Warner MM, Guo J, Zhao Y. The relationship between plasma apolipoprotein A-IV levels and coronary heart disease. Chin Med J (Engl) 2001;114:275–279. [PubMed] [Google Scholar]
- 34.Verges BL, Lagrost L, Vaillant G, Petit JM, Cohen M, Gambert P, Brun JM. Macrovascular disease is associated with increased plasma apolipoprotein A-IV levels in NIDDM. Diabetes. 1997;46:125–132. doi: 10.2337/diab.46.1.125. [DOI] [PubMed] [Google Scholar]
- 35.Ostos MA, Conconi M, Vergnes L, Baroukh N, Ribalta J, Girona J, Caillaud JM, Ochoa A, Zakin MM. Antioxidative and antiatherosclerotic effects of human apolipoprotein A-IV in apolipoprotein E-deficient mice. Arterioscler Thromb Vasc Biol. 2001;21:1023–1028. doi: 10.1161/01.atv.21.6.1023. [DOI] [PubMed] [Google Scholar]
- 36.Vergnes L, Baroukh N, Ostos MA, Castro G, Duverger N, Nanjee MN, Najib J, Fruchart JC, Miller NE, Zakin MM, Ochoa A. Expression of human apolipoprotein A-I/C-III/ A-IV gene cluster in mice induces hyperlipidemia but reduces atherogenesis. Arterioscler Thromb Vasc Biol. 2000;20:2267–2274. doi: 10.1161/01.atv.20.10.2267. [DOI] [PubMed] [Google Scholar]
- 37.Vaziri ND, Liang K, Parks JS. Acquired lecithin-cholesterol acyltransferase deficiency in nephrotic syndrome. Am J Physiol Renal Physiol. 2001;280:F823–F828. doi: 10.1152/ajprenal.2001.280.5.F823. [DOI] [PubMed] [Google Scholar]
- 38.Lima VL, Harry DS, McIntyre N, Owen JS, Chaves ME. Characterization and potential uses of rabbit polyclonal antibodies against human plasma lecithin-cholesterol acyltransferase. Braz J Med Biol Res. 1996;29:957–968. [PubMed] [Google Scholar]
- 39.Wang J, Gebre AK, Anderson RA, Parks JS. Short sequence-paper: Cloning and in vitro expression of rat lecithin:cholesterol acyltransferase. Biochim Biophys Acta. 1997;1346:207–211. doi: 10.1016/s0005-2760(97)00055-6. [DOI] [PubMed] [Google Scholar]
- 40.Adimoolam S, Jin L, Grabbe E, Shieh JJ, Jonas A. Structural and functional properties of two mutants of lecithin-cholesterol acyltransferase (T123I and N228K) J Biol Chem. 1998;273:32561–32567. doi: 10.1074/jbc.273.49.32561. [DOI] [PubMed] [Google Scholar]
- 41.Jin L, Shieh JJ, Grabbe E, Adimoolam S, Durbin D, Jonas A. Surface plasmon resonance biosensor studies of human wild-type and mutant lecithin cholesterol acyltransferase interactions with lipoproteins. Biochemistry. 1999;38:15659–15665. doi: 10.1021/bi9916729. [DOI] [PubMed] [Google Scholar]
- 42.de Beer MC, Castellani LW, Cai L, Stromberg AJ, de Beer FC, van der Westhuyzen DR. ApoA-II modulates the association of HDL with class B scavenger receptors SR-BI and CD36. J Lipid Res. 2004;45:706–715. doi: 10.1194/jlr.M300417-JLR200. [DOI] [PubMed] [Google Scholar]
- 43.Durbin DM, Jonas A. The effect of apolipoprotein A-II on the structure and function of apolipoprotein A-I in a homogeneous reconstituted high density lipoprotein particle. J Biol Chem. 1997;272:31333–31339. doi: 10.1074/jbc.272.50.31333. [DOI] [PubMed] [Google Scholar]
- 44.Durbin DM, Jonas A. Lipid-free apolipoproteins A-I and A-II promote remodeling of reconstituted high density lipoproteins and alter their reactivity with lecithin:cholesterol acyltransferase. J Lipid Res. 1999;40:2293–2302. [PubMed] [Google Scholar]
- 45.Lagrost L, Persegol L, Lallemant C, Gambert P. Influence of apolipoprotein composition of high density lipoprotein particles on cholesteryl ester transfer protein activity. Particles containing various proportions of apolipoproteins AI and AII. J Biol Chem. 1994;269:3189–3197. [PubMed] [Google Scholar]
- 46.Hime NJ, Barter PJ, Rye KA. The influence of apolipoproteins on the hepatic lipase-mediated hydrolysis of high density lipoprotein phospholipid and triacylglycerol. J Biol Chem. 1998;273:27191–27198. doi: 10.1074/jbc.273.42.27191. [DOI] [PubMed] [Google Scholar]
- 47.Brown WV, Baginsky ML. Inhibition of lipoprotein lipase by an apoprotein of human very low density lipoprotein. Biochem Biophys Res Commun. 1972;46:375–382. doi: 10.1016/s0006-291x(72)80149-9. [DOI] [PubMed] [Google Scholar]
- 48.Moberly JB, Attman PO, Samuelsson O, Johansson AC, Knight-Gibson C, Alaupovic P. Apolipoprotein C-III, hypertriglyceridemia and triglyceride-rich lipoproteins in uremia. Miner Electrolyte Metab. 1999;25:258–262. doi: 10.1159/000057457. [DOI] [PubMed] [Google Scholar]
- 49.Clavey V, Lestavel-Delattre S, Copin C, Bard JM, Fruchart JC. Modulation of lipoprotein B binding to the LDL receptor by exogenous lipids and apolipoproteins CI, CII, CIII, and E. Arterioscler Thromb Vasc Biol. 1995;15:963–971. doi: 10.1161/01.atv.15.7.963. [DOI] [PubMed] [Google Scholar]
- 50.Gerber Y, Goldbourt U, Feinberg MS, Segev S, Harats D. Are triglyceride-rich lipoproteins associated with aortic valve sclerosis? A preliminary report Atherosclerosis. 2003;170:301–305. doi: 10.1016/s0021-9150(03)00292-2. [DOI] [PubMed] [Google Scholar]
- 51.Olivieri O, Bassi A, Stranieri C, Trabetti E, Martinelli N, Pizzolo F, Girelli D, Friso S, Pignatti PF, Corrocher R. Apolipoprotein C-III, metabolic syndrome, and risk of coronary artery disease. J Lipid Res. 2003;44:2374–2381. doi: 10.1194/jlr.M300253-JLR200. [DOI] [PubMed] [Google Scholar]
- 52.Hirano T, Ebara T, Furukawa S, Nagano S, Takahashi T. Mechanism of hypertriglyceridemia in Dahl salt-sensitive rats, an animal model of spontaneous nephrotic syndrome. Metabolism. 1994;43:248–256. doi: 10.1016/0026-0495(94)90253-4. [DOI] [PubMed] [Google Scholar]
- 53.Yokoyama H, Aoki T, Imahori M, Kuramitsu M. Subclinical atherosclerosis is increased in type 2 diabetic patients with microalbuminuria evaluated by intima-media thickness and pulse wave velocity. Kidney Int. 2004;66:448 – 454. doi: 10.1111/j.1523-1755.2004.00752.x. [DOI] [PubMed] [Google Scholar]
- 54.Yuyun MF, Khaw KT, Luben R, Welch A, Bingham S, Day NE, Wareham NJ. Microalbuminuria, cardiovascular risk factors and cardiovascular morbidity in a British population: The EPIC-Norfolk population-based study. Eur J Car-diovasc Prev Rehabil. 2004;11:207–213. doi: 10.1097/01.hjr.0000133070.75016.1d. [DOI] [PubMed] [Google Scholar]
- 55.Pedrinelli R, Dell’Omo G, Penno G, Bandinelli S, Bertini A, Di Bello V, Mariani M. Microalbuminuria and pulse pressure in hypertensive and atherosclerotic men. Hypertension. 2000;35:48–54. doi: 10.1161/01.hyp.35.1.48. [DOI] [PubMed] [Google Scholar]