

Abstract
This paper provides an electrical description of the generation of slow waves in the guinea-pig gastric antrum. A short segment of a circular smooth muscle bundle with an attached network of myenteric interstitial cells of Cajal (ICC-MY) and longitudinal muscle sheet was modelled as three electrical compartments with resistive connexions between the ICC-MY compartment and each of the smooth muscle compartments. The circular smooth muscle layer contains a proportion of intramuscular interstitial cells of Cajal (ICC-IM), responsible for the regenerative component of the slow wave. Hence the equivalent cell representing the circular muscle layer incorporated a mechanism, modelled as a two stage reaction, which produces an intracellular messenger. The first stage of the reaction is proposed to be activated in a voltage-dependent manner as described by Hodgkin and Huxley. A similar mechanism was incorporated into the equivalent cell describing the ICC-MY network. Spontaneous discrete transient depolarizations, termed unitary potentials, are detected in records taken from either bundles of circular smooth muscle containing ICC-IM or from ICC-MY. In the simulation the mean rate of discharge of unitary potentials was allowed to vary with the concentration of messenger according to a conventional dose–effect relationship. Such a mechanism, which describes regenerative potentials generated by the circular muscle layer, also simulated the plateau component of the pacemaker potential in the ICC-MY network. A voltage-sensitive membrane conductance was included in the ICC-MY compartment; this was used to describe the primary component of the pacemaker potential. The model generates a range of membrane potential changes with properties similar to those generated by the three cell types present in the intact tissue.
Many regions of the gastrointestinal tract rhythmically generate long lasting waves of depolarization, slow waves, in the absence of neuronal or hormonal stimulation (Tomita, 1981). Slow waves are initiated by a network of interstitial cells of Cajal (ICC) which most frequently lies near the myenteric plexus (ICC-MY; Sanders, 1996). Thus slow waves are not detected in tissues taken from the small intestine of mutant mice which lack ICC-MY (Ward et al. 1994). ICC-MY in the gastric antrum of guinea-pigs or mice and ICC-MY in the small intestine of mice generate large-amplitude, long-lasting pacemaker potentials (Dickens et al. 1999; Hirst & Edwards, 2001; Kito et al. 2002; Hirst et al. 2002a; Kito & Suzuki, 2003). ICC-MY are electrically coupled to the longitudinal and circular muscle layers, allowing each pacemaker potential to passively depolarize them (Dickens et al. 1999; Hirst & Edwards, 2001; Cousins et al. 2003). In the antral circular muscle layer, each passive wave of pacemaker depolarization is augmented by a secondary wave of depolarization (Ohba et al. 1975), which is initiated by intramuscular ICC (ICC-IM) that lie amongst the smooth muscle cells in the circular layer (Burns et al. 1997; Dickens et al.1999, 2001; Hirst et al. 2002a).
Pacemaker potentials generated by antral and intestinal ICC-MY have two components: a primary component is followed by a plateau component (Dickens et al. 1999; Hirst & Edwards, 2001; Kito & Suzuki, 2003). The primary component appears to involve a set of voltage-activated channels: the plateau component appears to rely on the release of calcium ions, Ca2+, from inositol 1,4,5-trisphosphate (IP3)-dependent internal stores (Suzuki et al. 2000; Hirst & Edwards, 2001). Primary components display many of the properties that are associated with calcium action potentials generated by the activation of T-type calcium channels (see also Lee & Sanders, 1993). They are abolished when the external concentration of calcium ions, [Ca2+]o, is lowered and by nickel ions (Kito et al. 2002) but persist in the presence of high concentrations of organic Ca2+ antagonists (Dickens et al. 1999). They are generated at membrane potentials near the resting value and are inactivated by moderate depolarization (Kito et al. 2002). The plateau component is little affected by reducing [Ca2+]o but is selectively abolished by caffeine and by some chloride channel antagonists (Dickens et al. 1999; Hirst & Edwards, 2001; Kito et al. 2002). Pacemaker activity stops only when both components are abolished, indicating that either component can occur independently (Kito & Suzuki, 2003). All ICC examined to date generate an ongoing discharge of spontaneous depolarizing potentials, termed unitary potentials (Edwards et al. 1999; Dickens et al. 2001; Hirst & Edwards, 2001; Beckett et al. 2004), or spontaneous inward currents (Sergeant et al. 2001). These result from the release of Ca2+ from internal stores and the direct (Hirst et al. 2002b; Kito et al. 2002) or indirect (Koh et al. 2002) activation of sets of ion-selective channels in the membranes of ICC. In gastric ICC-MY, after each pacemaker potential the discharge of unitary potentials occurs at a very low rate and gradually increases in frequency until the summed discharge reaches the threshold of the primary component. The primary component depolarizes the ICC-MY network, leading to a greatly accelerated rate of discharge of unitary potentials which sum to give rise to the plateau component of the pacemaker potential. As each pacemaker potential terminates, the discharge of unitary potentials falls to a low level and the cycle repeats (Hirst & Edwards, 2001).
The aim of this paper was to derive an electrical model which would describe the generation of slow waves in the circular layer of the guinea-pig antrum. To do this it was necessary to construct a three compartment model in which ICC-MY were linked to the adjacent circular and longitudinal muscle layers. The pathway used to describe the activation of ICC by depolarization appears independently in both the circular muscle and the ICC-MY equivalent cells in this model. ICC-IM and ICC-MY increase their rates of discharge of unitary potentials about 1 s after they have been depolarized (Suzuki & Hirst, 1999; Edwards et al. 1999; Hirst & Edwards, 2001). In the circular layer a change in [Ca2+]i cannot be detected during the latent period (Hirst et al. 2002b) but an increase in [Ca2+]i coincides with the increased frequency of unitary potentials (Hirst et al. 2002b). Presumably the membranes of ICC-IM sense the change in membrane potential and activate a pathway which ultimately leads to the release of Ca2+ from internal stores. Given the long latency it seems likely that the pathway involves the formation of a second messenger. We have used a Hodgkin and Huxley-like gating mechanism (Hodgkin & Huxley, 1952) to describe the modulation of a two-step reaction cascade that leads to the formation of a second messenger, presumably IP3, and the release of Ca2+ from internal stores. The relationship between second messenger concentration and frequency of discharge of unitary potentials is described using a conventional dose–effect relationship (Edwards & Hirst, 2003). After making a number of simplifying assumptions the model adequately described the generation of slow waves in the guinea-pig gastric antrum.
Methods
Physiological methods
All the experimental data used as a basis for the development of the electrical model have been published previously (Dickens et al. 1999; Suzuki & Hirst, 1999; Edwards et al. 1999; Hirst & Edwards, 2001; Cousins et al. 2003). All procedures used for the acquisition of physiological data were approved by the Animal Experimentation Ethics Committee of Melbourne University. Data from four separate experimental series are used. In the first set of experiments, intracellular recordings were made from longitudinal muscle cells, ICC-MY and circular smooth muscle cells lying near the greater curvature in the gastric antrum of guinea-pigs (Dickens et al. 1999). In the second set of experiments the passive and active electrical properties of bundles of circular muscle from the antrum were determined (Suzuki & Hirst, 1999; Edwards et al. 1999). In the third set of experiments, recordings were made from ICC-MY and the longitudinal muscle cells using preparations which consisted solely of the longitudinal muscle layer with the ICC-MY network attached; in these experiments the circular muscle layer had been previously dissected away (Hirst & Edwards, 2001). In the fourth set of experiments small preparations, containing the longitudinal layer, the ICC-MY network and the circular layer, were dissected out and pinned out to allow recordings to be made from them. Recordings were made from the three cell types and the electrical connectivity between different cell layers was assessed by injecting current into one cell type and recording the voltage change produced in a second cell type (Cousins et al. 2003). In each experimental series nifedipine (1 μm, obtained from Sigma Chemical Co.) was routinely added to the physiological saline to prevent involvement of L-type calcium channels in membrane potential changes. The addition of nifedipine had little effect on the amplitudes or time courses of either pacemaker potentials (Dickens et al. 1999) or slow waves (Suzuki & Hirst, 1999). It did, however, alter the time courses of follower potentials recorded from the longitudinal layer in that, although the amplitude of follower potentials was little changed, the discharge of muscle action potentials which normally accompanies each follower potential was abolished (Dickens et al. 2000). All illustrations presented in this paper are unpublished examples of data from the five published experimental reports.
Electrical simulations
Equivalent electrical circuit
The antrum consists of a thin layer of electrically interconnected longitudinal smooth muscle cells which is in turn electrically connected to an underlying network of ICC-MY. The network of ICC-MY is further connected to the circular layer of smooth muscle cells; these are arranged into syncytial bundles with ICC-IM distributed amongst them (Burns et al. 1997). Much of the electrophysiological data were recorded from short isopotential sections, cut from single circular muscle bundles. This allowed the circular muscle layer to be represented by a single equivalent cell (Edwards & Hirst, 2003).
Circular muscle equivalent cell
In the computations, the mean values of electrical parameters determined from analyses of the electrical coupling between the three cell layers were used (Table 1, Cousins et al. 2003). The equivalent electrical circuit used to represent the circular muscle layer is shown as the leftmost compartment in Fig. 1. The resting potential for circular muscle was set at −65 mV (ERest) and sections of bundles typically had input resistances of about 1.99 MΩ (gCM, 503nS) (Table 1, Cousins et al. 2003). A membrane time constant of 162 ms (Suzuki & Hirst, 1999), was used to describe the circular muscle compartment, giving a value of 81nF for the membrane capacitance (CCM) of this equivalent cell. The values for gCM and CCM are about twice as large as those used previously to model isolated circular muscle bundles (Edwards & Hirst, 2003). This difference arises because the preparations selected to determine the connectivity between layers (Cousins et al. 2003) were thicker individual circular smooth muscle bundles to preserve more of the ICC-MY and longitudinal muscle layers. These preparations had lower input resistances values (1.99 MΩ) than the isolated circular muscle bundles used to investigate regenerative potentials (4.4 MΩ; Table 1, Edwards et al. 1999). The time-varying conductance gReg(t) describes the fluctuating membrane conductance which corresponds to an ongoing discharge of unitary potentials. The amplitudes of unitary potentials were randomly drawn from an empirical distribution (Fig. 2D; Edwards et al. 1999; see also Edwards & Hirst, 2003) and were then scaled in accordance with the instantaneous unitary event rate in order to simulate more closely the magnitude of membrane potential fluctuations observed at depolarized potentials. This modification to the circular muscle model (Edwards & Hirst, 2003) is supported by the observation that evoked unitary potentials have larger mean amplitudes than do those occurring spontaneously at low frequencies (Edwards et al. 1999). Furthermore the amplitudes of elementary Ca2+ releases have been shown to scale with [IP3] in cultured HeLa cells (Bootman et al. 1997). Therefore, at maximum mean rate of unitary discharge, the mean unit amplitude was made five times larger than that at zero discharge. The time courses of the conductance increases underlying populations of unitary potentials were modelled as the difference between two exponential functions, having time constants of 434 ms and 77 ms, raised to the third power (Edwards et al. 1999; Hirst & Edwards, 2001). They occurred at intervals described by Poisson statistics, modelled by taking logarithms of an array of rectangularly distributed random numbers, and cumulatively summing to give an array of starting times with the initial mean discharge rate. These times were modified in accordance with the calculated changes in the mean discharge rate as the computation progressed (see Edwards et al. 1999). When unitary potentials occurred at higher frequencies they summed together and generated spontaneous regenerative potentials which are characteristic of this layer (Fig. 7C; Suzuki & Hirst, 1999; Van Helden et al. 2000). EReg represented the equilibrium potential for unitary potentials and regenerative potentials and was set at −20 mV, the extrapolated reversal potential of regenerative responses determined over a limited range of membrane potentials near resting potential (Hirst et al. 2002b).
Figure 1. Equivalent electrical circuit for a short isopotential segment of a single bundle of circular muscle from guinea-pig antrum, together with associated ICC-MY network and longitudinal muscle.

The circular layer is represented as a linear background conductance, gCM, with an equilibrium potential equal to the rest potential, ERest; gReg(t) represents the instantaneous regenerative conductance due to unitary discharge in ICC-IM with equilibrium potential, EReg. CCM represents the total membrane capacitance of the circular muscle layer and VCM is the membrane potential of the circular muscle layer. Similarly gMY represents the background conductance of the ICC-MY network with equilibrium potential equal to the rest potential for ICC-MY, ERest; gPrim(t) represents the rapid voltage-sensitive primary conductance and gPlat(t) the plateau conductance due to unitary discharge in ICC-MY with equilibrium potentials EPrim and EPlat, respectively. CMY represents the total membrane capacitance and VMY the membrane potential of the ICC-MY network. The longitudinal muscle compartment consists of a background conductance, gLM, with equilibrium potential equal to the rest potential, ERest, in parallel with CLM representing the membrane capacitance of the longitudinal muscle; VLM is the membrane potential of the longitudinal muscle equivalent cell. The electrical connexions of the ICC-MY network to the circular layer and to the longitudinal layer are represented by gIC and gIL, respectively. See text for justifications of the component values shown.
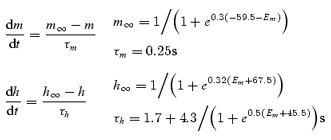
Figure 2. Description of parameters used to generate pacemaker potentials in ICC-MY and regenerative potentials in ICC-IM.

The upper left panel, A, shows the steady-state values of activation variable, m∞, and inactivation variable, h∞, used to describe the regenerative conductance gReg(t) in the equivalent cell representing the circular muscle layer; they are plotted as functions of membrane potential. Also shown are associated time constants, τm and τh, as functions of membrane potential. The upper right panel, B, shows the steady-state values of activation variable, A∞, and inactivation variable, N∞, used to describe the conductance gPrim(t) in the ICC-MY network compartment, again plotted as functions of membrane potential. Associated time constants, τA and τN, are also shown as functions of membrane potential. τA has a value of 0.15 s at all values of membrane potential and so appears coincident with the membrane potential axis at the scale shown. The lower left panel, C, shows the dose–effect relationship used to describe the change in mean rate of discharge of unitary potentials as a function of [messenger]. The maximum mean rate of discharge is shown as DMAX and the concentration for half-maximal effect was 750 nm. The lower right panel, D, shows the distribution of peak amplitudes of individual unitary potentials at resting membrane potential in an isolated circular muscle bundle.
Figure 7. Effect of separating the circular layer from the longitudinal and ICC-MY layers.

The left hand panels of three traces show simultaneous recordings of follower potentials recorded from a longitudinal muscle cell, A, and pacemaker potentials, B, recorded from a preparation whose circular muscle layer had been dissected away; the resting potentials were −65 mV and −63 mV, respectively. Trace C, shows spontaneous regenerative potentials recorded from a short segment of a circular muscle bundle from which the ICC-MY network and the longitudinal muscle layer had been removed, resting membrane potential −63 mV. The right hand panels of three traces show simulated spontaneous follower potentials, D, and the concurrently calculated pacemaker potential, E, with gIC set to zero. The trace F, shows the concurrently calculated activity in the circular compartment with gIC set to zero. The voltage and time calibration bars apply to all traces.
The time courses and behaviour of regenerative potentials can be described if they are assumed to be initiated by a two-stage chemical reaction producing an intracellular messenger, with the concentration of second messenger influencing the mean rate of occurrence of unitary potentials (Edwards & Hirst, 2003):
| (1) |
The first reaction step, which converts a precursor substance to an intermediate reagent, was made sensitive to membrane voltage by applying Hodgkin-Huxley activation (m) and inactivation (h) variables to the forward rate constant, mhKF, while allowing the reverse rate constant, KB (3.3 s−1) to be voltage independent (Hodgkin & Huxley, 1952). Figure 2A shows steady-state values, m∞ and h∞, together with their time constants τm and τh, as functions of membrane potential. The following equations were used to calculate m and h as before (eqn (2), Edwards & Hirst, 2003):
 |
(2) |
Hodgkin and Huxley were able to model the brief delay preceding the Na+ conductance change in the squid axon by making the conductance proportional to the third power of an activation variable, which obeyed a first order differential equation. However, the latency which precedes a regenerative potential in an isolated circular muscle bundle is long compared with its rise time (Suzuki & Hirst, 1999; Edwards et al. 1999; eqn (1) in Edwards & Hirst, 2003), and so a power very much greater than three would be required for its simulation. As an alternative, voltage steps were assumed to trigger the generation of messenger; this entire process was modelled as a two-stage reaction. The second reaction, in which the intermediate reagent was converted to the messenger, proceeded with net formation rate KM (0.4478 s−1), and the messenger was proposed to hydrolyse with rate constant KH (0.3 s−1) as shown. The mean rate of discharge of unitary events was linked to the concentration of messenger by a sigmoidal dose–effect relationship with a maximum discharge rate of 280 Hz (DMAX, Fig. 2C) and concentration for half-maximal effect of 750 nm. Two further adjustments were made to the model parameters previously used to simulate regenerative potentials in circular muscle bundles (Edwards & Hirst, 2003). The maximal forward rate of production of intermediate reagent (KF[precursor], see eqn (1) of Edwards & Hirst, 2003) was increased by 25% from 0.0157 to 0.0196 mm s−1. The time constant of inactivation at depolarized potentials for the first reaction step (τh1= 1.2 s; see eqn (2) of Edwards & Hirst, 2003) was set at a value between 0.9 and 2.1 s (mean 1.7 s) to mimic the range in durations of slow waves seen in the physiologically acquired data. The maximum value attained by gReg(t) at the peak of each slow wave under control conditions was about 0.8 μS.
ICC-MY network equivalent cell
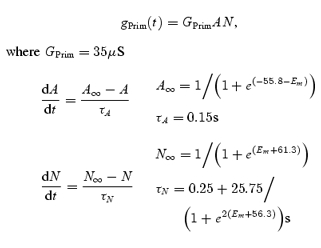
The circular layer equivalent cell was connected to the ICC-MY network by a resistance with a value of 3.27 MΩ (gIC, 306 nS; Table 1 of Cousins et al. 2003). The ICC-MY equivalent cell is shown as the central compartment of Fig. 1. The resting membrane potential for ICC-MY was again about −65 mV (ERest) (Hirst & Edwards, 2001), and the input resistance of the ICC-MY equivalent cell at resting membrane potential was 12.3 MΩ (gMY, 81nS; Cousins et al. 2003). The mean membrane time constant of the ICC-MY network was set at 50 ms, a value somewhat less than that of the smooth muscles cells. This is supported by the finding that murine ICC-MY have brief time constants (Goto et al. 2004). This gives a value of 4 nF for the membrane capacitance (CMY) of the ICC-MY equivalent cell. ICC-MY generate pacemaker potentials which are made up of two components, a primary transient component followed by a more slowly developing plateau component (Dickens et al. 1999; Hirst & Edwards, 2001). In the simulation, the primary component was generated by a voltage-dependent conductance, gPrim(t), with time and voltage dependencies described by conventional Hodgkin-Huxley formalism (Hodgkin & Huxley, 1952), as shown in the following equation set:
 |
(3) |
where A represents the activation variable and N represents the inactivation variable. Figure 2B shows the proposed dependence of steady-state values, A∞ and N∞, and their corresponding time constants, τA and τN, on the membrane potential of the ICC-MY equivalent cell. No specific experimental determination of the voltage sensitivities or temporal characteristics used in eqn (3) has been performed in this study, nor is one available in the literature. However, the values used yield simulations of the primary component which closely mimic physiological recordings (Fig. 9F). EPrim represented the equilibrium potential for the primary component of the pacemaker potential.
Figure 9. Effect of caffeine on pacemaker potentials generated by ICC-MY.

The left hand column of traces shows a pacemaker potential recorded in control solution, A, as the concentration of caffeine is increasing towards 3 mm, B, and in the presence of caffeine (3 mm), C. Note that the duration of the plateau component, A, was reduced, B, and then abolished, C. During the application of caffeine, the membrane potential increased from −64 to −67 mV. The right hand column of traces first shows a simulated pacemaker potential, D. The simulation was repeated, E, with the maximal forward rate of production of intermediate reagent, KF[precursor], reduced from the control level of 0.168 mm s−1 to 0.079 mm s−1, to simulate exposure of the preparation to an intermediate level of caffeine (< 3 mm). Finally the simulation was repeated, F, with KF[precursor] reduced to 0 mm s−1 to mimic complete exposure of the preparation to caffeine (3 mm). The voltage and time calibration bars apply to all traces.
The plateau component of the pacemaker potential generated by ICC-MY also results from the discharge of many unitary conductance increases occurring in the ICC-MY network. Unitary potentials are recorded from ICC-MY after the circular layer has been removed (Hirst & Edwards, 2001) and have similar time courses to those generated by ICC-IM in the circular layer (Edwards et al. 1999). Moreover the plateau component of the pacemaker potential shares the spectral density profile of the regenerative potential recorded from circular muscle (Edwards et al. 1999; Hirst & Edwards, 2001). The time-dependent conductance gPlat(t) represented the sum of unitary conductances originating in the ICC-MY network. The same two-stage messenger production model used to calculate gReg(t) in the circular muscle equivalent cell was used to calculate gPlat(t) in the ICC-MY equivalent cell (eqns (1) and (2)). The plateau component of pacemaker potentials reaches a membrane potential some 15 mV more depolarized than that of the peak of the slow wave in the circular muscle. Therefore, the maximal forward rate of production of intermediate reagent (KF[precursor], see eqn (1) of Edwards & Hirst, 2003) was increased from 0.0196 mm s−1 in the circular muscle cell to 0.168 mm s−1 in the ICC-MY equivalent cell. This could be explained by a higher concentration of messenger precursor substance in the ICC-MY network compared with that in the circular muscle layer, where only about 10% of the cells are ICC. Similarly, the degree of cooperativity between unitary events was made double that chosen for the circular muscle cell. At maximum unit discharge rate, the mean unit amplitude was then 10 times larger than at zero discharge (Fig. 2D). This yielded membrane potential fluctuations during the plateau phase which were of similar size to those detected experimentally. The pacemaker potential simulations were improved when the voltage sensitivity of the first reaction step was increased, while the half-activation and half-inactivation voltages were maintained. Therefore, the exponent factor for m∞ (eqn (2), Fig. 2A) was increased from 0.3 mV−1 in the circular muscle layer to 0.5 mV−1 in the ICC-MY, and for h∞ (eqn (2)) from 0.32 mV−1 in the circular muscle layer to 0.58 mV−1 in the ICC-MY. The peak conductance reached by gPlat(t) during the plateau phase of each pacemaker potential was about 4 μS. EPlat represented the equilibrium potential for the plateau component of the pacemaker potential; this was again set at −20 mV (Fig. 1).
The messenger formation mechanism which was used to describe regenerative potentials in the circular muscle compartment, was modified and used to describe the plateau phase of pacemaker potentials in the ICC-MY compartment, where there was assumed to be a greater density of unitary release apparatus. However, the compartments were assumed to be chemically separate, so no intermediate or messenger substances diffused between the circular muscle and ICC-MY equivalent cells. All coupling between compartments in this model was electrical.
Longitudinal muscle equivalent cell
The ICC-MY equivalent cell was connected to the longitudinal muscle compartment by a resistance with a value of 3.27 MΩ (gIL, 306 nS; Table 1 of Cousins et al. 2003). The longitudinal smooth muscle cell layer is represented by an equivalent cell in the rightmost compartment of Fig. 1. The resting potential for the longitudinal muscle was again set at −65 mV (ERest) (Dickens et al. 1999), and the input resistance of the longitudinal muscle equivalent cell was 9.28 MΩ (gLM, 108 nS; Cousins et al. 2003). The mean membrane time constant of the longitudinal muscle layer was set at the same value as that of the circular muscle layer (162 ms), a value similar to that of the longitudinal muscle layer of the guinea-pig ileum (Cousins et al. 1993). This gave a value of 18 nF for the membrane capacitance (CLM) of the longitudinal muscle equivalent cell.
Calculating the changes in membrane potential in each equivalent cell (Fig. 1; VCM, VMY, VLM) required the simultaneous solution of three equations of the form:
| (4) |
where Σi is the sum of resistive currents at the node in each case, V took the values VCM, VMY and VLM, and Cm took the values CCM, CMY and CLM, respectively. Additional differential equations described activation and inactivation variables for each of three voltage-dependent elements and each stage of two reaction chains. Hence 13 ordinary differential equations were required to be solved simultaneously.
Simulations were carried out using Matlab 6.5.1 Release 13 (The MathWorks, Natick, MA, USA). Stiff differential equation solver ode15s was used. Computations were carried out on an Intel Pentium 4-based desktop computer.
Results
Physiological properties of pacemaker potentials, follower potentials and slow waves recorded from the gastric antrum of guinea-pigs
When intracellular recordings were made from short segments of single bundles of antral circular smooth muscle with the ICC-MY network and longitudinal smooth muscle layer attached, each cell type displayed characteristic sequences of rhythmical membrane potential changes. Longitudinal muscle cells generated follower potentials (Fig. 3A) with a mean peak amplitude of about 28 mV (Dickens et al. 1999; Cousins et al. 2003). ICC-MY generated pacemaker potentials (Fig. 3B) which had a rapidly rising primary component with a peak amplitude of about 45 mV, followed by a plateau component with mean peak amplitude of about 47 mV (Dickens et al. 1999: Cousins et al. 2003). The mean period for which the pacemaker potential magnitude was greater than half its peak amplitude (half width) was about 8.9 s. Circular muscle cells generated slow waves (Fig. 3C) which had initial depolarizing components, with amplitudes of about 18 mV (Cousins et al. 2003); these triggered the regenerative component so giving rise to a complete slow wave with a peak amplitude of about 31 mV (Dickens et al. 1999: Cousins et al. 2003). In a given preparation, these three sets of oscillations shared a common frequency of 2–5 waves min−1 and when recordings were made from pairs of dissimilar cells the oscillations were seen to be time locked. Pacemaker potentials preceded the initial component of the slow wave by a small margin (Dickens et al. 1999; Cousins et al. 2003).
Figure 3. Comparison between physiological recordings of rhythmical potentials from longitudinal, ICC-MY and circular layers with those described by the simulation.

The left hand column of traces, A, B and C, shows follower potentials recorded from a longitudinal muscle cell, pacemaker potentials recorded from ICC-MY and slow waves recorded from the circular layer, respectively. All recordings were made from the same small segment of antral wall; the follower potential was recorded first and subsequently the pacemaker potentials and slow waves were recorded simultaneously using a pair of electrodes. The resting potential of the longitudinal muscle was −60 mV, of the ICC-MY was −63 mV and of the circular layer was −62 mV. The right hand column of traces, D, E and F, shows simulations of follower potentials, pacemaker potentials and slow waves, respectively. For this calculation, the value of gIC was set at 306 nS to simulate an intact antral preparation with all three cell layers connected. The voltage and time calibration bars apply to all traces.
Electrical modelling of pacemaker potentials, follower potentials and slow waves in the gastric antrum of guinea-pigs
After adjusting each of the parameters as described in the Methods section, the simulations generated repeating sequences of pacemaker potentials with time courses similar to those recorded experimentally. Each pacemaker potential consisted of a rapidly rising primary component which was followed by a noisy plateau component (Fig. 3E). Each pacemaker potential generated waves of depolarization in the longitudinal and circular muscle compartments (Fig. 3D and F). Because the longitudinal muscle compartment was modelled as one which lacked voltage-dependent conductances (Fig. 1), follower potentials had very similar waveforms to those of pacemaker potentials but were reduced in amplitude due to the resistive properties of the compartment itself and the access resistance between the longitudinal and ICC-MY compartments. The time courses of simulated follower potentials were slowed slightly due to the membrane capacitance of the longitudinal muscle equivalent cell. Physiological records fail to show an obvious primary component in the longitudinal muscle layer and the onset of follower potentials is additionally slowed, possibly by a contribution from an inactivating outward current (Farrugia, 1999) (Fig. 3A). A noticeable difference between the simulated pacemaker potentials and those recorded experimentally was that plateau phases recorded experimentally frequently sagged. This difference may be due in part to depletion of precursor substance during the plateau phase; the model reaction assumes a constant [precursor]. If the messenger were IP3, then [Ca2+]i inactivation of IP3-induced intracellular Ca2+ release could further contribute to this slow reduction in amplitude (Adkins & Taylor, 1999; Suzuki et al. 2000). Alternatively, this difference may have arisen because no attempt has been made to incorporate conventional time- or voltage-dependent conductances in any of the compartments, other than that required to generate the primary component of the pacemaker potential. In the circular layer, the simulation indicates that the passive wave of pacemaker depolarization is augmented by the secondary regenerative component (Fig. 3F) much as is detected in direct recordings from the antral circular layer (Fig. 3C). However, slow waves in the circular muscle layer often exhibit a modest, high threshold initial component on the rising phase of the regenerative component. This characteristic has not been investigated and has not been included in the model. The amplitudes, half-widths and repetition rate of each simulated waveform were similar to the mean values determined experimentally (Fig. 3).
In the simulations the plateau component of the pacemaker potential and the regenerative component of the slow wave are driven by the concentrations of messenger in the ICC-MY network and in ICC-IM within the circular muscle compartment, respectively. The second messenger is assumed to be formed by a two-stage reaction in which a precursor gives rise to an intermediate product which is in turn converted into the second messenger (see Methods). Therefore, the concentrations of intermediate and messenger substances in each compartment are available as state variables in the model. The mean rates of unitary release in each compartment are consequential upon the [messenger] in that compartment as shown in Fig. 2C. None of these proposed variables was identified or measured in the physiological experiments, and therefore no records were available for comparison. However, they were computed concurrently during each membrane potential simulation and their behaviour offered insight into the operation of the model. Representative time courses of these variables during simulated normal activity of intact antral tissue are shown in Fig. 4. Note that [intermediate] showed an earlier and higher peak than [messenger] in both ICC-MY (Fig. 4B) and the circular muscle compartment (Fig. 4E). The mean rate of unitary release was seen to saturate at 280 Hz (DMAX) in ICC-MY (Fig. 4C) giving rise to the plateau phase of the pacemaker potential (Fig. 4A), whereas in the circular muscle compartment the peak of the mean rate of unitary discharge remained below saturation (Fig. 4F) and so no sustained plateau occurred in the slow wave simulation (Fig. 4D).
Figure 4. Changes in concentrations of intermediate and second messenger substances during simulated pacemaking activity in ICC-MY and regenerative potentials in ICC-IM.

The upper three traces show simulated pacemaker potentials, A, and accompanying profiles for [intermediate] (dashed) and [messenger] (continuous) in the ICC-MY network, B, along with the mean rate of discharge of unitary potentials during the pacemaker potentials, C. The lower three traces show the concurrently calculated slow waves, D, in the circular muscle compartment, along with associated profiles for [intermediate] (dashed) and [messenger] (continuous) in the circular muscle compartment, E, and mean rate of discharge of unitary potentials in the circular muscle compartment, F. The time calibration bar applies to all traces.
Stochastic character of pacemaker potentials
In the gastric antrum the rate of generation of slow waves varies from beat to beat within the range 2–5 waves min−1. This variation results from differences in the duration of, and interval between, successive pacemaker potentials; this phenomenon was detected in both intact preparations and in those from which the circular muscle layer had been removed (Hirst & Edwards, 2001). An experiment is illustrated in Fig. 5 in which successive pacemaker potentials were recorded from a preparation whose circular muscle layer had been dissected away. It can be seen that the interval between pacemaker potentials was not constant and that when the interval between successive pacemaker potentials was long the following pacemaker potential had a longer duration (Fig. 5A). The relationships between half-width (defined as the period that a pacemaker potential was at a level greater than half its peak amplitude) and interval (defined as the period between half-amplitude on the repolarizing phase of one pacemaker potential and half-amplitude on the depolarizing phase of the next pacemaker potential) were determined. When the relationship between the half-width of a pacemaker potential and the interval before the next pacemaker potential was plotted, no clear relationship emerged (Fig. 5B). The regression coefficient for these data was low (R=−0.02). However, when the half-widths of pacemaker potentials were plotted against the interval since each preceding pacemaker potential a linear relationship was apparent (Fig. 5C). In this case, the regression coefficient was high (R= 0.97) and the gradient of the line of best fit was 0.22. This suggests that the duration of a given pacemaker potential was dependent upon the period that the membrane potential had spent at its resting level (see also Hirst & Edwards, 2001). This observation was not used as a design criterion in the formulation of the model and so it was of interest to see whether similar behaviour appeared as a consequence of the theoretical mechanisms selected in the model. A simulation of a sequence of pacemaker potentials (VMY), calculated with the value of connecting conductance between the ICC-MY and the circular compartments, gIC, reduced to zero to mimic the removal of the circular muscle layer, is shown in Fig. 5D. The relationship between the interval between successive pacemaker potentials and the half-width of the preceding pacemaker potential is shown in Fig. 5E; the relationship between the half-width of pacemaker potentials and the interval since the preceding pacemaker potential is shown in Fig. 5F. As with the physiological data, the simulated pacemaker half-widths correlated linearly with the durations of preceding intervals (Fig. 5F, R= 0.79, gradient 0.31), while the reverse was not the case (Fig. 5E, R=−0.09). This characteristic arose in the simulation because, during the interval between pacemaker potentials, the pathway responsible for the formation of second messenger partly recovered from voltage-dependent inactivation. With longer separations, more complete recovery occurred and the rate of formation of intermediate reagent was increased during the subsequent pacemaker potential. This led to increased second messenger formation and the time that the concentration of messenger dwelled above that required to produce the maximal frequency of unitary potentials was prolonged, so giving rise to pacemaker potentials with longer plateau phases (Fig. 5F). The ranges of interval and half-width variability shown in Fig. 5C were greater than those displayed by the simulated pacemaker potentials (Fig. 5F). This was due in part to the representation of the ICC-MY network as a single cell which had a corresponding single mean cycling frequency. In the physiological situation, a number of coupled pacemaker loci exist and cycle within a range of frequencies, leading to a wider dispersion of temporal characteristics than a single pacemaker model can accurately reproduce (Hennig et al. 2004). However, even with this simplified representation the dependence of half-width upon preceding interval is demonstrable in principle. Analogous behaviour in isolated circular muscle bundles has been modelled, where the release of periods of applied hyperpolarizing current lead to regenerative potentials with amplitudes directly dependent on the magnitude and duration of the applied hyperpolarizing current (Edwards & Hirst, 2003).
Figure 5. Stochastic behaviour of pacemaker activity in ICC-MY.

The upper trace, A, shows a series of pacemaker potentials recorded from an ICC-MY attached to the longitudinal muscle layer after removal of the circular muscle layer; resting membrane potential −67 mV. The relationship between half-width of pacemaker potential and subsequent interval before the next pacemaker potential, B, shows no obvious correlation (R=−0.02). However, the relationship between interval and subsequent half-width, C, shows a strong correlation (R= 0.97, line of best fit gradient = 0.22), indicating that the longer the interval before a pacemaker potential, the longer is its duration. The simulated pacemaker potentials, D, generated in an antral preparation model, where gIC was set to zero to simulate removal of the circular muscle layer, shows a similar pattern of behaviour. Again the relationship between half-width of pacemaker potential and subsequent interval showed poor correlation (R=−0.09), E, but the relationship between interval and subsequent half-width, F, showed a clear correlation (R= 0.79, gradient = 0.31).
Termination of pacemaker potentials
Another unusual feature of pacemaker potentials recorded from ICC-MY relates to the form of their termination phases. The repolarizing phases of pacemaker potentials had very similar time courses as they returned to the resting membrane potential (Fig. 6A). It can be seen that regardless of the half-width of a given pacemaker potential, its decay time, the time taken to fall from 70% peak amplitude to 20% peak amplitude, showed little variation and the relationship had a near-zero gradient of −0.003 (R=−0.02; Fig. 6B). Again, this observation was not used as a design criterion in the formulation of the model, so the appropriateness of the model was tested by examining the time courses of decay of successive pacemaker potentials. Figure 6C shows simulations of four pacemaker potentials (VMY) calculated again with gIC set to zero. These were calculated using different values of τh (eqn (2)) at depolarized potentials (Fig. 2A; τh= 1.7 s, 2.1 s, 2.5 s, 3 s) to confer a range of half-widths, and it can be seen that their repolarizing phases showed close similarity. The independence of decay time and half-width of simulated pacemaker potentials is shown in Fig. 6D where the line of best fit had a low gradient (−0.007; R=−0.01). In the model, the rate of repolarization is dependent upon the gradient of the dose–effect relationship linking concentration of messenger substance and rate of discharge of unitary potentials (Fig. 2C and eqn (3) in Edwards & Hirst, 2003). Similarity of successive decay phases, regardless of pacemaker potential half-width, arises because the dose–effect relationship is steep and yields an abrupt cessation of the discharge of unitary potentials independent of the duration of the plateau phase.
Figure 6. Termination phases of pacemaker potentials generated by ICC-MY.

Selected pacemaker potentials, with varying durations, are shown with recovery phases overlaid, A. Note that regardless of their half-widths, the pacemaker potentials terminated with very similar time courses, resting membrane potential −65 mV. When the decay time (70%–20%) was plotted against half-width for a sequence of pacemaker potentials, B, a systematic correlation between the two characteristics (R=−0.02; gradient −0.003) was not detected. When a set of pacemaker potentials was simulated so that their durations varied, C (see text for details), their recovery phases were again similar. The relationship between decay time and half-width, D, showed no systematic correlation (R=−0.01; gradient −0.007). The voltage and time calibration bars apply to panels A and C.
Electrical oscillations in separated layers of the antrum
A number of tests on the simulations were carried out so their results could be compared with experimental observations. A surprising finding in the experimental studies was that pacemaker potentials had similar amplitudes and occurred at similar frequencies when recorded from ICC-MY with both muscle layers attached or from ICC-MY when only the longitudinal layer was present (Dickens et al. 1999; Hirst & Edwards, 2001). Thus the large reduction in the electrical load imposed on the ICC-MY network, which occurred when the circular layer was removed, did not appreciably affect the generation or amplitudes of pacemaker potentials. A second change noted in antral tissue was that, upon isolation, the circular layer generated rhythmical activity at a lower frequency than did the intact preparation (Suzuki & Hirst, 1999; Van Helden et al. 2000). Figure 7A and B shows records of follower potentials and pacemaker potentials recorded simultaneously in a preparation from which the circular muscle layer had been removed (compare with Fig. 3A and B). Two explanations for unaltered pacemaker potential amplitude appear possible. First, removing the circular layer would not much change the amplitude of pacemaker potentials if the circular layer had a very much higher resistance than did the longitudinal layer. Given the relative thickness of the two layers this seems very unlikely. The second explanation is that the membrane resistance of the ICC-MY network falls to a very low value during each pacemaker potential. In this case the peak amplitude of each component of the pacemaker potential would approach the reversal potential for the ionic conductance underlying each component, little affected by the presence or absence of the circular muscle layer. In the model gPrim(t) had a peak conductance of 35 μS (GPrim), and the maximal value of gPlat(t), determined by the amplitudes and frequency of unitary events, was about 4 μS under control conditions. Experimentally both the primary and secondary components have amplitudes near 45 mV and are superimposed on a resting membrane potential of about −65 mV in each case. Therefore both EPrim and EPlat were initially given values of −20 mV. When this was done the simulated pacemaker potentials (Fig. 7E) and follower potentials (Fig. 7D) had similar forms to both those recorded experimentally (Fig. 7A and B) from preparations devoid of circular layer and those detected in preparations containing both muscle layers (Fig. 3). The simulations shown in Fig. 7 were carried out after the value of connecting conductance gIC (Fig. 1) had been reduced from 306 nS to zero, to model isolation from the circular muscle layer.
After a circular muscle layer has been separated from its accompanying ICC-MY network and longitudinal muscle layer, it spontaneously generates regenerative potentials. They occur at frequencies varying between ∼0.1 and 3 min−1 (Suzuki & Hirst, 1999; Van Helden et al. 2000), beginning with an accelerating pacemaker depolarization and decaying more rapidly to baseline. They are followed by a period of depressed membrane noise. An example of this activity is shown in Fig. 7C. When the changes in membrane potential generated by the circular layer were examined in the simulation, using the parameters previously used to simulate the secondary component of the slow wave, a pattern of spontaneous regenerative potentials similar to that detected experimentally was generated (Fig. 7F; see Edwards & Hirst, 2003). This simulation was carried out concurrently with those shown in Fig. 7D and E, after gIC (Fig. 1) had been reduced to zero to model isolation of the circular layer from the longitudinal muscle layer and associated ICC-MY network.
As the primary component displays many of the properties associated with T-type Ca2+ channels, during the development of the simulations attempts were made to model the primary component as being generated by a set of Ca2+-selective channels. When the equilibrium potential of the first component was changed from −20 to +100 mV, to mimic a Ca2+ current (Fig. 8A and B) and the peak conductance modulation of GPrim was reduced from 35 to 1.37 μS (eqn (3)), the primary component had an amplitude similar to that recorded experimentally from preparations with both muscle layers attached (Fig. 8A). However, when the simulation was repeated with gIC reduced to zero, to mimic removal of the circular layer, the primary component of the simulated pacemaker potentials, unlike the physiological observations, increased in amplitude to have a peak value some 15 mV positive of the unchanged plateau component (Fig. 8B). Given the suggestion that sets of cation selective channels are involved in the generation of pacemaker potentials by intestinal ICC (Koh et al. 2002; Goto et al. 2004), the next equilibrium potential chosen for the primary component ionic conductance was 0 mV. Again the simulations failed to describe experimental observations (Fig. 8C and D). Whilst normal pacemaker potentials could be demonstrated with both layers attached, with GPrim reduced from 35 to 6.8 μS (Fig. 8C), the simulated removal of the circular layer revealed a pacemaker potential with a primary component whose amplitude was increased by 6 mV (Fig. 8D). Similar observations were made when the equilibrium potential of the plateau component was varied: when the equilibrium potential was made more positive, simulated removal of the circular layer increased the amplitude of the plateau component. Thus a value of −20 mV provided the best estimate for both EPrim and EPlat (Fig. 1). Such an equilibrium potential would arise if there were a simple increase in conductance to one ionic species, or appropriate increases in conductance to several different ions, giving rise to a summed reversal potential of −20 mV.
Figure 8. Effect of separating the connection between the circular layer and ICC-MY where the equilibrium potential of the initial component of the pacemaker potential was varied.

A shows pacemaker potentials simulated in a preparation with the circular muscle layer attached with EPrim changed from −20 to +100 mV, and GPrim reduced from 35 to 1.37 μS to compensate the increased driving potential. When gIC was reduced from 306 nS to zero, to simulate removal of the circular muscle layer, repeating the calculation showed that the initial component was increased in amplitude, B. C shows pacemaker potentials simulated in a preparation with the circular muscle layer attached with EPrim changed from −20 to 0 mV, and GPrim set to 6.8 μS to compensate for the altered driving potential. Again reducing gIC to zero caused an increase in the amplitude of the initial component, D. The voltage and time calibration bars apply to all traces.
Components of pacemaker potentials
The two components of pacemaker potentials can be distinguished pharmacologically. The plateau component is abolished by caffeine (3 mm), which initially shortens the duration of the plateau component and ultimately abolishes it to leave only the primary component (Dickens et al. 1999; Hirst & Edwards, 2001). A set of pacemaker potentials, recorded from an ICC-MY in a preparation with the circular muscle layer removed, selected from an experimental series where caffeine, 3 mm, was applied is shown in Fig. 9. The plateau of the control pacemaker (Fig. 9A) was first reduced in duration (Fig. 9B) and then abolished (Fig. 9C). Two theoretical procedures were investigated in the attempt to simulate this sequence of events. Firstly the concentration of messenger was assumed to be unaltered, but the maximum rate of discharge of unitary potentials, DMAX, was reduced (see Fig. 2C). However, although low values of DMAX mimicked the physiological observations and abolished the plateau component of the pacemaker potential, intermediate values of DMAX, which would correspond to the onset of caffeine action (Fig. 9B) reduced both the amplitude and duration of the plateau component. This approach was rejected as it did not describe adequately the experimental observations. The alternative approach allowed the relationship between the rate of discharge of unitary potentials and concentration of messenger to remain unchanged but assumed that the production of messenger was decreased by caffeine application (Toescu et al. 1992; Prestwich & Bolton, 1995). This was implemented as a reduction in the value of the maximal forward rate of production of intermediate reagent, KF[precursor], although other rate constants in the reaction chain could have been chosen with similar mathematical effect. In simulating the control pacemaker potential (Fig. 9D), the maximal forward rate of production of intermediate reagent, KF[precursor], was 0.168 mm s−1. When KF[precursor] was reduced to 0.079 mm s−1, the plateau component was reduced in duration, without marked reduction in its amplitude, and a more marked period of repolarization between the primary and plateau components was detected (Fig. 9E). When KF[precursor] was reduced to 0 mm s−1, only the primary component remained (Fig. 9F); this recurred spontaneously at a lower frequency than that of complete pacemaker potentials (Hirst & Edwards, 2001).
The amplitude and rate of rise of the primary component of the pacemaker potential are sensitive to changes in [Ca2+]o (Hirst & Edwards, 2001). A set of experimental observations is shown in Fig. 10. Successive pacemaker potentials were recorded from ICC-MY in control solution taken from a preparation from which the circular muscle layer had been removed (Fig. 10A). When [Ca2+]o was halved from 2.5 mm to 1.25 mm, the rate of rise and the amplitude of the primary component were reduced (Fig. 10B). A further halving of [Ca2+]o to 0.625 mm abolished the primary component (Fig. 10C). Rhythmic activity persisted at a reduced rate and with pacemaker potentials having reduced half-widths. To model this behaviour, simultaneous reductions in GPrim (eqn (3)) and the maximal forward rate of production of intermediate reagent, KF[precursor] (eqn (1)), were required. If GPrim was reduced in isolation, simulated pacemaker potentials (VMY) were seen to have increased half-widths, unlike the physiologically acquired records. To simulate the reduction in half-width of the plateau component that accompanies reduction in amplitude of the primary component, a dependence of gPlat(t) on [Ca2+]o was assumed. This proposition is supported by the observation that perfusion of this tissue with Ca2+-free solution abolishes all rhythmic activity (Hirst & Edwards, 2001), possibly because low [Ca2+]o ultimately leads to a depletion of intracellularly stored Ca2+ and consequently reduced discharge of unitary potentials (Hirst et al. 2002b; Koh et al. 2002). The sensitivity of gPlat(t) to reduced [Ca2+]o was modelled as a reduction in the maximal forward rate of production of intermediate reagent, KF[precursor], which consequently diminished the production of messenger. Figure 10D shows a simulation of pacemaker potentials (VMY) in a preparation with the circular muscle layer removed (control: GPrim= 33 μS, KF[precursor]= 0.168 mm s−1). Figure 10E shows pacemaker potentials calculated with reduced primary component and reduced messenger formation (GPrim= 15 μS, KF[precursor]= 0.11 mm s−1). The amplitude of the primary component was smaller and the frequency slower, as for the physiologically acquired data. Figure 10F shows pacemaker potentials computed with no primary component and further reduced messenger formation (GPrim= 0 μS, KF[precursor]= 0.071 mm s−1). Note that the rates of rise of the simulated pacemaker potentials and their half-widths are reduced, concurrently with the abolition of the primary component.
Figure 10. Effect of reducing [Ca2+]o on pacemaker potentials generated by ICC-MY.

The left hand column of traces shows sequences of pacemaker potentials recorded in control solution with [Ca2+]o set to 2.5 mm, A, when [Ca2+]o was reduced to 1.25 mm, B, and further reduced to 0.625 mm, C. Note that the amplitude of the primary component, A, was reduced, B, and then abolished, C; at the same time the frequency of pacemaker potentials fell. The membrane potential remained at −63 mV throughout. The right hand column of traces first shows a sequence of simulated pacemaker potentials, D. The simulation was repeated, E, with GPrim reduced from the control value of 33 μS to 15 μS and the maximal forward rate of production of intermediate reagent, KF[precursor], reduced from the control level of 0.168 mm s−1 to 0.11 mm s−1. The simulation was repeated again, F, with GPrim reduced to 0 μS and KF[precursor] reduced to 0.071 mm s−1. The voltage and time calibration bars apply to all traces.
Predictions from the simulations
It will be apparent that this electrical description of the generation of slow waves by the antrum involves three separate voltage-dependent elements. One element is responsible for the generation of the first component of the pacemaker potential; the other two voltage-dependent elements are ultimately responsible for the accelerated rate of discharge of unitary potentials that occurs during the plateau component of the pacemaker potential in ICC-MY and during the regenerative component of the slow wave, which is generated by ICC-IM. However, it has been shown that when the membrane potential of the circular muscle layer of the guinea-pig antrum is voltage clamped, rhythmical inward currents, with the same time course and periodicity as slow waves, are detected (Ohba et al. 1975). The behaviour of the electrical model under voltage clamp was examined and it was found that significant differences occurred depending on which compartment of the equivalent circuit was clamped at rest potential (Fig. 11). When the ICC-MY compartment was subjected to a 70-s period of voltage clamp at −65 mV, the rhythmical discharge of pacemaker potentials (Fig. 11A) and slow waves stopped (Fig. 11B). An increase in discharge of membrane noise was detected in the circular layer as ICC-IM recovered from inactivation (Fig. 11B). Similarly, the clamp current required to hold the ICC-MY network at −65 mV increased to a steady but noisy value as the voltage-sensitive step of the messenger formation reaction recovered from inactivation and gPlat(t) increased. However, cyclic rhythmical waves of clamp current were not detected (Fig. 11C).
Figure 11. Effect of voltage clamping either the pacemaker compartment or the circular muscle compartment at resting potential.

The left hand column of simulations shows the effect of voltage clamping the ICC-MY compartment at −65 mV. The upper pair of traces shows simulations of pacemaker potentials, A, and slow waves, B, calculated with gIC set to 306 nS to mimic an antral preparation with circular muscle layer attached. A period of membrane potential clamp at −65 mV was applied to the ICC-MY compartment (bar) and the membrane current in this compartment was calculated (C). Note that an increase in clamp current was detected but that this was not oscillatory. The right hand column of traces shows simulations of pacemaker potentials, D, and slow waves, E, and their behaviour when the membrane potential of the circular layer was clamped at −65 mV. Pacemaker potentials were little affected. Oscillatory membrane currents in the circular muscle compartment driven by pacemaker potentials were evident, F, despite arrest of the slow waves. The voltage calibration bar applies to panels A, B, D and E; the time calibration bar applies to all traces.
When the circular muscle compartment was clamped at rest potential, pacemaker potentials in the ICC-MY compartment continued with only a small reduction in amplitude (Fig. 11D). Although slow waves were abolished during the period of membrane potential clamp (Fig. 11E), a rhythmical clamp current due to the continuing occurrence of pacemaker potentials was evident in the circular muscle compartment (Fig. 11F). Qualitatively the same observations were made when the longitudinal layer was voltage clamped at its resting value, pacemaker potentials and slow waves persisted and a small rhythmical clamp current was evident in the longitudinal muscle compartment (data not shown).
Cholinergic nerve stimulation evokes premature slow waves in the antrum (Vogalis & Sanders, 1990; Hirst et al. 2002c). This occurs because cholinergic nerves preferentially innervate ICC-IM and trigger premature regenerative responses in the circular muscle layer which initiate pacemaker potentials in ICC-MY (Ward et al. 2000; Hirst et al. 2002c; Beckett et al. 2003). To explore whether the electrical model of slow waves presented in this report had appropriate properties to generate this type of behaviour, the effect of selectively exciting the circular compartment was explored. This was done by imposing an additional source of the messenger which controls the frequency of discharge of unitary potentials in the circular layer. A sequence of simulated pacemaker potentials and accompanying slow waves is shown in Fig. 12A. In the expanded sections of traces, it can be seen that normally the upstroke of the pacemaker potential slightly precedes the start of the slow wave (Fig. 12B). During the interval following the second slow wave, a source of messenger was introduced into the circular muscle compartment which provided messenger at the rate of 600 nm s−1 for a period of 1 s (▪, Fig. 12A). This rapidly triggered a premature slow wave (Fig. 12A); note the shortened second interval. Furthermore, the expanded view of the rising phase of the premature slow wave and pacemaker potential shows that the start of the slow wave preceded the start of the pacemaker potential (Fig. 12C). This observation closely resembles the events recorded from the same cell layers in the intact antrum (Hirst et al. 2002c).
Figure 12. Effect of transiently increasing the concentration of messenger substance in the circular muscle compartment.

The upper pair of superimposed traces, A, shows a simulation of spontaneous pacemaker potentials (continuous) and concurrent slow waves (dashed) in an intact antral preparation. The square (▪) under the baseline following the second slow wave indicates an injection of messenger (600 nm s−1 for 1 s) into the circular muscle layer. This yielded a premature slow wave and subsequent pacemaker potential. The expanded rising phases of the control (a) pacemaker potential and slow wave, showing that the pacemaker potential led the slow wave, are shown in B. The expanded rising phases of the premature (b) pacemaker potential and slow wave, C, show that the dominant pacemaker shifted to the circular layer. The voltage calibration bar applies to all traces; the time calibration bar in panel C applies also to panel B.
Discussion
The patterns of rhythmical electrical activity generated by ICC-MY and the longitudinal and circular muscle layers of the guinea-pig antrum have been described by a simple electrical model in which each muscle layer is resistively coupled to the ICC-MY compartment. Both the ICC-MY and circular layers are assumed to contain a biochemical pathway which is activated by depolarization, so accelerating the rate of discharge of unitary potentials. Thus pacemaker potentials generated by ICC-MY and slow waves generated in the circular layer by ICC-IM include significant components which result from the summation of many unitary potentials.
The description of the resistive elements in the network is based on measurements of the passive properties of the syncytial layers of the antral wall (Cousins et al. 2003). These experiments indicated that, provided the preparations were small, each of the three layers could be represented as separate single equivalent cells, with the central cell, ICC-MY, being connected to the adjacent cells via non-rectifying resistive pathways (Cousins et al. 2003). Clearly this is a simplification; the circular layer contains ICC-IM as well as smooth muscle cells. However, provided individual ICC-IM are tightly coupled to neighbouring smooth muscle cells, and histological studies suggest that this is the case (Cousins et al. 2003), a short section of the circular layer can be modelled as a single cell with properties that reflect the parallel combination of the two cell types (Edwards & Hirst, 2003). The representation of smooth muscle cells in both layers as cells which lack voltage-dependent channels is again an oversimplification. In the circular layer the errors introduced by this simplification may be small; smooth muscle cells in the circular layer contain L-type calcium channels but when these channels are blocked the amplitudes and time courses of slow waves are little changed (Suzuki & Hirst, 1999). Presumably the conductance change that L-type calcium channels contribute during a slow wave is much less than that contributed by ICC-IM. In the longitudinal muscle layer, where there are few ICC-IM (Cousins et al. 2003), the same considerations do not apply. Normally each wave of depolarization generates a discharge of action potentials that result from the activation of L-type calcium channels (Dickens et al. 2000). Additionally most gastrointestinal smooth muscle cells contain sets of voltage-dependent potassium selective channels (Farrugia, 1999). Whilst it would be straightforward to include a range of smooth muscle voltage-dependent channels in the description of slow wave activity in the antrum, we think that this would be premature; the behaviour of these channels during the long periods of depolarization associated with each slow wave has not been described.
To describe pacemaker potentials, two distinct mechanisms were required. During normal activity, a rapidly rising primary phase is followed by a prolonged plateau phase (Dickens et al. 1999). After appropriate pharmacological intervention either component can be generated alone albeit at a lower frequency than when the two events occur cooperatively (Hirst & Edwards, 2001; Kito & Suzuki, 2003). Surprisingly an adequate description of the primary component required that it had a reversal potential of −20 mV (Figs 3 and 8). Since the equilibrium potential for chloride ions in smooth muscle cells is about −20 mV (Aickin & Brading, 1982), this might indicate that the channels activated are selective for chloride ions. This seems unlikely. The primary component of the pacemaker potential, unlike the plateau component, is unaffected by chloride channel antagonists or by depleting the internal concentration of chloride ions (Kito et al. 2002). A more likely explanation is that two sets of channels are activated simultaneously, giving a combined reversal potential of −20 mV. Alternatively, a novel channel which is permeable to two or more types of ions might carry this current and account for the observed reversal potential. The simulations also dictated that the equilibrium potential for the conductance change underlying the plateau component was again −20 mV (Fig. 1). This idea can be justified from observations made on ICC-MY in situ (Kito et al. 2002). The case for setting the equilibrium potential of unitary potentials, generated in the circular layer by ICC-IM, at −20 mV has previously been presented (Edwards & Hirst, 2003) and is similarly supported by experimental observations (Hirst et al. 2002b).
In the simulations and in ICC-MY, in situ, the primary component is normally activated by randomly occurring unitary potentials whose frequency gradually increases as they recover from the period of inactivation following the previous plateau component (Hirst & Edwards, 2001). This gives rise to variations in the intervals between successive pacemaker potentials (Fig. 5; see Hirst & Edwards, 2001). The plateau component of the pacemaker potential and the regenerative component of the slow wave result from increased rates of discharge of unitary potentials by ICC-MY and ICC-IM, respectively. Experimentally ICC-MY and ICC-IM have each been found to spontaneously discharge unitary potentials with characteristic time courses (Edwards et al. 1999; Hirst & Edwards, 2001). Power spectral density profiles of the pacemaker plateau and of the regenerative component suggest that both result from the high frequency discharge of unitary potentials (Edwards et al. 1999; Hirst & Edwards, 2001). After inhibiting the discharge of unitary potentials and the plateau component of the pacemaker potential, the primary component occurs at low frequencies (Hirst & Edwards, 2001; Kito et al. 2002); the simulations suggest that under these circumstances the interval between primary components is largely determined by the time course of recovery from inactivation of the channels responsible for the primary component (Figs 2 and 9).
The time courses and behaviour of regenerative potentials were described by assuming that they were initiated by a two-stage chemical reaction which resulted in the formation of an intracellular messenger, with the concentration of second messenger influencing the mean rate of occurrence of unitary potentials (Edwards & Hirst, 2003). This simple approach mathematically describes a series of reactions which include the formation and diffusion of a second messenger, presumably IP3, release of Ca2+ from intracellular stores, interaction between changes in [Ca2+]i and second messenger and the direct or indirect activation of membrane channels (Koh et al. 2002). Surprisingly this approach provided explanations for the dependence of the duration of pacemaker potentials on the time elapsed since the previous pacemaker potential and for their fixed termination phases regardless of their durations. A long interval allowed increased messenger production and prolonged duration; the time course of termination reflected the steep dependency of the rate of discharge of unitary potentials upon the concentration of messenger substance.
Many studies on slow waves have concluded that rhythmical activity is largely independent of membrane potential (Ohba et al. 1975; Koh et al. 1998). Previously, it was either not fully appreciated that pacemaker activity might be generated in a compartment different from where the slow waves were recorded (Ward et al. 1994) or that the electrical connections between pacemaker cells and smooth muscle cells might be relatively weak (Cousins et al. 2003). When the effects of these two factors were examined by simulated voltage clamping of the different compartments at their resting potential, voltage clamping the ICC-MY compartment abruptly terminated pacemaker activity and the discharge of slow waves; only a non-oscillatory increase in holding current was detected as the messenger pathway recovered from inactivation (Fig. 11A, B and C). This arose because the membrane potential could not swing through the activation potentials of either the primary or the plateau components. Recently it has been shown experimentally that when single intestinal ICC-MY are voltage clamped, pacemaker activity ceases (Goto et al. 2004). When a voltage clamp was applied to the circular muscle compartment, slow waves were abolished but pacemaker activity persisted and an oscillatory clamp current was required to nullify the passive flow of pacemaker current into the circular compartment (Fig. 11D, E and F). This arose because of the poor electrical access to the ICC-MY compartment presented by the coupling resistance between it and the circular layer (Fig. 1; Cousins et al. 2003). When this resistance was reduced in the model, the clamp became effective but distinct pacemaker potentials were not detected in the ICC-MY layer (data not shown). It is of interest to note that when Tomita and colleagues voltage clamped the circular layer of an intact segment of antrum, they pointed out that if pacemaker activity was not generated in the circular layer their conclusion, that slow waves showed little voltage dependency, might be compromised (Ohba et al. 1975).
In summary, using a three-compartment equivalent circuit model we were able to simulate many of the characteristic patterns of electrical activity recorded from the different cell layers making up the gastric antrum. The results of the simulations are entirely consistent with the idea that pacemaker activity, initiated in a central ICC-MY compartment, triggers rhythmical waves of depolarization in the adjacent muscle layers. Pacemaker activity involves two separate mechanisms: one resembling that seen in cardiac pacemaker cells involving a voltage-dependent membrane conductance, and the other that involves a second messenger pathway linked to the release of Ca2+ from internal stores. The different waveforms detected in the two muscle layers can be accounted for if a similar second messenger pathway is included in the circular compartment. Presumably this reflects the presence of ICC-IM which are dispersed among the circular smooth muscle cells; these respond to depolarization to produce the secondary regenerative component of the slow wave.
Acknowledgments
We are grateful to Professor Trevor Lamb for discussion and critical reading of the manuscript. This work was funded by the National Health and Medical Research Council of Australia. We thank them for their financial support.
References
- Adkins CE, Taylor CW. Lateral inhibition of inositol 1,4,5-trisphosphate receptors by cytosolic Ca2+ Curr Biol. 1999;9:1115–1118. doi: 10.1016/s0960-9822(99)80481-3. [DOI] [PubMed] [Google Scholar]
- Aickin CC, Brading AF. Measurement of intracellular chloride in guinea-pig vas deferens by ion analysis, 36chloride efflux and micro-electrodes. J Physiol. 1982;326:139–154. doi: 10.1113/jphysiol.1982.sp014182. [DOI] [PMC free article] [PubMed] [Google Scholar]
- Beckett EAH, Bayguinov YR, Sanders KM, Ward S, Hirst GDS. Properties of unitary potentials generated by intramuscular interstitial cells of Cajal in the murine and guinea-pig gastric fundus. J Physiol. 2004;559:259–269. doi: 10.1113/jphysiol.2004.063016. [DOI] [PMC free article] [PubMed] [Google Scholar]
- Beckett EAH, McGeough CA, Sanders KM, Ward SM. Pacing of interstitial cells of Cajal in the murine gastric antrum: neurally mediated and direct stimulation. J Physiol. 2003;553:545–559. doi: 10.1113/jphysiol.2003.050419. [DOI] [PMC free article] [PubMed] [Google Scholar]
- Bootman MD, Berridge MJ, Lipp P. Cooking with calcium: the recipes for composing global signals from elementary events. Cell. 1997;91:367–373. doi: 10.1016/s0092-8674(00)80420-1. [DOI] [PubMed] [Google Scholar]
- Burns AJ, Herbert TM, Ward SM, Sanders KM. Interstitial cells of Cajal in the guinea-pig gastrointestinal tract as revealed by c-Kit. Cell Tissue Res. 1997;290:11–20. doi: 10.1007/s004410050902. [DOI] [PubMed] [Google Scholar]
- Cousins HM, Edwards FR, Hickey H, Hill CE, Hirst GDS. Electrical coupling between the myenteric interstitial cells of Cajal and adjacent muscle layers in the guinea-pig gastric antrum. J Physiol. 2003;550:829–844. doi: 10.1113/jphysiol.2003.042176. [DOI] [PMC free article] [PubMed] [Google Scholar]
- Cousins HM, Edwards FR, Hirst GD, Wendt IR. Cholinergic neuromuscular transmission in the longitudinal muscle of the guinea-pig ileum. J Physiol. 1993;471:61–86. doi: 10.1113/jphysiol.1993.sp019891. [DOI] [PMC free article] [PubMed] [Google Scholar]
- Dickens EJ, Edwards FR, Hirst GDS. Vagal inhibitory projections to rhythmically active cells in the antral region of guinea-pig stomach. Am J Physiol. 2000;279:G388–399. doi: 10.1152/ajpgi.2000.279.2.G388. [DOI] [PubMed] [Google Scholar]
- Dickens EJ, Edwards FR, Hirst GDS. Selective knockout of intramuscular interstitial cells reveals their role in the generation of slow waves in mouse stomach. J Physiol. 2001;531:827–833. doi: 10.1111/j.1469-7793.2001.0827h.x. [DOI] [PMC free article] [PubMed] [Google Scholar]
- Dickens EJ, Hirst GDS, Tomita T. Identification of rhythmically active cells in guinea-pig stomach. J Physiol. 1999;514:515–531. doi: 10.1111/j.1469-7793.1999.515ae.x. [DOI] [PMC free article] [PubMed] [Google Scholar]
- Edwards FR, Hirst GDS. Mathematical description of regenerative potentials recorded from circular smooth muscle of guinea pig antrum. Am J Physiol. 2003;285:G661–670. doi: 10.1152/ajpgi.00145.2003. [DOI] [PubMed] [Google Scholar]
- Edwards FR, Hirst GDS, Suzuki H. Unitary nature of regenerative potentials recorded from circular smooth muscle of guinea-pig antrum. J Physiol. 1999;519:235–250. doi: 10.1111/j.1469-7793.1999.0235o.x. [DOI] [PMC free article] [PubMed] [Google Scholar]
- Farrugia G. Ionic conductances in gastrointestinal smooth muscles and interstitial cells of Cajal. Ann Rev Physiol. 1999;61:45–84. doi: 10.1146/annurev.physiol.61.1.45. [DOI] [PubMed] [Google Scholar]
- Goto K, Matsuoka S, Noma A. Two types of spontaneous depolarizations in the interstitial cells freshly prepared from the murine small intestine. J Physiol. 2004;559:411–422. doi: 10.1113/jphysiol.2004.063875. [DOI] [PMC free article] [PubMed] [Google Scholar]
- Hennig GW, Hirst GDS, Park KJ, Smith CB, Sanders KM, Ward SM, Smith TK. Propagation of pacemaker activity in the guinea-pig antrum. J Physiol. 2004;556:585–599. doi: 10.1113/jphysiol.2003.059055. [DOI] [PMC free article] [PubMed] [Google Scholar]
- Hirst GDS, Beckett EAH, Sanders KM, Ward SM. Regional variation in contribution of myenteric and intramuscular interstitial cells of Cajal to generation of slow waves in mouse gastric antrum. J Physiol. 2002a;540:1003–1012. doi: 10.1113/jphysiol.2001.013672. [DOI] [PMC free article] [PubMed] [Google Scholar]
- Hirst GDS, Bramich NJ, Teramoto N, Suzuki H, Edwards FR. Regenerative component of slow waves in the guinea-pig gastric antrum involves a delayed increase in [Ca2+]i and Cl− channels. J Physiol. 2002b;540:907–919. doi: 10.1113/jphysiol.2001.014803. [DOI] [PMC free article] [PubMed] [Google Scholar]
- Hirst GDS, Dickens EJ, Edwards FR. Pacemaker shift in the gastric antrum of guinea-pigs produced by excitatory vagal stimulation involves intramuscular interstitial cells. J Physiol. 2002c;541:917–928. doi: 10.1113/jphysiol.2002.018614. [DOI] [PMC free article] [PubMed] [Google Scholar]
- Hirst GDS, Edwards FR. Generation of slow waves in the antral region of guinea-pig stomach – a stochastic process. J Physiol. 2001;535:165–180. doi: 10.1111/j.1469-7793.2001.00165.x. [DOI] [PMC free article] [PubMed] [Google Scholar]
- Hodgkin AL, Huxley AF. A quantitative description of membrane current and its application to conduction and excitation in nerve. J Physiol. 1952;117:500–544. doi: 10.1113/jphysiol.1952.sp004764. [DOI] [PMC free article] [PubMed] [Google Scholar]
- Kito Y, Fukuta H, Suzuki H. Components of pacemaker potentials recorded from the guinea pig stomach antrum. Pflugers Arch. 2002;445:202–217. doi: 10.1007/s00424-002-0884-z. [DOI] [PubMed] [Google Scholar]
- Kito Y, Suzuki H. Properties of pacemaker potentials recorded from myenteric interstitial cells of Cajal distributed in the mouse small intestine. J Physiol. 2003;553:803–818. doi: 10.1113/jphysiol.2003.051334. [DOI] [PMC free article] [PubMed] [Google Scholar]
- Koh SD, Jun JY, Kim TW, Sanders KM. A Ca2+-inhibited non-selective cation conductance contributes to pacemaker currents in mouse interstitial cell of Cajal. J Physiol. 2002;540:803–814. doi: 10.1113/jphysiol.2001.014639. [DOI] [PMC free article] [PubMed] [Google Scholar]
- Koh SD, Sanders KM, Ward SM. Spontaneous electrical rhythmicity in cultured interstitial cells of Cajal from the murine small intestine. J Physiol. 1998;513:203–213. doi: 10.1111/j.1469-7793.1998.203by.x. [DOI] [PMC free article] [PubMed] [Google Scholar]
- Lee HK, Sanders KM. Comparison of ionic currents from interstitial cells and smooth muscle cells of canine colon. J Physiol. 1993;460:135–152. doi: 10.1113/jphysiol.1993.sp019463. [DOI] [PMC free article] [PubMed] [Google Scholar]
- Ohba M, Sakamoto Y, Tomita T. The slow wave in the circular muscle of the guinea-pig stomach. J Physiol. 1975;253:505–516. doi: 10.1113/jphysiol.1975.sp011203. [DOI] [PMC free article] [PubMed] [Google Scholar]
- Prestwich SA, Bolton TB. Inhibition of muscarinic receptor-induced inositol phospholipid hydrolysis by caffeine, β-adrenoceptors and protein kinase C in intestinal smooth muscle. Br J Pharmacol. 1995;114:602–611. doi: 10.1111/j.1476-5381.1995.tb17182.x. [DOI] [PMC free article] [PubMed] [Google Scholar]
- Sanders KM. A case for interstitial cells of Cajal as pacemakers and mediators of neurotransmission in the gastrointestinal tract. Gastroenterology. 1996;111:492–515. doi: 10.1053/gast.1996.v111.pm8690216. [DOI] [PubMed] [Google Scholar]
- Sergeant GP, Hollywood MA, McHale NG, Thornbury KD. Spontaneous Ca2+ activated Cl− currents in isolated urethral smooth muscle cells. J Urol. 2001;166:1161–1166. [PubMed] [Google Scholar]
- Suzuki H, Hirst GDS. Regenerative potentials evoked in circular smooth muscle of the antral region of guinea-pig stomach. J Physiol. 1999;517:563–573. doi: 10.1111/j.1469-7793.1999.0563t.x. [DOI] [PMC free article] [PubMed] [Google Scholar]
- Suzuki H, Takano H, Yamamoto Y, Komuro T, Saito M, Kato K, Mikoshiba K. Properties of gastric smooth muscles obtained from mice which lack inositol trisphosphate receptor. J Physiol. 2000;525:105–111. doi: 10.1111/j.1469-7793.2000.00105.x. [DOI] [PMC free article] [PubMed] [Google Scholar]
- Toescu EC, O'Neill SC, Petersen OH, Eisner DA. Caffeine inhibits the agonist-evoked cytosolic Ca2+ signal in mouse pancreatic acinar cells by blocking inositol trisphosphate production. J Biol Chem. 1992;267:23467–23470. [PubMed] [Google Scholar]
- Tomita T. Electrical activity (spikes and slow waves) in gastrointestinal smooth muscles. In: Bulbring E, Brading AF, Jones AW, Tomita T, editors. Smooth Muscle: an Assessment of Current Knowledge. London: Edward Arnold; 1981. pp. 127–156. [Google Scholar]
- Van Helden DF, Imtiaz MS, Nurgaliyeva K, von der Weid P, Dosen PJ. Role of calcium stores and membrane voltage in the generation of slow wave action potentials in guinea-pig gastric pylorus. J Physiol. 2000;524:245–265. doi: 10.1111/j.1469-7793.2000.00245.x. [DOI] [PMC free article] [PubMed] [Google Scholar]
- Vogalis F, Sanders KM. Cholinergic stimulation activates a non-selective cation current in canine pyloric circular muscle cells. J Physiol. 1990;429:223–236. doi: 10.1113/jphysiol.1990.sp018253. [DOI] [PMC free article] [PubMed] [Google Scholar]
- Ward SM, Beckett EA, Wang X, Baker F, Khoyi M, Sanders KM. Interstitial cells of Cajal mediate cholinergic neurotransmission from enteric motor neurons. J Neurosci. 2000;20:1393–1403. doi: 10.1523/JNEUROSCI.20-04-01393.2000. [DOI] [PMC free article] [PubMed] [Google Scholar]
- Ward SM, Burns AJ, Torihashi S, Sanders KM. Mutation of the proto-oncogene c-kit blocks development of interstitial cells and electrical rhythmicity in murine intestine. J Physiol. 1994;480:91–97. doi: 10.1113/jphysiol.1994.sp020343. [DOI] [PMC free article] [PubMed] [Google Scholar]