

Abstract
Neurones are noisy elements. Noise arises from both intrinsic and extrinsic sources, and manifests itself as fluctuations in the membrane potential. These fluctuations limit the accuracy of a neurone's output but have also been suggested to play a computational role. We present a detailed study of the amplitude and spectrum of voltage noise recorded at the soma of layer IV–V pyramidal neurones in slices taken from rat neocortex. The dependence of the noise on holding potential, synaptic activity and Na+ conductance is systematically analysed. We demonstrate that voltage noise increases non-linearly as the cell depolarizes (from a standard deviation (s.d.) of 0.19 mV at −75 mV to an s.d. of 0.54 mV at −55 mV). The increase in voltage noise is accompanied by an increase in the cell impedance, due to voltage dependence of Na+ conductance. The impedance increase accounts for the majority (70%) of the voltage noise increase. The increase in voltage noise and impedance is restricted to the low-frequency range (0.2–2 Hz). At the high frequency range (5–100 Hz) the voltage noise is dominated by synaptic activity. In our slice preparation, synaptic noise has little effect on the cell impedance. A minimal model reproduces qualitatively these data. Our results imply that ion channel noise contributes significantly to membrane voltage fluctuations at the subthreshold voltage range, and that Na+ conductance plays a key role in determining the amplitude of this noise by acting as a voltage-dependent amplifier of low-frequency transients.
Neurones, as the units of computation in the brain, integrate their many inputs in a complicated fashion, and communicate with other cells by sending discrete pulses – action potentials – through their axons. In essence, neurones perform a transformation from inputs, which manifest themselves as subthreshold synaptic potentials, to an output that consists of all-or-none discrete events. However, the neurone is prone to many sources of noise, leading to irregular fluctuations of the membrane potential. These may hinder the ability of a neurone to generate a reproducible response to incoming stimuli, and may therefore limit its computational power. The irreproducibility of spike trains across repetitions of a stimulus has been quantified in many different ways (Mainen & Sejnowski, 1995; Victor & Purpura, 1996; de Ruyter van Steveninck et al. 1997; Nowak et al. 1997). At least two studies have shown how subthreshold noise limits the information capacity of output spike trains (ionic channel noise: Schneidman et al. 1998; synaptic noise: London et al. 2002). There has also been growing interest in the role that noise may play in enhancing the computational capability of neurones. For example, neuronal noise may enhance the detectability of weak signals that would otherwise not reach threshold, a process known as ‘stochastic resonance’ (Wiesenfeld & Moss, 1995; Stacey & Durand, 2000; Rudolph & Destexhe, 2001; Stacey & Durand, 2001). Noise can also modulate the input–output (I–F) curve of neurones (Chance et al. 2002) and may underlie the contrast invariance exhibited by complex cells in primary visual cortex (Anderson et al. 2000).
Despite the growing interest in subthreshold aspects of voltage noise in neurones, only a handful of experiments directly address the mechanisms involved in shaping the subthreshold voltage noise. Most of these are theoretical in nature (Manwani & Koch, 1999a,b; Steinmetz et al. 2000): the very few studies that do measure voltage noise experimentally in central neurones (White et al. 1998) do not systematically probe the sources of this noise (but see Diba et al. 2004). There are several possible sources of voltage noise in neurones: the stochastic nature of ion channels, random synaptic inputs and thermal noise. In this paper, we study systematically the somatic subthreshold voltage noise in neocortical slices. Voltage traces were recorded from layer IV–V pyramidal neurones at different holding potentials and under different pharmacological treatments. The latter enabled us to dissociate the different sources involved in shaping the voltage noise. We focus in this first study on the relative role of holding potential, Na+ conductance and in vitro synaptic activity on voltage noise. We show that ion channel noise is significant in the subthreshold voltage regime and that it increases in a non-linear fashion with depolarization. This increase is limited to the low-frequency range of voltage noise (0.2–2 Hz), and arises mostly from an increase in apparent resistance attributed to Na+ conductance. Synaptic activity in the in vitro preparation is shown to dominate the noise in the high-frequency (5–100 Hz) range.
Methods
Slice preparation
Slices were prepared from the somatosensory cortex of Sprague-Dawley rats (PN11–22). All procedures used in the study adhered to guidelines approved by the Hebrew University of Jerusalem Animal Care Committee and conform to NIH guidelines. The rat was anaesthetized with an i.p. injection of pentobarbital (40 mg kg−1) and decapitated, and its brain was exposed. An incision was made rostral to the cerebellum and caudal to the optic chiasm and the brain was removed into cold Ringer solution (see below). The hemispheres were separated through the midline and one hemisphere was glued onto the cutting chamber. A block was made from the somatosensory cortex dorsal to the hippocampus. Para-sagittal slices (300 μm thick) were prepared (Vibroslice, Campden Instruments) and were bathed for 40 min in warm (37°C) oxygenized Ringer solution. The slices were then gradually cooled to room temperature. Recordings were made in Ringer solution containing (mm): 124 NaCl, 3 KCl, 2.4 CaCl2, 1.15 NaH2PO4, 1.3 MgSO4, 26 NaHCO3, and 10 d-glucose, while saturated with 95% O2–5% CO2 at 29–30°C. Patch pipettes were filled with a solution containing (mm): 140 potassium gluconate, 4 NaCl, 0.5 CaCl2, 5 Mg-ATP, 5 EGTA, 10 Hepes. Pipette solution was at pH 7.2, and the pipette resistance was 2–4.5 MΩ. Pyramidal cells were identified visually. Within the age range of animals used in this study, no result varied systematically with age. Results were therefore pooled.
Pharmacology
Synaptic activity was blocked by the application of 6,7-dinitro-quinoxaline-2,3-dione (DNQX; 100 μm, Tocris Cookson) and gabazine (2 μm, Sigma-Aldrich), and Na+ channels were blocked using 1 μm TTX (Alomone Laboratories).
Data acquisition
Recordings were made using an Axoclamp-2A (Axon Instruments, Union City, CA, USA) amplifier and were sampled by a National Instruments board (PCI-MIO-16XE) at rates of either 10 kHz or 5 kHz, with an antialiasing filter at 3 kHz. The same board was used for converting 500 Hz digital signals (chirps, see below) into analog current signals injected into the cell with no prefiltering. The experimental system was controlled by a custom-built interface written in the LabVIEW environment (V5.1 and 6, National Instruments, Austin, TX, USA). For each experimental condition, data were collected for a duration of 2 min.
Data analysis
All data were analysed offline using MATLAB R12/13 (The MathWorks, Natick, MA, USA). Voltage traces were analysed individually for each holding potential after band-pass filtering (0.2–100 Hz). Since we are interested in stationary, subthreshold voltage noise properties, we manually removed traces that contained excess spiking or recording instabilities. To calculate all statistics (e.g. standard deviation, voltage histogram), voltage traces were divided into 5 s segments (overlap of 2.5 s), the statistics were calculated individually for each segment after subtraction of its mean, and the results were then averaged across all segments. Power spectral density was calculated using the Welch averaged, modified periodogram method, using a discrete prolate spheroidal sequence (DPSS) window (NW = 3) of length 5 s, giving a resolution of 0.2 Hz. Prior to all analyses, spikes were removed from the data (from 150 ms prior to the spike to 250 ms after the spike) and replaced by a line connecting the end points of the removed segment. Spikes were extremely rare in our preparation. When several recordings were available for the same holding potential, the mean of the power spectra was calculated, weighing each recording by its duration.
The input impedance |Zin(f)| was obtained by injecting a logarithmic current chirp (0.1–100 Hz, duration 5 s) of minimal amplitude (typically 10–20 pA) into the cell and measuring the average voltage response (Hutcheon et al. 1994; Gutfreund et al. 1995; Lampl & Yarom, 1997). The impedance was calculated by taking the ratio of voltage and current Fourier transforms. Input resistance R and time constant τm were extracted by fitting the resulting impedance curve to a function of the family:
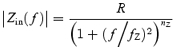 |
(1) |
with R, fZ (cut-off frequency) and nZ (the impedance slope) as free parameters (Koch, 1984). The time constant is related to the cut-off frequency by τm= 1/2πfZ.
The voltage noise amplitude σV was computed by taking the square root of the power spectrum integral in the desired frequency range (0.2–100 Hz for the entire frequency range, 0.2–2 Hz for the low frequency (LF) range, 15–35 Hz for the high frequency (HF) range; limiting the high frequency region helped avoid problems arising from instrumental spectral peaks around 50 Hz). LF and HF impedance were computed by averaging the impedance within the corresponding frequency range.
Instrument noise estimation
We assume that the recorded voltage spectrum ![]() can be written as:
can be written as:
| (2) |
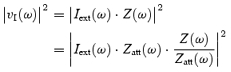
This is the sum of the actual membrane voltage spectrum |v(ω)|2 and the non-biological (instrumental) external noise, |η(ω)|2 (biological and external noise can be assumed to be independent). The external noise can be decomposed into:
| (3) |
vI(ω) is generated by an external current noise source, Iext(ω), falling on the electrode and affecting it through the impedance:
| (4) |
The voltage noise source, vext(ω) is assumed to be an additive voltage noise source arising from the access resistance and sources down-stream to the electrode, and can therefore be estimated by recording the voltage fluctuations with a shielded RC circuit replacing the recording electrode (DeFelice, 1981). Figure 1A shows the voltage power spectrum recorded with a shielded RC circuit (50 MΩ/500 pF), ![]() , which obeys
, which obeys ![]() due to imperfect shielding; however, the shielding should eliminate most of the external current noise. Because this configuration is used to measure noise downstream of the electrode (e.g. amplifier noise, quantization), our choice of a RC cell is not crucial. To estimate |vI(ω)|2, the voltage power spectrum in the cell-attached configuration (before breaking the membrane seal), |vatt(ω)|2, is recorded. An example of such a spectrum from one cell is shown in Fig. 1B. While most voltage fluctuations in cell-attached configuration arise from external current sources, there can still be some voltage fluctuations due to ion channel fluctuations in the membrane patch under the pipette. We can therefore write
due to imperfect shielding; however, the shielding should eliminate most of the external current noise. Because this configuration is used to measure noise downstream of the electrode (e.g. amplifier noise, quantization), our choice of a RC cell is not crucial. To estimate |vI(ω)|2, the voltage power spectrum in the cell-attached configuration (before breaking the membrane seal), |vatt(ω)|2, is recorded. An example of such a spectrum from one cell is shown in Fig. 1B. While most voltage fluctuations in cell-attached configuration arise from external current sources, there can still be some voltage fluctuations due to ion channel fluctuations in the membrane patch under the pipette. We can therefore write
Figure 1. Estimation of instrument noise.

A, power spectrum of voltage trace recorded with a shielded RC circuit connected to the recording system. B, power spectrum of voltage noise recorded in cell-attached configuration. Arrows point to frequencies of sinusoidal current injection (5 and 20 Hz). C, impedance amplitude in the cell-attached (upper trace) and whole-cell (lower trace) configurations. D, voltage power spectrum before (black) and after (red) removal of the upper bound on the instrumental noise (green). The black line was shifted down to facilitate comparison with the subtracted trace. Gaps in the red curve are the result of noise over-estimation which results in negative power values.
| (5) |
Equation (4) can be manipulated as follows:
 |
(6) |
and combined with eqns (5) and (6) to yield:
| (7) |
Figure 1C depicts the impedance curves (|Zatt(ω)| upper trace, | Z(ω)|2 lower trace) for the same cell for which | vatt(ω)|2 was shown (Fig. 1B). By combining eqn (3) and eqn (7), we can derive an upper bound on the non-biological noise | η (ω)|2 by the measured quantities:
| (8) |
Figure 1D shows the voltage power spectrum ![]() for this cell (black line, shifted down to facilitate comparison), with the respective upper-bound noise estimate
for this cell (black line, shifted down to facilitate comparison), with the respective upper-bound noise estimate ![]() (green line). The noise bound is about an order of magnitude below the measured spectrum,
(green line). The noise bound is about an order of magnitude below the measured spectrum, ![]() , implying that spectra reflect biological noise sources in this frequency range. The noise corrected spectrum,
, implying that spectra reflect biological noise sources in this frequency range. The noise corrected spectrum, ![]() (red line) is almost identical to the original
(red line) is almost identical to the original ![]() . A further confirmation of the quality of noise estimation was done by injecting sinusoidal current during recording of voltage traces in both cell-attached and whole-cell configuration. These manifest themselves as peaks in the power spectra at the respective frequencies (arrows in Fig. 1B and D at 5 Hz and 20 Hz). Under ideal conditions, taking the difference
. A further confirmation of the quality of noise estimation was done by injecting sinusoidal current during recording of voltage traces in both cell-attached and whole-cell configuration. These manifest themselves as peaks in the power spectra at the respective frequencies (arrows in Fig. 1B and D at 5 Hz and 20 Hz). Under ideal conditions, taking the difference ![]() should remove the peaks, and would result in a lower bound for the actual spectrum | v(ω)|2. In practice, the peaks disappear after the subtraction of the estimated noise (Fig. 1D, red line), except for the very prominent 50 Hz peak. This gives further support to the view that the measured voltage spectrum
should remove the peaks, and would result in a lower bound for the actual spectrum | v(ω)|2. In practice, the peaks disappear after the subtraction of the estimated noise (Fig. 1D, red line), except for the very prominent 50 Hz peak. This gives further support to the view that the measured voltage spectrum ![]() is of biological origin.
is of biological origin.
Across the 15 cells for which impedance and spectral data were available for both cell-attached and whole-cell configurations, the noise estimate ![]() in the 0.2–100 Hz range was significantly lower than the measured signal. After application of both synaptic blockers and TTX, voltage amplitude
in the 0.2–100 Hz range was significantly lower than the measured signal. After application of both synaptic blockers and TTX, voltage amplitude ![]() decreased, and the highest frequency range (> 25 Hz) sometimes reached our instrument noise level estimate. Indirect evidence suggests, though, that even in this frequency range, the noise estimate was exaggerated and signals were still above noise level. This is demonstrated, e.g. in Fig. 8A, where spectra are still separable well above 25 Hz, indicating that the instrumental noise level has not been reached.
decreased, and the highest frequency range (> 25 Hz) sometimes reached our instrument noise level estimate. Indirect evidence suggests, though, that even in this frequency range, the noise estimate was exaggerated and signals were still above noise level. This is demonstrated, e.g. in Fig. 8A, where spectra are still separable well above 25 Hz, indicating that the instrumental noise level has not been reached. ![]() should therefore be treated as a very conservative upper bound on noise level.
should therefore be treated as a very conservative upper bound on noise level.
Figure 8. The effect of Na+ blockage on voltage noise.

A, voltage PSDs before (continuous lines) and after (dotted lines) the addition of TTX at two different holding potentials. B, impedance amplitude before and after addition of TTX at the same holding potentials. C, estimated current PSD extracted from the voltage PSD and the impedance using the relationship 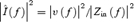 . D, ratio of voltage noise (black bars) before and after addition of TTX as a function of holding potential in n= 18 cells. The effect of adding TTX was only significant in the depolarized voltage range (−55 ± 4.6 mV) (P < 10−3). Impedance ratio (red bars) exhibits a similar behaviour (only significant at high holding potentials, P < 1.1 × 10⁻⁴), although failing to account fully for the effect of TTX. E, same as D, for the HF range. TTX has no significant effect on voltage noise except for a small decrease (ratio 1.2, P < 8 × 10⁻⁴) in the depolarized voltage range. HF impedance is unaffected by the addition of TTX. F, impedance as a function of holding potential for LF and HF. There is no significant dependence of impedance on holding potential after blocking Na+ conductance.
Stochastic conductance model
All simulations were performed using a single compartment with a membrane area of 30 000 μm2. The specific membrane capacitance was set to 1 μF cm−2. Two membrane conductances were incorporated in the model: a deterministic leak conductance (gleak= 0.2 pS μm−2, Eleak=−75 mV), and a stochastic inactivating Na+ conductance with seven closed/inactivated states and one open state with a channel density of 1.25 channels μm−2 and a single channel conductance of 20 pS as in Mainen et al. (1995) (kinetics shifted by +5 mV to compensate for junction potential). The parameters were chosen to yield physiological values for both the time constant and input impedance at the relevant holding potentials. The synaptic activity was restricted to excitatory AMPA synapses (one synapse at a rate of 5 Hz). Synaptic parameters were tpeak= 2 ms, gpeak= 600 pS, EAMPA= 0 mV. Simulated traces were generated by performing Monte-Carlo simulations, described in (Steinmetz et al. 2000), within the NEURON simulation environment. The impedance, Zin(ω), was calculated using a ‘quasi-active’ membrane linearization, with the extended impedance class of NEURON (Hines & Carnevale, 1997). The low frequency limit of the impedance corresponds to the measured ‘apparent resistance’.
Results
Basic properties of cortical pyramidal neurones
Voltage recordings were obtained from the somata of 76 pyramidal neurones located in layers IV and V of the somato-sensory cortex of the rat. The dimensions of the cell bodies (as measured by horizontal and vertical diameters) ranged from 15 μm × 15 μm to 25 μm × 30 μm. Resting potential was in the range −75 mV to −50 mV (Fig. 2A; mean −59.8 ± 5.7 mV, n= 76). Input resistance (n= 18) was in the range 76–440 MΩ (mean 244 ± 98 MΩ) and membrane time constant ranged between 16 and 68 ms (mean 34 ± 17 ms) (Fig. 2B). There was no statistically significant correlation between the input resistance and time constant of the cells (R2= 0.15, P= 0.12). Within the age group used in this study, no correlation was found between age and these two parameters (age: τin: P= 0.18, R2= 0.11; age: Rin: P= 0.84, R2= 0.003).
Figure 2. Basic properties of cortical neurones.

A, histogram of resting potentials for the 74 cells measured. Red bars indicate cells for which input resistance and time constant are shown in B. B, scatter plot of membrane time constant, τm, versus input resistance (n= 20). These measures are not correlated with each other (P < 0.12). C, an example of a 1.5 s voltage trace exhibiting occasional EPSPs (arrows) and random voltage fluctuations.
The voltage traces contained a variety of fluctuations, some of which can clearly be identified as postsynaptic potentials (PSPs; arrows in Fig. 2C). A careful examination of many traces revealed that synaptic activity occurred at a low rate (< 5 Hz), and contained almost exclusively excitatory postsynaptic potentials (EPSPs). Inhibitory neurones may be more susceptible to the surgical procedure and may require sucrose replacement during the slice preparation in order to survive.
Dependence of noise amplitude on holding potential
In most cells, the amplitude of the voltage fluctuations increased with depolarization. For the representative cell in Fig. 3A, 19 mV of depolarization resulted in a more than twofold increase in noise level. Figure 3B summarizes the voltage dependence of noise amplitude of 65/76 cells for which data from more than one holding potential were collected. Most cells exhibited a non-linear increase in the noise amplitude with depolarization. The average noise amplitude, σV (Fig. 3B dashed black line), increased from 0.19 mV at −74.3 ± 4.4 mV to 0.54 mV at −55 ± 4.6 mV. The non-linear increase of voltage noise with depolarization is demonstrated more directly in Fig. 3C, where the rate of noise increase (ΔσV/ΔV) was calculated. For noise growing linearly with holding potential, the dots should have equal slope values (magenta line). For most cells, the rate was larger in the depolarized range (ordinate) than in the hyperpolarized range (abscissa). The slope values increased significantly as the membrane potential was depolarized (P< 10−3, Wilcoxon signed rank test).
Figure 3. Dependence of noise amplitude on holding potential.

A, voltage traces (20 s long) from a single cell taken at different holding potentials show an increase in noise amplitude with depolarization. B, noise amplitude (as quantified by the standard deviation) as a function of holding potential (n= 65). Lines interconnect all points relating to the same cell. Mean behaviour of the cells is shown by the dashed black line. The cell from which the traces in A were taken is marked in red. C, noise increase slope ΔσV/ΔV in the hyperpolarized voltage range (abscissa: between −74.3 ± 4.4 mV and −65.1 ± 5.2 mV) and in the depolarized voltage range (ordinate: between −65.1 ± 5.2 mV and −55 ± 4.6 mV). Each dot represents a single cell (n= 57), and the red dot corresponds to the cell from A. Magenta line shows the expected position of dots had noise increased linearly with depolarization.
Noise spectrum dependence on holding potential
To further investigate properties of the voltage noise, we analysed the power spectral density (PSD) of the voltage traces. Figure 4A shows the PSD of one cell (the same cell as in Fig. 3A) for different holding potentials, plotted on a logarithmic scale. The spectra contain a relatively flat region in the 0.2–2 Hz range, with a linear fall-off above 5 Hz. The increase in the noise amplitude with depolarization is restricted to the low frequency (LF) spectrum, while the high frequency (HF) spectrum is independent of holding potential. The population behaviour is summarized in Fig. 4B. The LF noise (blue lines) exhibits a strong dependence on holding potential (exponential fit with ρ= 0.45, P< 10−3), whereas the HF noise (red lines) depends only weakly, if at all, on holding potential. The slope of the spectral fall-off in the HF range is narrowly distributed in the population (−2.37 ± 0.3log(mV2)/log(Hz).
Figure 4. Dependence of voltage power spectrum on membrane voltage.

A, power spectral density of voltage noise in the 0.2–100 Hz range shows a plateau at low frequencies (0.2 < f < 2 Hz) and a constant fall-off above 5 Hz. Blue and red bars indicate the frequency range used for the analysis in B. B, low-frequency voltage noise (LF, 0.2–2 Hz: blue lines) shows a strong dependence on holding potential (ρ= 0.45, P< 10−3, exponential fit marked by thick dashed line), while the high-frequency voltage noise (HF, 15–35 Hz: red lines) shows much weaker and insignificant dependence on holding potential. Noise in these frequency bands was calculated by integrating the power spectrum within the given frequency range (blue/red lines in A).
The contribution of impedance to the voltage noise
In 22/76 of the cells, impedance measurements were performed at all holding potentials at which voltage noise was recorded. Figure 5 shows the power spectra (Fig. 5A) and the impedance curves (Fig. 5B) of one cell at different holding potentials. The increase in LF voltage noise with depolarization is accompanied by a corresponding increase in LF impedance. This suggests that the increase in LF noise with depolarization may, at least partially, result from an increase in impedance, and not necessarily from an increase in the magnitude of stochastic current noise. The effect of depolarization on impedance across the population (n= 18) is summarized in Fig. 5C, showing that the voltage dependence of the impedance is limited to the LF range (blue line), in line with the expected phenomenological contribution of membrane conductances in this regime. We compared the dependence of LF noise on holding potential to the increase in LF impedance. The LF noise increased, on average, by a factor of 3.7 when the cells depolarized from −74 mV to −55 mV, on average (Fig. 5D, black bar). This increase in LF noise is accompanied by a slightly lower increase in | Zin(f)|, with an average factor of 2.5 (Fig. 5D, red bar). Thus, 70% of the voltage noise amplification with depolarization can be accounted for by the impedance increase alone (log2.5/log3.7 = 0.7; see the on-line Supplemental material), while the remaining noise increase probably results from an increase in the magnitude of the current noise (see the Discussion). As will be shown with application of TTX (see also Discussion), it is the Na+-dependent increase in ‘apparent resistance’ that accounts for most of the increase in noise. There is no significant increase in either noise or impedance in the HF range.
Figure 5. Relationship between input impedance and voltage spectrum.

A, voltage PSD at three different holding potentials in one cell. B, impedance amplitude | Z | for the same cell at the same three holding potentials. Impedance and voltage PSD both increase with depolarization in the LF range. C, impedance amplitude | Z | in the low-frequency band (LF, 0.2–2 Hz: blue lines) shows a strong dependence on holding potential (ρ= 0.4, P < 3 × 10⁻³, exponential fit marked by thick dashed line), while in the high-frequency band (HF, 15–35 Hz: red lines) there is no such dependency (P < 0.91). D, bars indicate the mean ±s.d. increase in voltage noise (black bar) as the cells depolarize on average from −74 mV to −55 mV, and the corresponding increase in LF impedance (red bar). The amplification factor (ordinate) is the voltage noise (or impedance) after the depolarization divided by the voltage noise (or impedance) before depolarization.
Contribution of synaptic activity to voltage noise
So far, it has been shown that voltage noise can be decomposed into components that arise from impedance and components that arise from current noise. This method is now combined with pharmacology to dissect the relative contribution of synaptic activity and Na+ conductance to the voltage noise.
Synaptic potentials could be observed in the voltage traces of many cells (see, e.g. Fig. 2C). We measured the frequency and amplitude of excitatory synaptic events. Across the population (n= 18), the average EPSP frequency was 2.1 Hz (an interevent interval histogram from one cell is shown in Fig. 6A), and the average amplitude 0.58 mV (amplitude histogram from the same cell in Fig. 6B); noise limited the detection of EPSPs to above 0.2 mV in this cell. The inter-event intervals had a coefficient of variation of 1.05, close to the value 1 expected for a Poisson process. This supports the claim that the events we identify lacked regularity and therefore do not represent oscillatory events.
Figure 6. The effect of synaptic blockers on voltage noise.

A, inter-EPSP interval histogram for one cell. Detected EPSPs had a mean frequency of 2.1 Hz. The red line marks the fit to an exponential distribution expected from Poisson statistics of EPSPs. B, EPSP base-to-peak amplitude histogram for the same cell. Root-mean-squared amplitude was 0.58 mV. The broken blue line marks the detection threshold in this cell, resulting from the noise. C, application of synaptic blockers attenuates the voltage PSD at high frequencies, revealing a dependence on holding potential. D, impedance depends on holding potential (black versus red as in C) but is independent of synaptic activity (continuous versus dotted lines).
To study how synaptic activity contributes to the voltage noise, synaptic blockers (DNQX and gabazine) were applied to the bath solution. As shown in Fig. 6C, the HF voltage noise was attenuated by the application of synaptic blockers, and exhibited voltage dependence. The insensitivity of the impedance to synaptic blockers (Fig. 6D) indicates that the synaptic input acted as a current noise source, a situation that may not apply to in vivo conditions (see below).
Figure 7 summarizes the effect of synaptic blockers (n= 18). The ratio of HF voltage noise before and after application of synaptic blockers is significantly higher than 1 (black bars in Fig. 7A). This indicates that synaptic noise dominates the HF voltage noise at all holding potentials. Again, this effect must be attributed to synapses acting as a current source, since the blocking of synapses does not affect the impedance in the HF range (Fig. 7A, red bars). It should be emphasized that under our in vitro conditions, the impact of synaptic input on cell properties is smaller than under in vivo conditions. In fact, a 5-fold increase of input resistance has been measured in in vivo neocortical pyramidal cells following synaptic blockade (Destexhe & Pare, 1999) (see Discussion). In the LF range, there is no significant amplification or attenuation of voltage noise, although individual cells exhibit a variety of behaviours (see Discussion).
Figure 7. Contribution of synaptic activity to voltage noise.

A, the ratio of HF voltage noise before and after application of synaptic blockers in 18 cells (black bars, mean ±s.d.) reveals a significant contribution of synaptic noise to the HF voltage noise (P < 1.4·10−3 for all voltage ranges). The ratio of |Zin(f)| (red bars) is not significantly different from 1, indicating that in vitro synaptic activity does not change the cell impedance in this preparation (n= 18). B, HF noise before (magenta bars) and after (cyan bars) application of synaptic blockers (n= 18). After application of synaptic blockers, HF noise exhibited significant voltage dependence as opposed to the CTL condition, in which depolarization caused no significant increase in HF noise.
Non-synaptic HF voltage noise increased with depolarization. Figure 7B demonstrates this by plotting the mean HF voltage noise in the hyperpolarized and depolarized voltage ranges. In the presence of synaptic activity (magenta bars), depolarization does not significantly increase the HF noise across the population (Wilcoxon paired sample test, P= 0.08). After blocking synaptic activity (cyan bars), depolarization increased noise significantly (Wilcoxon paired sample test, P < 0.001).
Contribution of Na+ channels to voltage noise
Blockage of Na+ conductance affects the voltage noise observed in neurones in two different ways: directly, by blockage of Na+ channels in the measured neurone and indirectly, by blocking action potentials in other cells, thereby eliminating spike-evoked PSPs onto the measured cell. To isolate the direct effect of Na+ conductance on noise in the measured cell, recordings were performed in the presence of synaptic blockers (gabazine and DNQX) before and after application of the Na+ channel blocker TTX.
Figure 8A shows the power spectrum before and after TTX application in one cell at the depolarized holding potential, revealing that the voltage noise is affected by Na+ conductance mainly in the LF range. Similarly, the impedance at the depolarized holding potential is also decreased by the application of TTX (Fig. 8B). The attenuation in impedance accounts only partially for the decrease in LF voltage noise. This is more readily seen when calculating the estimated current PSD ![]() (Fig. 8C). The estimated current PSDs in the depolarized holding potential before and after adding TTX are not identical. We conclude that Na+ conductance acts both as a current noise source and as an impedance source due to TTX-dependent changes in the apparent resistance of the cell.
(Fig. 8C). The estimated current PSDs in the depolarized holding potential before and after adding TTX are not identical. We conclude that Na+ conductance acts both as a current noise source and as an impedance source due to TTX-dependent changes in the apparent resistance of the cell.
The ratio of noise before and after application of TTX is shown for the population of 18 cells in Fig. 8D (LF range) and Fig. 8E (HF range). Adding TTX attenuates voltage noise significantly only at depolarized holding potentials (black bars in Fig. 8D), where on average, LF voltage noise is attenuated by a factor of 2.3 ± 1.5 (P < 10−3), while HF voltage noise is only reduced by a factor of 1.2 ± 1 (black bars in Figs 8E, P < 8 × 10⁻⁴). The attenuation in voltage noise is accompanied by an attenuation of impedance in the LF range by a factor of 1.7 ± 0.6 (red bars in Fig. 8D, P < 1.1·10−4). Thus, across the population, Na+ conductance participates in shaping the voltage noise only at depolarized holding potentials and mainly in the LF range. Na+ conductance contributes to voltage noise mostly by increasing the LF impedance (64% of the effect) but also by acting as a current noise source. The increased LF impedance at depolarized holding potentials, which naively seems to contradict the expected increase in conductance, will be discussed in more depth later.
Voltage noise results are qualitatively supported by a simple conductance-based model
A minimal, stochastic, conductance-based model of a membrane patch is used to capture the basic qualitative behaviour of voltage noise observed in this study: the voltage dependence of both LF impedance and LF noise, arising from the increase in Na+-dependent apparent resistance; the merging of spectra in the HF range; and the attenuation and separation of HF spectra after the application of synaptic blockers.
A patch of membrane contains three conductances: a synaptic conductance, a deterministic leak conductance and a stochastic Na+ conductance (Fig. 9A). Analytical and numerical results are derived both in the presence and in the absence of simulated synaptic activity (see Methods). The results are summarized in Fig. 9. The Na+ conductance, gNa, increases with depolarization (Fig. 9B, magenta). The slope of the Na+ conductance also increases with depolarization in our holding potential range. This, in turn, increases significantly the slope resistance Rslope (see eqn (10)). Correspondingly, the ‘slope’ conductance gtotal (Fig. 9B, continuous black line) drops below the leak conductance (Fig. 9B, dashed black line). As shown in Fig. 9C, this causes an increase in the phenomenological impedance at low frequencies with depolarization. This result matches the observed increase in LF impedance in our cells (see Fig. 5B and C).
Figure 9. Summary of modelling results.

A, the model consists of a deterministic leak conductance (yielding passive Rin= 167 MΩ and τm= 50 ms), and a stochastic Na+ channels at a density of 1.25 μm−2 in a single compartment. B, the linearized membrane conductance decreases with depolarization (continuous line) in this range, while the leak conductance (broken line) is voltage independent. This results from the increasing slope of the Na+ conductance (magenta). The three holding potentials depicted in Fig. 9C are indicated with appropriately coloured vertical bars. C, the resulting phenomenological impedance at the corresponding holding potentials reflects the low-frequency contribution of the Na+ conductance (above). D, simulated traces are shown at two holding potentials for three scenarios: stochastic Na+ channels alone (thin traces), a Poisson train of EPSPs (5 Hz) (medium traces), and combined stochastic Na+ and synaptic activity (thick traces). Noise amplitudes are indicated in the appropriate colour for comparison. E, noise spectra are shown for the traces in Fig. 9D. Colours correspond to holding potential (as in A–D), and line thickness corresponds to condition (as in D).
Simulated voltage traces at two different holding potentials and their corresponding power spectra are shown in Fig. 9D and E, for three different conditions. In the presence of stochastic Na+ conductance and synaptic activity (thick traces), noise increases with depolarization (Fig. 9D) from σV= 0.35 mV at −66 mV to σV= 0.47 mV at −61 mV. The noise increase is restricted to the LF range of the spectra, while the HF spectra are merged (Fig. 9E), in accordance with the experimental results (see Fig. 4A). When synaptic activity is blocked (light traces), the noise is significantly attenuated (σV= 0.05 − 0.14 mV) (Fig. 9D) and exhibit voltage dependence across the entire frequency range (Fig. 9E). This, again, is in agreement with the experimental results (see Figs 6C and 7). The low noise level in these traces indicates that the stochastic fluctuations of Na+ channels represent a minor source of noise. Indeed, replacing stochastic Na+ channels with their deterministic counterparts in the presence of synaptic activity (not shown) yields noise spectra similar to those of the thick spectra. In contrast to the data, where synaptic blockage had an inconsistent effect in the LF range, the model exhibited consistent attenuation in the LF range. Removing Na+ channels from the model (medium traces) confirms that the HF spectrum results from the spectral properties of synaptic activity, and that the LF noise increase results directly from Na+ conductance effects on impedance; the LF spectra resulting from synaptic activity alone in fact decrease with depolarization.
These results show that moderate rates of synaptic activity and a stochastic Na+ conductance are sufficient to account qualitatively for the basic experimental observations: the increase in LF impedance and noise with depolarization, and the merging of the HF voltage spectra and their separation after blocking synaptic activity.
Discussion
In this work we have demonstrated that the subthreshold voltage noise recorded in the somata of layer IV–V cortical pyramidal neurones increases non-linearly with depolarization, from an average of 0.19 mV at −75 mV to 0.54 mV at −55 mV (Fig. 10, blue bars). Using a systematic methodology, we have shown for the first time that this noise increase, which was restricted to the low-frequency range (0.2–2 Hz), is mostly caused by an increase in the impedance of the neurones and is not due to an increase in the stochasticity of the noise sources. The finding that the voltage dependence of both the noise and the impedance is TTX sensitive (Fig. 10, red bars), implies that a Na+ conductance acts as a voltage-dependent amplifier of low-frequency transients. Synaptic noise was shown to dominate the high-frequency range (> 5 Hz). A minimal model, containing only stochastic Na+ conductance and synaptic activity, reproduced these results qualitatively. It is likely that under in vivo conditions of high synaptic activity, synaptic noise will affect the low frequency (LF) range as well.
Figure 10. Summary of noise amplitude in all experimental conditions.

For each experimental condition (CTL: control; SNB: synaptic blockers; TBL: synaptic blockers + TTX), the mean voltage noise amplitude is plotted in each holding potential range. Lines indicate standard error of the mean (n= 18).
Subthreshold voltage noise: irregular fluctuations versus resonant oscillatory activity
The repertoire of neuronal behaviour in the subthreshold voltage range is wide, and cells may display both regular, oscillatory activity and irregular fluctuations. Stellate cells (layer III) of the medial entorhinal cortex, for example, exhibit slow subthreshold membrane fluctuations in the 4–15 Hz range (Alonso & Llinás, 1989; White et al. 1998; Erchova et al. 2004; Schreiber et al. 2004), although their role in shaping the response to wide-band stimuli is debated. Hippocampal CA1 interneurones exhibit voltage fluctuations peaking at about 7 Hz when depolarized (Chapman & Lacaille, 1999). Such oscillatory activity has also been reported in many other cell types (basolateral amygdala: Pape & Driesang, 1998; Pape et al. 1998; thalamocortical neurones: Reinker et al. 2004 and many other cell-types). Neocortical pyramidal neurones can exhibit voltage oscillations in the 3–15 Hz range, with both the frequency and the magnitude of the resonant peak increasing with depolarization (Gutfreund et al. 1995). In the current study, we investigated the voltage noise within the range of membrane voltage where only irregular voltage fluctuations were observed. Our results are consistent with conductance-based models of neocortical pyramidal neurones (Mainen et al. 1995), which predict that subthreshold resonance should appear only at depolarized membrane potentials not reached in this study (Steinmetz et al. 2000).
Na+ conductance influences the input impedance at low frequencies
The increase in low frequency impedance with depolarization (Fig. 5C) may seem paradoxical at first glance, since both Na+ and K+ conductances are expected to increase in the subthreshold regime with depolarization, thus lowering the resistance of the cell. A linearization approach to the conductance equations (Koch, 1999) explains this result:
| (9) |
where ΔVn=V−En, and En is the battery of conductance n. Denoting ![]() , we get
, we get
| (10) |
The slope resistance is the reciprocal of the conductance G only in the absence of any voltage dependence. A voltage-dependent conductance gn can increase the ‘apparent’ resistance with depolarization if the term ![]() is negative (Mauro et al. 1970; Sabah & Leibovic, 1972). The Na+ conductance can contribute significantly to the apparent resistance because its driving force ΔVNa=V−ENa is negative and the slope of the sodium conductance
is negative (Mauro et al. 1970; Sabah & Leibovic, 1972). The Na+ conductance can contribute significantly to the apparent resistance because its driving force ΔVNa=V−ENa is negative and the slope of the sodium conductance ![]() is large and positive in the subthreshold range. The finding that the impedance loses its voltage dependence after TTX application supports this claim. The analytic results from the model presented above verify that the phenomenological impedance in the LF range, which corresponds to Rslope, grows with depolarization (Fig. 9B) due to the negative slope conductance of Na+.
is large and positive in the subthreshold range. The finding that the impedance loses its voltage dependence after TTX application supports this claim. The analytic results from the model presented above verify that the phenomenological impedance in the LF range, which corresponds to Rslope, grows with depolarization (Fig. 9B) due to the negative slope conductance of Na+.
Na+ conductance can, in practice, amplify non-Na+ noise sources through the impedance. In simpler terms, a current injection will yield a larger depolarization in the presence of a sodium conductance than without it. This can be interpreted as a mechanism for differentially amplifying LF transients as the membrane potential depolarizes.
Relative contribution of impedance and current noise in shaping voltage noise
Previous work performed in cell culture (Diba et al. 2004) showed that in the subthreshold regime, voltage and current noise could be related to each other through the impedance by the equation:
| (11) |
Thus, it is justified to decompose voltage noise changes into changes in input impedance and changes in current noise. For this equation to hold, the voltage fluctuations around the holding potential must be relatively small (Steinmetz et al. 2000). In our preparation, the voltage noise amplitude range was comparable to that of Diba et al. (2004) and the decomposition is therefore justified. The quantification of the relative contribution is discussed in detail in the on-line Supplemental material.
Synaptic activity dominates voltage noise in the high-frequency range
While depolarization resulted in an increase of LF voltage noise, the high frequency (HF) voltage noise remained unaffected (Fig. 5A and C). When synaptic blockers of AMPA receptors (DNQX) and GABAA receptors (gabazine) were applied to the bath solution, the voltage noise in the HF range was attenuated, unravelling the voltage dependence of the HF noise (Figs 6D and 7B). The HF impedance remained unchanged (Figs 6C and 7A), implying that at the low levels of synaptic activity in our preparation, PSPs could be considered purely as a source of current noise.
It is important to note that at the single cell level, blockage of synaptic activity had, occasionally, a significant effect also on the low-frequency voltage noise (see Fig. 6C at −78 mV). However, a population analysis failed to reveal a consistent behaviour. Furthermore, the direction of change could not be correlated with any other parameter of the neurone which we measured.
The effect of blocking slow synaptic currents (NMDA, GABAB, neuromodulatory currents) was not studied by us. Many of these currents require more depolarization or afferent input, both lacking in this study. Under in vivo conditions, these currents are expected to influence the voltage noise spectrum and contribute more significantly to the LF range. The conclusion that synaptic activity contribution is limited to the HF range should therefore be treated with caution.
Possible sources of the residual voltage noise
The residual voltage noise observed after applying synaptic blockers and TTX to the bath exhibited voltage dependence (Fig. 10, red bars). Across the population (n= 18), LF and HF voltage noise increased by 43% and 24%, respectively, when depolarized from −75 mV to −55 mV. The corresponding increase in impedance accounts for only a small portion of the voltage noise increase in the LF range, and is insignificant in the HF range. The residual conductances therefore manifest themselves mainly as current sources, not affecting the impedance as dramatically as Na+ conductance. Current noise can arise from the stochastic nature of ion channel gating, but also from stochastic current flow through open channels (Mak & Webb, 1997) and noisy open-state conductance (Siwy & Fulinski, 2002). It was recently shown that ion channel gating is sufficient to account for observed voltage noise in a cell culture preparation (Diba et al. 2004). Possible candidates for the residual voltage noise are Ca2+ conductances, K+ conductances and non-blocked synapses (e.g. NMDA). Work in cultured hippocampal neurones showed that replacing internal K+ with Cs+ or blocking L-type Ca2+ conductance using nifedipine both resulted in significant attenuation of residual current noise (Diba et al. 2004). These two results are consistent with noise arising from large-conductance Ca2+-activated K+ channels (BK channels) (Kang et al. 1996; 2000; Sun et al. 2003; Traub et al. 2003). These channels are activated upon depolarization, and have large single-channel conductance, making them good candidates for a current noise source (see Diba et al. 2004).
The relevance of in vitro voltage noise measurements for in vivo scenarios
The slice preparation allows recording of neuronal activity for long periods of time and the direct administration of drugs. Obviously, many characteristics of the intact in vivo brain are missing; in particular, the anatomy is severely compromised as neurones are disconnected from many presynaptic neurones, and the levels of synaptic and spiking activity are considerably lower than those encountered in the behaving animal. It is not surprising therefore that in vivo voltage noise in neocortical pyramidal cells can be larger by an order of magnitude when synaptic activity is not blocked (Pare et al. 1998). Nevertheless, neurones in the intact animal operate in many different behavioural and network states, which alter their intrinsic properties (Steriade, 2001). Periods of quiescence in vivo are expected to resemble more the in vitro state, and results from slice work can shed light on how neurones are expected to operate in such a regime.
In periods of intense synaptic activity, intrinsic properties are expected to change qualitatively. Experimental work has shown that in vivo, synaptic activity can increase the overall conductance of the cell by a factor of 3–5 (Destexhe & Pare, 1999). The contribution of Na+ conductance to the apparent resistance and hence to the overall noise will therefore diminish in vivo: As seen in eqn (10), an increase in the overall conductance G would diminish the effect of changing the voltage-dependent terms. The voltage-dependent effect of Na+ is expected to be more prominent in periods of quiescence.
It is interesting to note that the slope of the fall-off in the high frequency regime of the voltage power spectrum (−2.4) is very similar to the slope reported by (Destexhe et al. 2003) in their in vivo study (−2.6). This is likely to reflect their common origin in synaptic activity.
Voltage noise can have both a limiting and an assisting role in neural computation. Fluctuations in membrane potential limit the accuracy with which neurones respond to a constant input (e.g. Mainen & Sejnowski, 1995). On the other hand, voltage noise can assist in the detection of weak signals (‘stochastic resonance’, e.g. Stacey & Durand, 2000) and has also been suggested to be involved in controlling the gain of I–F curves (Chance et al. 2002) and in maintaining contrast invariance of primary visual cortex neurones (Anderson et al. 2000). Theoretical work addressing the role of noise usually incorporates Gaussian, voltage-independent white noise (e.g. Gutkin & Ermentrout, 1998). In view of our results, these studies should incorporate the voltage dependence and spectral properties of real noise. The methodology presented here, applicable to any neural cell type, can help dissect the noise properties and sources and inspire the construction of models incorporating more realistic neuronal noise.
Acknowledgments
This work was supported by the National Institute of Mental Health, by the National Science Foundation, and by the Human Frontier Science Program. G.A.J. was funded by a fellowship from the Israeli Ministry of Science. K.D. was supported by a postdoctoral fellowship from the Sloan-Swartz Center for Theoretical Neuroscience at Caltech. We thank Hanoch Meiri for valuable technical assistance.
Supplemental material
The online version of this paper can be accessed at: DOI: 10.1113/jphysiol.2004.080903
http://jp.physoc.org/cgi/content/full/jphysiol.2004.080903/DC1 and contains supplemental material entitled: Quantifying relative contributions to voltage noise increase.
This material can also be found at:
http://www.blackwellpublishing.com/products/journals/suppmat/tjp/tjp785/tjp785sm.htm
References
- Alonso A, Llinás RR. Subthreshold Na+-dependent theta-like rhythmicity in stellate cells of entorhinal cortex layer II. Nature. 1989;342:75–177. doi: 10.1038/342175a0. [DOI] [PubMed] [Google Scholar]
- Anderson JS, Lampl I, Gillespie DC, Ferster D. The contribution of noise to contrast invariance of orientation tuning in cat visual cortex. Science. 2000;290:1968–1972. doi: 10.1126/science.290.5498.1968. [DOI] [PubMed] [Google Scholar]
- Chance FS, Abbott LF, Reyes AD. Gain modulation from background synaptic input. Neuron. 2002;35:773–782. doi: 10.1016/s0896-6273(02)00820-6. [DOI] [PubMed] [Google Scholar]
- Chapman CA, Lacaille JC. Intrinsic theta-frequency membrane potential oscillations in hippocampal CA1 interneurons of stratum lacunosum-moleculare. J Neurophysiol. 1999;81:1296–1307. doi: 10.1152/jn.1999.81.3.1296. [DOI] [PubMed] [Google Scholar]
- DeFelice LJ. Introduction to Membrane Noise. New York: Plenum Press; 1981. [Google Scholar]
- Destexhe A, Pare D. Impact of network activity on the integrative properties of neocortical pyramidal neurons in vivo. J Neurophysiol. 1999;81:1531–1547. doi: 10.1152/jn.1999.81.4.1531. [DOI] [PubMed] [Google Scholar]
- Destexhe A, Rudolph M, Pare D. The high-conductance state of neocortical neurons in vivo. Nat Rev Neurosci. 2003;4:739–751. doi: 10.1038/nrn1198. [DOI] [PubMed] [Google Scholar]
- Diba K, Lester HA, Koch C. Intrinsic noise in cultured hippocampal neurons: experiment and modeling. J Neurosci. 2004;24:9723–9733. doi: 10.1523/JNEUROSCI.1721-04.2004. [DOI] [PMC free article] [PubMed] [Google Scholar]
- Erchova I, Kreck G, Heinemann U, Herz AV. Dynamics of rat entorhinal cortex layer II and III cells: characteristics of membrane potential resonance at rest predict oscillation properties near threshold. J Physiol. 2004;560:89–110. doi: 10.1113/jphysiol.2004.069930. [DOI] [PMC free article] [PubMed] [Google Scholar]
- Gutfreund Y, Yarom Y, Segev I. Subthreshold oscillations and resonant frequency in guinea-pig cortical neurons: physiology and modelling. J Physiol. 1995;483:621–640. doi: 10.1113/jphysiol.1995.sp020611. [DOI] [PMC free article] [PubMed] [Google Scholar]
- Gutkin BS, Ermentrout GB. Dynamics of membrane excitability determine interspike interval variability: a link between spike generation mechanisms and cortical spike train statistics. Neural Comput. 1998;10:1047–1065. doi: 10.1162/089976698300017331. [DOI] [PubMed] [Google Scholar]
- Hines ML, Carnevale NT. The NEURON simulation environment. Neural Comput. 1997;9:1179–1209. doi: 10.1162/neco.1997.9.6.1179. [DOI] [PubMed] [Google Scholar]
- Hutcheon B, Miura RM, Yarom Y, Puil E. Low-threshold calcium current and resonance in thalamic neurons: a model of frequency preference. J Neurophysiol. 1994;71:583–594. doi: 10.1152/jn.1994.71.2.583. [DOI] [PubMed] [Google Scholar]
- Kang J, Huguenard JR, Prince DA. Two types of BK channels in immature rat neocortical pyramidal neurons. J Neurophysiol. 1996;76:4194–4197. doi: 10.1152/jn.1996.76.6.4194. [DOI] [PubMed] [Google Scholar]
- Kang J, Huguenard JR, Prince DA. Voltage-gated potassium channels activated during action potentials in layer V neocortical pyramidal neurons. J Neurophysiol. 2000;83:70–80. doi: 10.1152/jn.2000.83.1.70. [DOI] [PubMed] [Google Scholar]
- Koch C. Cable theory in neurons with active, linearized membranes. Biol Cybern. 1984;50:15–33. doi: 10.1007/BF00317936. [DOI] [PubMed] [Google Scholar]
- Koch C. Biophysics of Computation: Information Processing in Single Neurons. 1st. New York: Oxford University Press; 1999. [Google Scholar]
- Lampl I, Yarom Y. Subthreshold oscillations and resonant behavior: two manifestations of the same mechanism. Neuroscience. 1997;78:325–341. doi: 10.1016/s0306-4522(96)00588-x. [DOI] [PubMed] [Google Scholar]
- London M, Schreibman A, Hausser M, Larkum ME, Segev I. The information efficacy of a synapse. Nat Neurosci. 2002;5:332–340. doi: 10.1038/nn826. [DOI] [PubMed] [Google Scholar]
- Mainen ZF, Joerges J, Huguenard JR, Sejnowski TJ. A model of spike initiation in neocortical pyramidal neurons. Neuron. 1995;15:1427–1439. doi: 10.1016/0896-6273(95)90020-9. [DOI] [PubMed] [Google Scholar]
- Mainen ZF, Sejnowski TJ. Reliability of spike timing in neocortical neurons. Science. 1995;268:1503–1506. doi: 10.1126/science.7770778. [DOI] [PubMed] [Google Scholar]
- Mak DO, Webb WW. Conductivity noise in transmembrane ion channels due to ion concentration fluctuations via diffusion. Biophys J. 1997;72:1153–1164. doi: 10.1016/S0006-3495(97)78764-2. [DOI] [PMC free article] [PubMed] [Google Scholar]
- Manwani A, Koch C. Detecting and estimating signals in noisy cable structure, I: neuronal noise sources. Neural Comput. 1999a;11:1797–1829. doi: 10.1162/089976699300015972. [DOI] [PubMed] [Google Scholar]
- Manwani A, Koch C. Detecting and estimating signals in noisy cable structures, II: information theoretical analysis. Neural Comput. 1999b;11:1831–1873. doi: 10.1162/089976699300015981. [DOI] [PubMed] [Google Scholar]
- Mauro A, Conti F, Dodge F, Schor R. Subthreshold behavior and phenomenological impedance of the squid giant axon. J General Physiol. 1970;55:497–523. doi: 10.1085/jgp.55.4.497. [DOI] [PMC free article] [PubMed] [Google Scholar]
- Nowak LG, Sanchez-Vives MV, McCormick DA. Influence of low and high frequency inputs on spike timing in visual cortical neurons. Cereb Cortex. 1997;7:487–501. doi: 10.1093/cercor/7.6.487. [DOI] [PubMed] [Google Scholar]
- Pape HC, Driesang RB. Ionic mechanisms of intrinsic oscillations in neurons of the basolateral amygdaloid complex. J Neurophysiol. 1998;79:217–226. doi: 10.1152/jn.1998.79.1.217. [DOI] [PubMed] [Google Scholar]
- Pape HC, Pare D, Driesang RB. Two types of intrinsic oscillations in neurons of the lateral and basolateral nuclei of the amygdala. J Neurophysiol. 1998;79:205–216. doi: 10.1152/jn.1998.79.1.205. [DOI] [PubMed] [Google Scholar]
- Pare D, Shink E, Gaudreau H, Destexhe A, Lang EJ. Impact of spontaneous synaptic activity on the resting properties of cat neocortical pyramidal neurons in vivo. J Neurophysiol. 1998;79:1450–1460. doi: 10.1152/jn.1998.79.3.1450. [DOI] [PubMed] [Google Scholar]
- Reinker S, Puil E, Miura RM. Membrane resonance and stochastic resonance modulate firing patterns of thalamocortical neurons. J Comput Neurosci. 2004;16:15–25. doi: 10.1023/b:jcns.0000004838.67584.77. [DOI] [PubMed] [Google Scholar]
- Rudolph M, Destexhe A. Correlation detection and resonance in neural systems with distributed noise sources. Phys Rev Lett. 2001;86:3662–3665. doi: 10.1103/PhysRevLett.86.3662. [DOI] [PubMed] [Google Scholar]
- de Ruyter van Steveninck RR, Lewen GD, Strong SP, Koberle R, Bialek W. Reproducibility and variability in neural spike trains. Science. 1997;275:1805–1808. doi: 10.1126/science.275.5307.1805. [DOI] [PubMed] [Google Scholar]
- Sabah NH, Leibovic KN. The effect of membrane parameters on the properties of the nerve impulse. Biophys J. 1972;12:1132–1144. doi: 10.1016/S0006-3495(72)86150-2. [DOI] [PMC free article] [PubMed] [Google Scholar]
- Schneidman E, Freedman B, Segev I. Ion channel stochasticity may be critical in determining the reliability and precision of spike timing. Neural Comput. 1998;10:1679–1703. doi: 10.1162/089976698300017089. [DOI] [PubMed] [Google Scholar]
- Schreiber S, Erchova I, Heinemann U, Herz AV. Subthreshold resonance explains the frequency-dependent integration of periodic as well as random stimuli in the entorhinal cortex. J Neurophysiol. 2004;92:408–415. doi: 10.1152/jn.01116.2003. [DOI] [PubMed] [Google Scholar]
- Siwy Z, Fulinski A. Origin of 1/f (alpha) noise in membrane channel currents. Phys Rev Lett. 2002;89:158101. doi: 10.1103/PhysRevLett.89.158101. [DOI] [PubMed] [Google Scholar]
- Stacey WC, Durand DM. Stochastic resonance improves signal detection in hippocampal CA1 neurons. J Neurophysiol. 2000;83:1394–1402. doi: 10.1152/jn.2000.83.3.1394. [DOI] [PubMed] [Google Scholar]
- Stacey WC, Durand DM. Synaptic noise improves detection of subthreshold signals in hippocampal CA1 neurons. J Neurophysiol. 2001;86:1104–1112. doi: 10.1152/jn.2001.86.3.1104. [DOI] [PubMed] [Google Scholar]
- Steinmetz PN, Manwani A, Koch C, London M, Segev I. Subthreshold voltage noise due to channel fluctuations in active neuronal membranes. J Comput Neurosci. 2000;9:133–148. doi: 10.1023/a:1008967807741. [DOI] [PubMed] [Google Scholar]
- Steriade M. Impact of network activities on neuronal properties in corticothalamic systems. J Neurophysiol. 2001;86:1–39. doi: 10.1152/jn.2001.86.1.1. [DOI] [PubMed] [Google Scholar]
- Sun X, Gu XQ, Haddad GG. Calcium influx via L- and N-type calcium channels activates a transient large-conductance Ca2+-activated K+ current in mouse neocortical pyramidal neurons. J Neurosci. 2003;23:3639–3648. doi: 10.1523/JNEUROSCI.23-09-03639.2003. [DOI] [PMC free article] [PubMed] [Google Scholar]
- Traub RD, Buhl EH, Gloveli T, Whittington MA. Fast rhythmic bursting can be induced in layer 2/3 cortical neurons by enhancing persistent Na+ conductance or by blocking BK channels. J Neurophysiol. 2003;89:909–921. doi: 10.1152/jn.00573.2002. [DOI] [PubMed] [Google Scholar]
- Victor JD, Purpura KP. Nature and precision of temporal coding in visual cortex: a metric-space analysis. J Neurophysiol. 1996;76:1310–1326. doi: 10.1152/jn.1996.76.2.1310. [DOI] [PubMed] [Google Scholar]
- White JA, Klink R, Alonso A, Kay AR. Noise from voltage-gated ion channels may influence neuronal dynamics in the entorhinal cortex. J Neurophysiol. 1998;80:262–269. doi: 10.1152/jn.1998.80.1.262. [DOI] [PubMed] [Google Scholar]
- Wiesenfeld K, Moss F. Stochastic resonance and the benefits of noise: from ice ages to crayfish and SQUIDs. Nature. 1995;373:33–36. doi: 10.1038/373033a0. [DOI] [PubMed] [Google Scholar]
Associated Data
This section collects any data citations, data availability statements, or supplementary materials included in this article.