Abstract
The influence of extracellular hypotonicity on the relationship between cell volume (Vc) and resting membrane potential (Em) was investigated in Rana temporaria skeletal muscle. Vc was measured by confocal microscope imaging of fibres through their transverse (xz) planes, and Em was determined using standard microelectrode techniques. Hypotonic solutions first elicited a rapid increase in fibre volume, ΔVR+ that fulfilled expectations of simple osmotic behaviour described in earlier reports. However, this was consistently followed by a slow increase in Vc (ΔVS+) to 10–15% above osmotic predictions. Longer (>1 h) exposures to hypotonic solutions permitted a subsequent slow decrease in Vc (ΔVS−), the eventual magnitude of which exceeded that of the preceding ΔVS+. Restoration of isotonic conditions elicited a prompt recovery in Vc that matched simple osmotic predictions and thus left a net change in Vc. Such alterations in Vc attributable to ΔVS+ then gradually reversed, while those due to ΔVS− persisted. Both ΔVS+ and ΔVS− persisted under conditions of Cl− deprivation. The depolarization of Em that accompanied ΔVR+ was consistent with dilution of intracellular [K+]. Em did not significantly alter during the subsequent ΔVS transients. These empirical features of ΔVS+ and ΔVS− were analysed using the quantitative charge-difference model of Fraser and Huang, published in 2004. This attributed the ΔVS+ to an electroneutral increase in the effective osmotic activity of normally membrane-impermeant intracellular anions. In contrast, the ΔVS− could only be explained by an efflux of such anions and was accordingly comparable to organic anion-dependent regulatory volume decreases reported in other cell types.
Skeletal muscle shows significant changes in both intracellular and extracellular osmolarity during both exercise and a variety of disease states. For example, exhaustive exercise can markedly increase intracellular lactate concentration and increase muscle fibre volume (V c) by up to 20% (Sjogaard et al. 1985). Yet while most cell types perform regulatory volume decreases (RVD) in response to swelling (reviewed by Lang et al. 1998a), RVD has not been demonstrated in mature skeletal muscle (Sejersted & Sjogaard, 2000). Conversely, the steady-state Vc of muscle fibres decreases linearly with increases in extracellular tonicity (Adrian, 1956; Blinks, 1965; Ferenczi et al. 2004). In Cl−-depleted frog skeletal muscle these decreases in Vc were accompanied by shifts in resting membrane potentials (Em) that followed expectations from the corresponding increases in intracellular potassium concentration ([K+]i) and the K+ Nernst equation (Adrian, 1956).
However, recent investigations of the response of skeletal muscle to extracellular hypertonicity in more physiological Cl−-containing Ringer solutions (Geukes Foppen et al. 2002; Ferenczi et al. 2004) demonstrated more complex relationships between Em and Vc. In contrast to the hyperpolarization of muscle fibres following fibre shrinkage, where K+ was the only significantly membrane-permeant ion (Adrian, 1956), similar osmotic reductions in Vc in such Cl−-containing solutions produced little change in Em. This stabilization of Em despite an increased [K+]i appeared to result from elevation (‘splinting’) of [Cl−]i above its electrochemical equilibrium concentration by the activity of cation−Cl− cotransport systems, including the Na+–K+–2Cl− cotransporter (NKCC; Geukes Foppen et al. 2002; Ferenczi et al. 2004). Thus, whereas the activity of such ion transporters is responsible for regulatory volume increase (RVI) in many other cell types (Lang et al. 1998a; Russell, 2000), it appears to regulate Em without significant influence upon Vc in skeletal muscle exposed to hypertonic solutions. Subsequent modelling showed that the high Cl− permeability (PCl) of skeletal muscle precluded a significant effect of cation−Cl− cotransport systems upon Vc without a far greater influence upon Em. In addition, any such changes to Vc or Em would reverse on cessation of the cation−Cl− cotransport activity, in contrast to the sustained changes to Vc and/or Em that could result from changes to intracellular impermeant anion content (Xi) and/or its effective mean valency (zX; Fraser & Huang, 2004).
The present experiments complement those recent studies of the effects of extracellular hypertonicity upon the relationship between Vc and Em (Ferenczi et al. 2004) by an examination of the effects of extracellular hypotonicity on this relationship, using measurements of Vc obtained using confocal xz-plane imaging and of Em using standard microelectrode techniques. The findings were then analysed in terms of a recent model (Fraser & Huang, 2004) that clarified the relationship between Vc and Em and described the possible mechanisms for their control in skeletal muscle.
Methods
All solutions were titrated to pH 7.0 (as measured with a combination pH electrode) and their osmolarities (θ) measured using a standard, calibrated vapour pressure osmometer. All experiments were conducted at 20–22°C. The control, isotonic, solutions used were: (A) standard Cl−-containing Ringer solution (mm): 115 NaCl, 2.5 KCl, 1.8 CaCl2, 3 Hepes, θ 227 mosmol l−1; (B) standard SO42− Ringer solution: 75 Na2SO4, 1.25 K2SO4, 8 CaSO4, 3 Hepes, θ 225 mosmol l−1. The compositions of the hypotonic test solutions were identical to those of either solution A or B apart from a reduction in the concentration of the principal solute (NaCl or Na2SO4). The isotonic test solutions, which were used to control for the reduced extracellular ion concentrations in the hypotonic test solutions, contained extracellular ion concentrations that matched those in the corresponding hypotonic solutions, but additionally contained sufficient sucrose to render their tonicities equal to the isotonic control solutions.
Sartorius and cutaneous pectoris muscles from cold-adapted Rana temporaria frogs (Blades Biological, Edenbridge, Kent, UK) previously killed by concussion followed by pithing (Schedule 1: Animals (Scientific Procedures) Act, Home Office, UK), were dissected in solution A. Several studies have reported comparable electrophysiological and osmotic properties in these two muscle types (Adrian, 1956; Ferenczi et al. 2004; Chin et al. 2004). For those experiments conducted under conditions of Cl− deprivation, the muscles were then gradually equilibrated with Cl−-free solutions by exposing them to a succession of Ringer solutions in which the Cl− content was progressively halved approximately every 5 min before a final transfer from 1 mm Cl− Ringer solution to Cl−-free Ringer solution. This protocol of gradual Cl− reduction avoided muscle twitching or contraction, in contrast to procedures that used more rapid removals of extracellular Cl−.
Cell volumes (Vc) were measured in groups of three to seven adjacent fibres in one- to three-fibre-thick cutaneous pectoris muscles mounted ventral side uppermost onto a coverslip that formed the base of a 0.5 ml microscope chamber. The chamber was sealed between solution changes to prevent evaporation. All solutions used to perfuse the muscle contained Sulphorhodamine B (Lissamine rhodamine B200: 75%; Aldrich-Sigma, UK) at a concentration of 62.5 μg ml−1 (Ferenczi et al. 2004). This membrane-impermeable dye stained the extracellular space and thereby highlighted muscle fibre edges, without influencing membrane electrophysiological properties (Gallagher & Huang, 1997). A Zeiss LSM-510 laser-scanning confocal microscope, incorporating an Axiovert 100M inverted microscope, was used to obtain images of fibres in the xz-plane using a 40× oil immersion objective. The Sulphorhodamine B was activated with a 543 nm wavelength laser and fluorescence emission captured at >560 nm. This generated images with a fluorescent extracellular space and dark fibre cross-sections.
Initial pilot scans in the xy-plane were obtained in order to ensure that the x-axes of the xz scans ran perpendicular to the fibre long axes. The definitive images were then obtained every 5–60 s in the xz-plane and in-house image analysis software was used to calculate the fibre cross-sectional areas. This software first corrected the fluorescence attenuation associated with scanning of the deeper fibre areas, according to calibration data obtained earlier and fully described by Ferenczi et al. (2004), then applied a noise filter and a threshold function. The cross-sectional area of each fibre in the field of view was then calculated. Since the muscle was secured at a constant length throughout each experiment, changes in the measured cross-sectional areas provided a direct indication of changes in cell volume. These cell volumes, Vc, were standardized relative to steady-state values obtained during an initial 10 min period in one of the control solutions, A or B. Volume recordings were not performed in muscles showing any evidence of reduced viability such as movement, contraction, T-system vacuolation or divergent volume changes between fibres within the field of view. Preliminary experiments showed that fibre lysis, indicated by the entry of dye into the cytoplasm, generally occurred within an hour of such changes.
These measurements of Vc were then compared with the corresponding predictions of cell volumes assuming that muscle fibres showed perfect osmometric behaviour. Thus, if Vp denotes such a predicted volume, Vc(a) the cell volume before the solution change, and θe(a) and θe(b) the extracellular osmolarity, measured using a vapour pressure osmometer, before (a) and after the solution change (b), respectively:
| (1a) |
This formulation would be expected to overestimate volume changes in the event that the osmotically exchangeable solvent fraction of fibres was <100%, as has been suggested in earlier work. For example, Blinks (1965) showed that skeletal muscle fibre volume changes were predicted most closely from an assumption that the solvent fraction was 0.67 of the cell volume in isotonic solutions, which would lead eqn (1a) to overestimate volume changes by almost 50%. However, estimates of the solvent fraction of skeletal muscle fibres vary in the literature (Dydynska & Wilkie, 1963; Ferenczi et al. 2004). More generally, then, if the solvent fraction of the muscle is given the symbol x, then:
| (1b) |
As will be seen, the present study identifies volume changes in response to hypotonicity that exceed osmotic expectations. Experimental volume changes were therefore compared to Vp (eqn (1a)) because this provided an upper limit prediction that was independent of the value of the solvent fraction, x, in the present preparation.
Membrane potentials (Em) were measured in sartorius muscles, known to have properties that closely resemble those of frog cutaneous pectoris muscles (Adrian, 1956), but providing considerably more fibres for electrophysiological study. They were mounted in a Perspex bath and pinned out stretched to ∼1.5 times their in situ length in accordance with previous electrophysiological studies (Koutsis et al. 1995; Ferenczi et al. 2004), to give centre sarcomere lengths (2.4–2.5 μm), measured using the microscope eyepiece graticule, that were similar to the cutaneous pectoris fibres studied under confocal microscopy. The experiments were all carried out at room temperature (20–22°C) to enable results of the electrophysiological and volume studies to be compared. Test solutions were added to or withdrawn from the bath when necessary, with two washes between the additions of new solutions.
Significance of results was assessed using Student's paired two-tailed t test to a significance level of P < 0.05. Significance of volume changes was assessed by comparing mean Vc over 100 s periods (mean of at least 5 images, where n was defined as the number of fibres in each image) at predefined time points. Pilot experiments using both hypertonic and hypotonic solutions showed that passive volume changes took approximately 300 s and the slow volume increase that resulted from exposure to hypotonic solutions reached a maximum volume after approximately 60 min. Therefore, the time points at which volume changes were assessed for significance were the 100 s periods immediately prior to, 300 s after and 60 min after each solution change, or at the end of the experimental period. Mean Vc at each of these time periods was compared to mean Vc at the previous time period using Student's paired t test, or to the predicted volume (Vp) using Student's single-sample t test, as stated. In addition, in those experiments involving the return of fibres to isotonic Ringer solution following a period in hypotonic Ringer solution, Vc at the end of the experimental period was compared with that at the beginning.
Results
Slow increases in fibre volume, ΔVS+, follow the initial passive volume response, ΔVR+, to exposures to hypotonic solutions
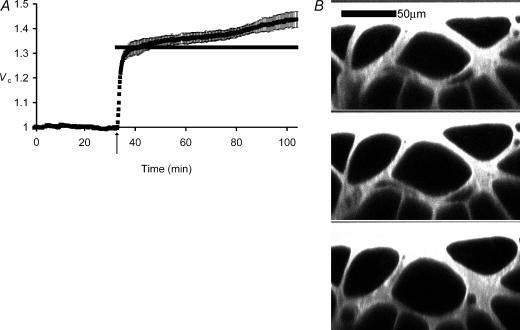
Figure 1 exemplifies the volume changes shown by groups of muscle fibres initially placed in a standard isotonic Ringer solution, then treated with a hypotonic Ringer solution. Application of the hypotonic extracellular solution initiated a pattern of volume changes (ΔV) that differed significantly from the straightforward linear relationships between Vc and extracellular osmolarity reported previously (Blinks, 1965; Ferenczi et al. 2004).
Figure 1. The response of skeletal muscle fibres to reduced extracellular tonicity.
A, mean (±s.e.m.) normalized volumes (Vc) of fibres (n= 3) in a muscle initially bathed in normal isotonic (227 mosmol l−1) Ringer solution and transferred after 32 min (arrow) to hypotonic (171 mosmol l−1) Ringer solution. The horizontal bar marks the predicted relative fibre volume (Vp, see Methods) assuming simple osmotic behaviour. Note that where the s.e.m. is not shown, it is smaller than the data point. Muscle fibres swelled rapidly (ΔVR+) to volumes close to Vp, but then continued to swell slowly (ΔVS+) over the next ∼1 h. B, confocal xz scans of muscle fibres before (top panel) and after transfer to hypotonic Ringer solution, showing fibres 300 s (middle panel) and 1 h (bottom panel) after solution change. Note that the ΔVS+ volume transient is associated with a change in fibre shape to more circular profiles, but not with predictable diameter changes. Thus, fibre diameters were 1.11 ± 0.04 at 300 s and 1.09 ± 0.05 at 1 h following the solution change (non-significant difference, P > 0.05), despite the significant increase in cross-sectional area.
Figure 1A thus shows an initial relatively rapid volume increase, ΔVR+, to a normalized of Vc to 1.32 ± 0.03 (n= 4 fibres) at 5 min after the solution change, close to the predicted volume assuming simple osmotic behaviour and corresponding to a rate of volume increase of ∼5% of the initial volume per minute. The rate of this initial swelling was similar to the rate of passive osmotic volume changes following applications of hypertonic solutions (Ferenczi et al. 2004). However, Vc then showed a much slower increase (ΔVS+) at a rate of ∼0.5% min−1 to reach a significantly (P < 0.01 on Student's paired t test versus the value of Vc at 5 min) larger Vc of 1.44 ± 0.03 at 60 min. Eleven muscles, in which Vc was recorded in 3–6 fibres of each, demonstrated similar rapid swelling to a mean value of Vc= 1.30 ± 0.02 after 5 min exposures to hypotonic Ringer solution but an eventual Vc= 1.42 ± 0.03 after 60 min, significantly exceeding the osmotic predictions (P≪ 0.01 on Student's single-sample t test). Figure 1B demonstrates that muscle fibre cross-sections in isotonic solutions were angular rather than circular in shape and that these volume changes largely involved changes in fibre shape to more circular profiles without predictable changes in fibre diameter.
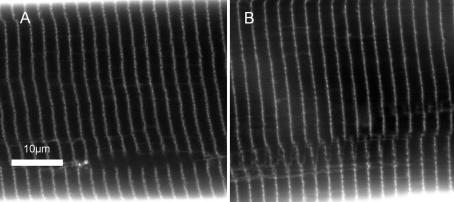
Figure 2 shows typical confocal images in the xy-plane of single muscle fibres in standard Ringer solution (Fig. 2A) and after a 60 min exposure to hypotonic Ringer solution (Fig. 2B) through regions of interest that transected the xz-plane used for volume measurements. These show no significant differences in sarcomere length, as reflected in unchanged longitudinal distances between successive T-tubules. The ΔVS+ was therefore not explicable in terms of an unexpected localized fibre shortening that could increase the local cross-sectional area whilst conserving total Vc. Figure 2 also shows that ΔVS+ could not have resulted from an increase in T-tubular luminal as opposed to true cytosolic volume; to account for this ∼10% increase in Vc, the fractional tubular volume would have had to have increased >300-fold from its normal value of ∼0.003 (Peachey, 1965) to >0.10, contrasting with the similarity of the tubular appearances in Fig. 2A and B. Furthermore, although the T-tubules of amphibian muscle are too narrow (<20 nm) for accurate light microscopic measurements of their diameters (Martin et al. 2003), upper limits on the contribution of the T-system to these volume changes could be estimated using Delesse's principle, that the volume fraction, Vv, of an object embedded within a larger reference volume such as a muscle fibre is directly proportional to its area fraction in random sections. Vv was accordingly estimated by point counting (Weibel, 1979), using a transparent grid placed randomly over each of the digital images and containing a quadratic set of 0.5 μm spaced points generated by intersections on the grid. If Pi denotes the number of points falling on T-tubular lumina and Ptot the total number of points made upon the reference area, then the volume fraction is the dimensionless ratio Vv=Pi/ Ptot. This gave statistically indistinguishable (P > 0.05) upper limits of tubular luminal volume fractions of 0.081 ± 0.011 (n= 6) in standard Ringer solution and 0.065 ± 0.009 (n= 6) in hypotonic Ringer solution.
Figure 2. The influence of hypotonicity on T-tubular system.
Fibres were imaged in the xy-plane using confocal microscopy in standard isotonic (227 mosmol l−1) Ringer solution (A) and in hypotonic (171 mosmol l−1) Ringer solution (B). T-system appearance remained unchanged and neither the mean distances between successive T-tubules nor T-system volume fractions, measured using Delesse's principle, were significantly altered by the exposure to hypotonic Ringer solution.
ΔVS+ varies with the degree of extracellular hypotonicity
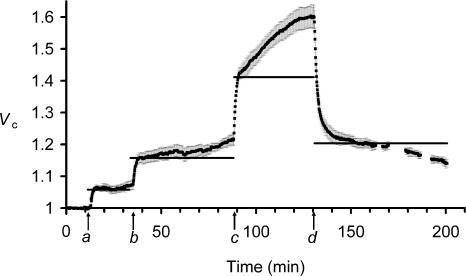
Figure 3 follows changes in Vc through a sequence of graded reductions in extracellular tonicity, followed by a final return of the fibres to standard isotonic Ringer solution. It illustrates a number of consistent features of the ΔVR+ and ΔVS+ phenomena. Fibres swelled rapidly on the introduction of 216 mosmol l−1 Ringer solution (a) to reach Vc values of 1.06 ± 0.01 (n= 4 fibres) 5 min after the solution change, consistent with the simple osmotic prediction, Vp (horizontal bar). The subsequent ΔVS+ changes increased Vc non-significantly (P > 0.05) to 1.07 ± 0.02 (n= 4) over the next 20 min. However, the subsequent larger tonicity changes elicited progressively greater ΔVS+ components. Thus, the transition from 216 to 200 mosmol l−1 Ringer solution (b) resulted in an initial ΔVR+ that similarly matched osmotic expectations 5 min after the solution change. However, this was followed by a larger ΔVS+ transient from 1.15 ± 0.02 at 5 min to 1.21 ± 0.02 (P < 0.05) prior to the next solution change 50 min later, a rate of volume increase of 0.11 ± 0.05% min−1. In contrast, during the ΔVS+ following transfer to 171 mosmol l−1 Ringer solution (c) Vc increased from 1.43 ± 0.02 to 1.60 ± 0.04 (P < 0.01) in 40 min, a mean volume increase of 0.4 ± 0.1% min−1 that was significantly (P < 0.05) greater and more rapid than the increase that resulted from the transfer from 216 to 200 mosmol l−1 Ringer solution.
Figure 3. The influence of successive step changes in extracellular tonicity upon muscle fibre volume.
Filled squares denote mean normalized volumes, Vc (±s.e.m., n= 4 fibres except between 75 and 135 min, when n= 3 as cell swelling reduced the number of fibres that could be visualized in each frame). The horizontal bars denote predicted volumes, Vp, after each step change in osmolarity, taking into account the actual normalized volumes, Vc, recorded immediately before each such change (see Methods). Initial extracellular osmolarity was 227 mosmol l−1, and this was reduced in steps to 216 mosmol l−1 (a), 200 mosmol l−1 (b) and 171 mosmol l−1 (c). Finally, the bathing solution was replaced with standard 227 mosmol l−1 Ringer solution once more (d). Note that fibres remained residually swollen on return to standard Ringer solution (from d), but then showed gradual volume recovery, in contrast to the ΔVS+ seen in similarly swollen fibres (from b) in hypotonic solutions.
The successive sequence of ΔVR+ followed by ΔVS+ transients through each solution change finally resulted in an overall increase in Vc that significantly exceeded the simple osmotic expectations. Thus, the fibres in 171 mosmol l−1 Ringer solution eventually reached mean normalized volumes of 1.601 ± 0.037, against a Vp of 1.327 relative to the cell volume initially observed in 227 mosmol l−1 Ringer solution. The excess volume initially persisted on return to standard isotonic Ringer solution (d). Thus the return to isotonic 227 mosmol l−1 Ringer solution produced a rapid decrease in Vc to a value close to that predicted by assuming simple osmotic behaviour (Vp=Vc(a)× (θe(a)/θe(b)) = 1.601 × (171/227) = 1.206). However, this passive osmotic shrinkage thus left a ∼20% residual elevation of Vc compared to its original value in standard Ringer solution that reflected the preceding, cumulative ΔVS+ changes. This contrasted with the previously reported complete volume recovery in fibres returned to isotonic solutions following a sequential increase in extracellular tonicity (Ferenczi et al. 2004).
The adjustments in Vc that then followed were consistent with the ΔVS+ being the consequence of an increased Vc under hypotonic, but not isotonic conditions. Thus, Fig. 3 indicates that fibres with similar Vc values showed contrasting slow volume transients, the directions of which depended on whether they were bathed in hypotonic Ringer solution (b) or demonstrated the residual swelling (d) that followed the exposures to extracellular hypotonicity. In the former case (b) fibres demonstrated the slow increase in volume, ΔVS+, whereas in the latter case (d) there was a gradual recovery in volume to a significantly reduced Vc of 1.139 ± 0.013 (P < 0.01, n= 4) at the end of the experimental period. The ΔVS+ volume transients are thus not intrinsic consequences of increases in Vc above their resting values. Nor could the ΔVS+ phenomenon be attributed to the reduction in the extracellular NaCl concentration ([NaCl]e); fibre volumes were not significantly altered by a 3 h exposure to isotonic, low [NaCl]e solutions (normalized Vc=−0.002 ± 0.003, n= 8 fibres, 2 muscles after 3 h exposure) whose ionic composition equalled that of the 171 mosmol l−1 hypotonic Ringer solution used in Figs 1 and 3 (85 mm NaCl) but additionally contained sufficient sucrose to preserve normal tonicity (227 mosmol l−1).
ΔVS+ persists under conditions of Cl− deprivation
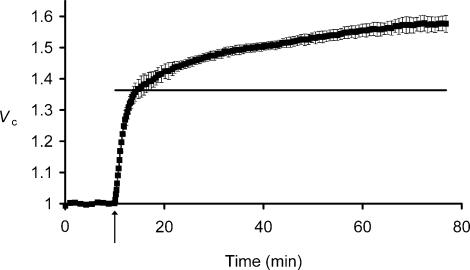
Many cell types exhibit regulatory volume increase (RVI) or decrease (RVD) phenomena (Lang et al. 1998a,b; O'Neill, 1999) that result from cation−Cl− cotransporter activity mediated by the Na+–K+–2Cl− cotransporter (NKCC; Russell, 2000) or K+–Cl− cotransport (KCC; Lauf & Adragna, 2000), both of which have been identified in skeletal muscle (Hiki et al. 1999; Wong et al. 1999). Furthermore, many cell types increase their membrane Cl− permeabilities in response to swelling (Nilius et al. 1996; Okada et al. 2001). Experiments that exposed muscle fibres to hypotonic solutions in Cl−-free environments further excluded such a potential role of Cl−-dependent processes in these ΔVS+ changes. Thus, Fig. 4 follows the mean relative volumes of a group of fibres that were exposed to hypotonic Cl−-free Ringer solution. The volume changes were similar to those in Cl−-containing Ringer solutions (Fig. 1) in that fibres showed an initial ΔVR+ until Vc approximated Vp (horizontal bar) ∼5 min after the solution change. This was followed by a ΔVS+ that gradually increased Vc (at a rate of ∼0.2% min−1) to 1.577 ± 0.025 after a 60 min exposure, significantly exceeding the simple osmotic expectations (Vp= 1.36). ΔVS+ thus persisted under conditions in which membrane-permeant anions were absent from the extracellular medium.
Figure 4. The influence of extracellular hypotonicity upon muscle fibre volume under conditions of Cl− deprivation.
Filled squares denote mean relative volumes, Vc (±s.e.m., n= 4 fibres), of a group of muscle fibres, initially equilibrated with isotonic Cl−-free SO4 2− Ringer solution (225 mosmol l−1), then transferred (arrow) to hypotonic Cl−-free Ringer solution (168 mOsm l−1). Where the s.e.m. is not shown, it is smaller than the data point. The horizontal bar shows the relative volume, Vp, predicted by assuming simple osmotic behaviour. After rapidly swelling to this predicted volume (ΔVR+), the fibres continued to swell gradually over the course of the next 1 h (ΔVS+).
ΔVS+ is followed by a delayed slow volume decrease, ΔVS−
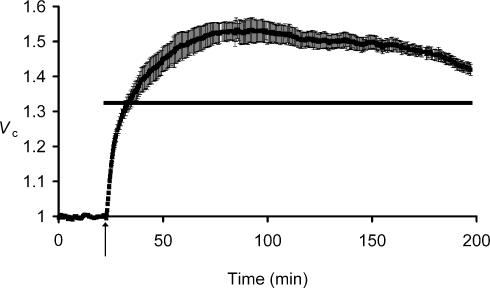
The ΔVS+ phenomenon was further investigated in fibres exposed to hypotonic solutions for longer periods. This revealed that the ΔVS+ transients were followed after ∼60–70 min by a slow volume decrease, ΔVS−. Figure 5 shows typical fibre volumes following ∼3 h exposures to hypotonic Cl−-containing Ringer solutions, demonstrating a slow and sustained volume decrease, ΔVS−, beginning after the ΔVS+ transient.
Figure 5. Cell volume eventually reaches a maximum during long exposures to extracellular hypotonicity and then declines.
Muscle fibres were exposed to hypotonic Cl−-containing Ringer solution (arrow) for almost 3 h. Mean fibre volumes (±s.e.m., n= 5 fibres) are shown over this period, compared to the volume predicted by assuming simple osmotic behaviour (Vp, horizontal bar). Cell volume rapidly increased to close to this predicted value (ΔVR+), and this was followed by a slower volume increase, ΔVS+, to a maximum Vc of 1.53 ± 0.03, against the prediction of 1.32. However, fibres then showed a much slower volume reduction, ΔVS−, lasting for the remainder of the experimental period. Thus, Vc eventually reduced to 1.42 ± 0.02 at 200 min, significantly lower than the previous maximum (P < 0.05).
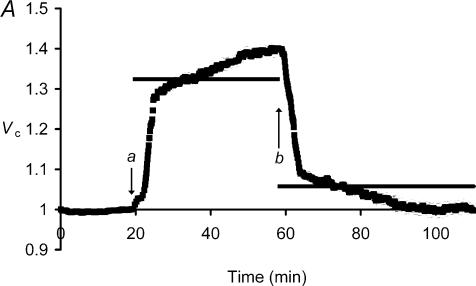
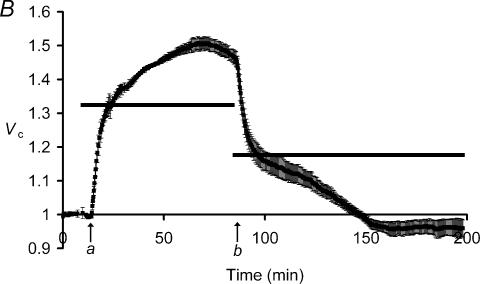
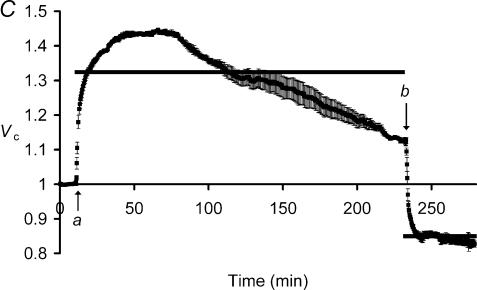
Figure 6 shows the mean normalized Vc of fibres in three muscles that were initially equilibrated with Cl−-free isotonic SO4 2− Ringer solution and then exposed to hypotonic Cl−-free SO4 2− Ringer solutions (a) for different periods before being returned to isotonic Cl−-free SO4 2− Ringer solution (b). The slow Vc decrease, ΔVS−, persisted with accelerated kinetics under conditions of Cl− deprivation. These increased rates of ΔVS+ and ΔVS− in Cl−-free compared to Cl−-containing solutions made it possible to demonstrate several additional features of these slow volume transients within the ∼3–4 h period over which measurements of Vc in viable muscle fibres were possible, as follows.
Figure 6. The influence of long exposures to hypotonic solutions under Cl−-free conditions.
Three muscles (A, B and C) were equilibrated with isotonic (225 mosmol l−1) Cl−-free SO4 2− Ringer solution, exposed to hypotonic (170 mosmol l−1) Cl−-free Ringer solution (a) for different durations and finally returned to isotonic Cl−-free Ringer solution (b). Data points show mean relative volume, Vc (±s.e.m., n≥ 4 fibres in each case). Horizontal bars denote predicted cell volume, Vp, after each solution change.
(1) In each case in Fig. 6 the exposure to hypotonicity (a) elicited an initial rapid volume increase, ΔVR+, increasing Vc to values close to Vp (horizontal bar), as expected from a simple osmotic hypothesis. (2) A slow volume increase, ΔVS+, that was nevertheless more rapid than its counterpart in Cl−-containing solutions then followed, increasing Vc to significantly above Vp (P < 0.01). (3) Exposures to extracellular hypotonicity of >1 h (Fig. 6B and C) then permitted an abrupt onset of a slow volume decrease, ΔVS−, after ∼60–70 min, in common with the situation in the corresponding Cl−-containing solutions (Fig. 5). (4) This persisted at a constant rate that was faster than the ΔVS− observed in Cl−-containing solutions (0.2% min−1 in Cl−-free versus 0.1% min−1 in Cl−-containing solutions) for at least 150 min (Fig. 6C). (5) The ΔVS− process could eventually reduce Vc to significantly less than Vp (P < 0.01) for the prevailing extracellular tonicity (Fig. 6C), as opposed to simply reversing the preceding ΔVS+ process.
Figure 6 also demonstrates the effects of (b) returning fibres to isotonic Cl−-free Ringer solution after long exposures to hypotonic Cl−-free Ringer solution, as follows. (1) In each case, the restoration to isotonic Ringer solution resulted in a rapid initial decrease in Vc, the magnitude of which matched the preceding ΔVR+ and accordingly followed osmotic predictions (Vp, horizontal bar) that took into account the actual Vc immediately before the solution change. However, (2) Vc was then left with a residual difference from its baseline value, reflecting the volume changes attributable to the slow volume transients (ΔVS++ΔVS−), corrected for the relative extracellular tonicities (θe(hypo)/θe(iso)). Thus, the shift in Vc from baseline values was close to (ΔVS++ΔVS−) × (θe(hypo)/θe(iso)) in each case. (3) The initial passive, rapid decrease in Vc was then followed (Fig. 6A and B) by a much slower volume decrease that eventually equalled the magnitude of the ΔVS+, corrected for the change in extracellular tonicity (thus, ΔVS+× (θe(hypo)/θe(iso))). It was not possible to demonstrate this correction for very long exposures to hypotonicity; although a downward trend was observed (Fig. 6C), it was non-significant (P > 0.05) at the limits of viability of the preparation. (4) In contrast to this apparent eventual correction of the volume gain during ΔVS+, any volume loss attributable to a previous ΔVS− persisted (Fig. 6B and C). Thus, fibres that showed a significant ΔVS− remained residually shrunken on return to isotonic Cl−-free Ringer solution such that final Vc was significantly reduced from its initial baseline value (P < 0.01).
Resting membrane potentials, Em, during the volume changes
Adrian (1956) pointed out that osmotically induced changes in Vc would correspondingly concentrate or dilute any conserved intracellular ions and thereby potentially alter the resting membrane potential, Em. For example, increases in [K+]i/[K+]e resulting from osmotically induced reductions in Vc hyperpolarize the K+ Nernst potential, EK, and produce a corresponding shift in Em in fibres studied in Cl−-free hypertonic solutions (Adrian, 1956; Hodgkin & Horowicz, 1959). Such a relationship permits the influence of Vc upon Em to be predicted following a change in extracellular osmolarity. Thus, if the subscripts (iso) and (hypo) denote isotonic and hypotonic extracellular solutions, respectively, while the symbol θ denotes osmolarity:
if
| (2) |
then
| (3) |
and so
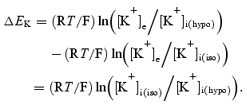 |
(4) |
Then, if
| (5) |
| (6) |
Equation (6) contains four implicit assumptions: (1) intracellular K+ content is conserved during changes in Vc; (2) Vc follows simple osmotic predictions (see Methods) over the range of extracellular osmolarities considered here; (3) Cl− is passively distributed; and (4) membrane Na+ permeability is low relative to that of K+. Any deviation of measured Em from these predictions might then reveal evidence of Em or Vc regulation.
The following control experiments therefore first confirmed that these assumptions were reasonable under steady-state conditions in isotonic solutions. First, Em was measured in fibres exposed to Ringer solutions in which sucrose partly but isosmotically replaced NaCl. This separated the effects upon Em of the reduced tonicity of hypotonic solutions from the effects of their reduced [NaCl]e and thus paralleled the investigation of Vc in solutions with similar isosmotic replacements of extracellular NaCl described above. Reductions in [NaCl]e from 120 to 85 mm then yielded no significant differences (P≫ 0.05 on Student's unpaired t test) between Em values as recorded over a 30 min period in standard isotonic Ringer solution (−90.4 ± 1.2 mV, n= 13) and those obtained over 10 min periods immediately following (−90.1 ± 1.2 mV, n= 9) and ∼60 min after the solution change (−89.3 ± 0.8 mV, n= 34), respectively. Similar results were obtained after solution changes to 45 mm NaCl Ringer solution (−92.2 ± 1.3 mV, n= 16 immediately following and −90.8 ± 1.0 mV, n= 12 at ∼60 min; P > 0.05).
The second set of control experiments assessed the validity of assumption (3) above. Although early reports had suggested that Cl− is in electrochemical equilibrium across the membrane of resting skeletal muscle in isotonic solutions (Adrian, 1956; Hodgkin & Horowicz, 1959), more recent reports had suggested that Em in both mouse skeletal muscle in isotonic solutions and amphibian fibres in hypertonic solutions is slightly depolarized relative to EK owing to a combination of an elevated [Cl−]i/[Cl−]e due to cation−Cl− transporter activity and a high ratio of Cl− to K+ permeability, PCl/PK (Geukes Foppen et al. 2002; Ferenczi et al. 2004). The experiments accordingly examined Em in fibres in isotonic solutions under conditions of Cl− depletion, which would abolish any such cation−Cl− cotransport. Similar values of mean Em were obtained from fibres during an initial 30 min period in standard Ringer solution (−89.5 ± 1.3 mV, n= 16 fibres, 2 muscles) between 20 and 40 min (−92.3 ± 0.9 mV, n= 16 fibres, 2 muscles) and between 41 and 60 min after gradual equilibration with Cl−-free Ringer solution (−91.3 ± 0.5 mV, n= 24 fibres, 2 muscles). Therefore Cl− deprivation did not significantly affect values of Em under isotonic conditions (P > 0.05 in each case on Student's unpaired two-tailed t test versus values in standard Ringer solution).
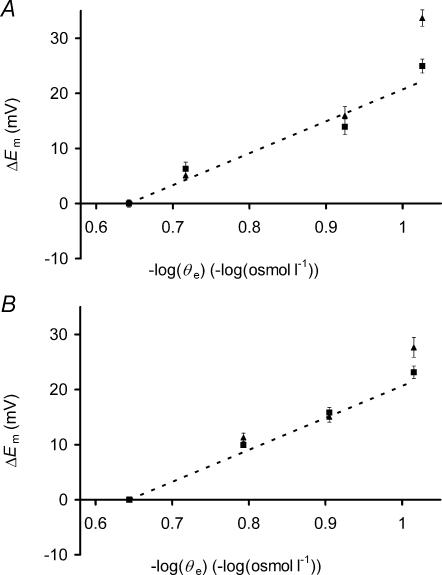
Figure 7A then compares the influence of exposures to extracellular hypotonicity upon Em with the corresponding predicted values of Em (eqn (6)) over a wide range of tonicities, including those under which the Vc changes were examined. The muscle fibres were transferred from standard Cl−-containing Ringer solution to a hypotonic Cl−-containing Ringer solution and Em was measured soon after the solution change, to record Em changes due to ΔVR+, and after 60 min, to record any additional changes due to ΔVS+. Progressive reductions in tonicity produced increasing depolarizations of the Em measured between 5 and 15 min compared to values in isotonic Ringer solution (P≪ 0.01 in each case) that were close to predicted values of ΔEm (dashed line) calculated from eqn (6) above. At tonicities of 192 and 119 mosmol l−1, Em remained stable after this initial depolarization. Only at the lowest tonicity (94 mosmol l−1) was there any significant depolarization (P < 0.01) between the early and late measurement periods, possibly reflecting the reduced fibre survival, loss of normal striations and inability to return to basal conditions that may follow such extreme reductions in extracellular tonicity (Paris et al. 1965). Even longer exposures to 171 mosmol l−1 solutions gave an Em of −87.1 ± 1.06 mV between 170 and 190 min (P > 0.05 against earlier time bins), demonstrating continued Em stability despite the ΔVS− phenomenon. Figure 7B confirms similar relationships between extracellular tonicity and Em under Cl−-free conditions; decreases in extracellular tonicity depolarized Em as predicted by eqn (6) above (dashed line), giving stable ΔEm values. Very long exposures to 164 mosmol l−1 solutions gave Em of −82.1 ± 1.06 mV between 170 and 190 min (P > 0.05 against earlier time bins), similarly demonstrating continued Em stability despite the marked ΔVS− transient observed under similar conditions of Cl− deprivation.
Figure 7. The influence of reduced extracellular tonicity upon Em .
The change in Em (ΔEm) compared to resting Em in isotonic Ringer solutions is plotted against −log(extracellular osmolarity) (−log(osmol l−1)) for muscle fibres exposed to hypotonic Ringer solutions in Cl−-containing (A) or Cl−-free solutions (B). In each case, mean ΔEm (±s.e.m., n≥ 50 fibres from ≥2 muscles in each case) is shown soon (5–15 min) after the solution change (▪) and after a much longer (50–70 min) exposure period (▴). Where the s.e.m. is not shown, it is smaller than the data point. ΔEm closely followed predictions assuming conservation of [K+]i and simple osmotic behaviour (dashed line), and except at the very lowest tonicity (96 mosmol l−1) remained stable following the initial depolarization despite the ΔVS+ process that occurs over this period. Cl− deprivation did not influence the relationship between extracellular osmolarity and ΔEm.
Thus, with the exception of long exposures to the lowest tonicity used here, the results showed that ΔEm following the application of hypotonic solutions conformed to predictions that assumed perfect osmotic behaviour, conservation of intracellular K+ and dependence of Em upon EK. Furthermore, the subsequent slow volume transients produced no additional detectable ΔEm in either Cl−-free or Cl−-containing Ringer solutions.
Mathematical modelling of the relationship between Em and Vc during ΔVS+ and ΔVS−
Skeletal muscle fibres exposed to hypotonic solutions thus showed: (1) slow volume transients, which followed an initial passive osmotic change (ΔVR+), that first increased (ΔVS+) and then decreased cell volume (ΔVS−); and (2) accompanying alterations in Em that simply reflected a K+ Nernst equation in which osmotically induced increases in Vc directly altered [K+]i/[K+]e, in contrast to the stable values of Em observed in hypertonic solutions (Ferenczi et al. 2004). Both (1) and (2) persisted in Cl−-free solutions, which contain an insignificant concentration of membrane-permeable anions. This associated them with alterations in the intracellular membrane-impermeant solute (Xi) content, its osmotic activity, or its mean charge valency (zX), rather than Cl−-dependent transport processes (Fraser & Huang, 2004). However, the relationships between intracellular impermeant anion content (Xi), its mean charge valency per osmole (zX), Vc and Em are potentially complex. On the one hand, an efflux of charged X could alter its intracellular content, Xi, whilst preserving zX. On the other hand, the total intracellular charge carried by Xi would be unchanged following a flux of uncharged X or changes in the osmotic activity of X, and so such alterations in Xi would necessarily alter zX and in turn influence Em (Fraser & Huang, 2004). Nevertheless, it proved possible to model the effects of exposure of skeletal muscle to extracellular hypotonicity using the charge difference method of Fraser & Huang (2004) modified (see Appendix), to permit explicit modelling of changes in extracellular osmolarity.
Such modelling first assumed that the total charge carried by Xi was conserved within the cell unless there was a transmembrane flux of X. Secondly, [X]e was set to zero, as in the experimental solutions, and so no net inward fluxes of X were possible. Instead, Xi could be increased by simulating either an increase in its osmotic activity or cleavage of larger molecules. In this case, the total charge carried by Xi was conserved by keeping the product Vc×[X]i×zX constant by altering zX in inverse proportion to any change in [X]i×Vc. In contrast, decreases in total Xi content were modelled either by a similar charge-conserving mechanism or by the introduction of a small permeability term to X, permitting efflux of X and thus reducing the product Vc×[X]i×zX whilst preserving zX.
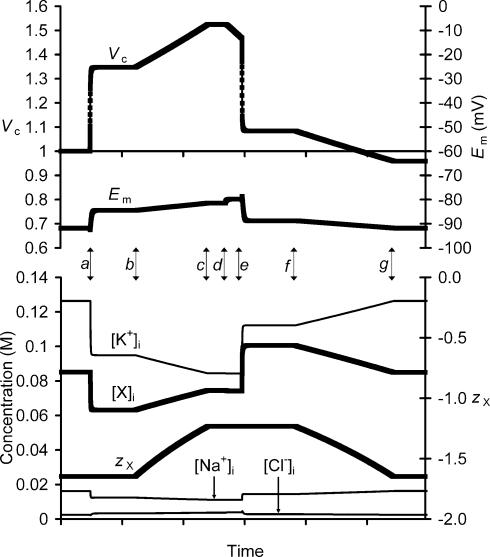
The model first demonstrated that an increase in Xi could result in a volume increase of comparable magnitude to ΔVS+ without significant alteration of Em, despite the resultant decrease in zX. The simulation was started with extracellular solute concentrations similar to that of the isotonic low-[NaCl] Ringer solution, semiarbitrary intracellular concentrations, and with all other parameters, such as Na+–K+–ATPase density and ion permeabilities, as described by Fraser & Huang (2004) until all variables settled to stable values, at which point Vc was assigned a value of 1. Figure 8 illustrates results from the subsequent period of modelling, beginning with isotonic extracellular conditions. At point a extracellular tonicity was reduced and the system permitted to re-equilibrate. This reproduced the experimental findings of a rapid volume increase (ΔVR+) and accompanying depolarization of Em. However, also note a rapid and small initial hyperpolarization on exposure to hypotonicity attributable to a transient Cl− influx secondary to the initial dilution of [Cl−]i.
Figure 8. Charge difference modelling of an exposure to hypotonicity.
The charge difference method of Fraser & Huang (2004) was used to model intracellular events in amphibian skeletal muscle during exposure to hypotonicity. Thus, following equilibration with isotonic (230 mosmol l−1) Ringer solution, extracellular tonicity was reduced to 172 mosmol l−1 (a) and the model permitted to stabilize. ΔVS+ was then modelled by gradually increasing Xi content (b) whilst proportionally reducing the magnitude of zX to maintain a constant product Vc×[X]i×zX, as described in the text, until point c, where the model was once again permitted to stabilize. At point dΔVS− was modelled by the introduction of a small permeability term to X−, permitting X− efflux and thus a reduction in total intracellular charge, with conservation of zX. At point e this efflux was stopped and extracellular isotonicity restored. At point f the process introduced at point b was reversed. These changes were stopped at point g, when [X]i and zX had reached their initial baseline values, allowing full recovery of Em, [K+]i, [Na+]i, [Cl−]i and [X]i, but a net reduction in Vc.
At point b a gradual increase in cellular Xi content was modelled at a constant rate, following the assumptions above. The increase in Xi caused a gradual increase in Vc, while the accompanying decrease in zX resulted in a small depolarization of Em. Note that an increase in cellular Xi content alone, without any change in zX, would be expected to change Vc such that [X]i remained constant (Fraser & Huang, 2004). However, in this case the simultaneous reduction in the magnitude of zX effectively dampens the Vc increase caused by increasing Xi content, permitting [X]i to increase. However, during a ΔVS+ of similar magnitude to that demonstrated in Fig. 6B (Vc from 1.34 to 1.52), Em depolarized by only 2.9 mV, which is too close to the standard errors of the Em measurements to have been detected in the present study, and is thus compatible with the experimental data. The increase in Xi content was then stopped at point c.
At point d an efflux of X was modelled by assigning a small permeability term to Xi such that the permeability ratio PX:PK was 0.0001. This resulted in a volume decrease analogous to ΔVS−, accompanied by a small depolarization, as would be expected for any process that increased overall anion efflux, but which was too small to be detected in the present study. However, Em stabilized at this slightly depolarized value, permitting the efflux of Xi to reduce Vc indefinitely, without further perturbation of Em or any intracellular ion concentrations (Fraser & Huang, 2004).
However, the efflux was stopped at point e after a ΔVS− of similar magnitude to that demonstrated in Fig. 6B, and the extracellular conditions returned to those at the start of the modelling period. This increase in extracellular osmolarity resulted in a rapid Vc decrease. Vc then stabilized above its baseline value, due to the net increase in the total osmotic activity of Xi that took place during the ΔVS+ and ΔVS− processes. However, Em remained slightly depolarized (∼3 mV) compared to baseline values due to the reduction in zX and concomitant decrease in [K+]i.
Finally, at point f Xi content was gradually reduced in a reversal of the process started at point c, thus returning zX to its baseline value over the same period. This process was continued until both zX and [X]i reached their respective baseline values (g), at which point Vc was decreased from its original value, due to the loss of Xi content during the ΔVS− process between points d and e. In contrast, Em, [K+]i, [Na+]i, [Cl−]i and [X]i were restored precisely to their original values.
A possible alternative mechanism for ΔVS− was also modelled, in which the total intracellular charge carried by X (Vc×[X]i×zX) was conserved, as opposed to the net loss of charge during the ΔVS− phase shown in Fig. 8. However, this did not permit reconstruction of the experimental results shown in Fig. 6C, where ΔVS− reduced Vc from its maximum value to 1.15. A volume decrease of this magnitude with conservation of intracellular charge was shown to require approximately a doubling of zX, as the increase in cellular cation content resulting from the increase in zX magnitude would oppose the volume decrease caused by decreasing Xi content and additionally permit a significant increase in [K+]i, causing a hyperpolarization of ∼6 mV. Such a hyperpolarization was not detected (Fig. 7A and B). Further decreases in Vc from this value were shown to imply increasingly unrealistic values of zX, with a further doubling required to decrease Vc to 1, contrasting strongly with the indefinite Vc decreases possible with a simple efflux of X, which do not further perturb Em (Fraser & Huang, 2004).
Discussion
This study explored the relationship between increases in cell volume (Vc) and the resulting alterations in resting membrane potential (Em) in amphibian skeletal muscle fibres during extended (3–4 h) exposures to extracellular solutions of reduced tonicity. Vc was measured in cutaneous pectoris muscles using confocal microscope scanning in the xz plane (Ferenczi et al. 2004), and Em was measured in sartorius muscles using conventional microelectrodes (Adrian, 1956).
The experiments first confirmed that exposure of skeletal muscle fibres to hypotonic solutions elicited a rapid (>5% min−1) volume increase, ΔVR+, that closely followed simple osmotic predictions as previously reported (Dydynska & Wilkie, 1963; Blinks, 1965). However, this swelling was followed by slower volume transients, not observed on earlier occasions, which may represent cellular volume regulatory phenomena. Their detection in the present study is likely to reflect the long exposure times used here (cf. Blinks, 1965) and the increased accuracy afforded by assessment of Vc using confocal xz-plane scanning rather than measurements of fibre diameter (cf. Reuber et al. 1963).
The slow volume transients showed two distinct phases. First, an initial slow (<0.5% min−1) volume increase, ΔVS+, immediately followed ΔVR+ and lasted approximately 50–60 min. ΔVS+ produced increases in Vc to final values ∼10–15% greater than osmotic predictions, and was therefore suggestive of increases in total intracellular osmotic activity. It occurred in solutions of even slightly reduced relative tonicity (relative tonicity = 0.88). ΔVS+ took place at a rate that gradually decreased until a maximum Vc was reached after approximately 50–60 min, contrasting sharply with the 2–5 min time courses of the passive ΔVR+ volume changes and the passive volume changes previously reported in response to increases in extracellular tonicity (Ferenczi et al. 2004).
Second, a slow (<0.5% min−1) volume decrease, ΔVS−, then began quite abruptly ∼60–70 min after the ΔVR+. It was not possible to assess the maximum duration of the ΔVS− phase because it continued beyond the limits of tissue viability in the isolated tissue preparation used here. However, it was observed to continue for at least 3 h, over which time the volume decrease could exceed the magnitude of the preceding ΔVS+; fibre volumes then eventually decreased below the predicted values for the prevailing extracellular tonicity. This suggested that the ΔVS− process did not simply represent a reversal of the preceding ΔVS+ process.
Both the ΔVS+ and ΔVS− phenomena persisted, and indeed assumed more rapid kinetics, under conditions of Cl− deprivation. These features exclude possible mechanisms involving cation−Cl− cotransport systems or other Cl−-dependent processes, instead suggesting that Cl− redistribution (Hodgkin & Horowicz, 1959) otherwise limited the rates of both ΔVS transients. Finally, fibres exposed to isotonic solutions with concentrations of NaCl that were reduced to levels identical to those of the hypotonic solutions used here showed stable volumes, suggesting that the slow volume transients were not a consequence of reduced extracellular ion concentrations.
Fibres that had been exposed to hypotonicity for various durations were then returned to the original isotonic solutions. This resulted in an initial cell shrinkage that was similar in magnitude and rate to the initial ΔVR+ and therefore compatible with passive osmotic behaviour. However, the overall Vc changes during ΔVS+ and ΔVS− were then reflected in a residual Vc deviation from its baseline value. This permitted the identification of a second difference between the ΔVS+ and ΔVS− processes. After the initial rapid osmotic volume decrease on transfer from hypotonic to isotonic Ringer solution, fibres then showed a gradual volume decrease that was eventually equal in magnitude to the preceding ΔVS+, allowing for the change in extracellular tonicity, at which point cell volumes stabilized. Cell volumes therefore returned precisely to their original resting values if the duration of exposure to hypotonic Ringer solution was insufficient to permit ΔVS− to occur, demonstrating the full reversibility of ΔVS+. However, if the exposures to hypotonicity were of sufficient duration to permit ΔVS− the subsequent return to isotonic conditions continued to elicit a complete reversal of the ΔVS+ process. This left final stable volumes that were less than the initial baseline volumes, suggesting that ΔVS− produced a sustained loss of intracellular solute. Fibres that had undergone a period of ΔVS+ and were then returned to isotonic Ringer solution additionally demonstrated that ΔVS+ did not result from the fibre swelling per se. Thus, while swollen fibres in hypertonic Ringer solution demonstrated the ΔVS+ phenomenon, fibres residually swollen to similar extents on return to isotonic Ringer solution due to a preceding ΔVS+ phase instead showed volume recovery.
However, despite these slow volume transients, the changes in membrane potential (ΔEm) during these exposures to hypotonic solutions remained close to predictions that assumed simple osmotic behaviour, conservation of intracellular K+, and a dependence of Em upon EK. Thus, exposures to hypotonic solutions with a range of relative tonicities from 0.75 to 0.42 caused rapid depolarizations compatible with a directly proportional reduction in the ratio [K+]i/[K+]e. Similar depolarizations were observed in Cl−-containing and Cl−-free solutions, thereby excluding any cation−Cl− cotransport-dependent stabilization of Em, in contrast to the Em stabilization reported in osmotically shrunken fibres (Ferenczi et al. 2004). Return to isotonic Ringer solution then permitted full recovery of Em to its resting value.
The present findings thus sharply contrast with the splinting of Em but a relatively simple dependence of Vc upon extracellular osmolarity in fibres studied in hypertonic solutions (Ferenczi et al. 2004). Nevertheless, they proved similarly amenable to a recent, charge-difference approach to quantitative modelling (Fraser & Huang, 2004) that invoked osmotic activity in charged intracellular impermeant anions and their possible transmembrane fluxes rather than the Cl−-dependent transport processes that had successfully accounted for the earlier observations in hypertonic solutions. Thus, such modelling suggested that the ΔVS+ that immediately followed the hypotonic volume expansion, ΔVR+, without detectable further depolarization of Em could reflect a reversible increase in osmotic activity in normally membrane-impermeant intracellular anions (Xi), whilst conserving the total intracellular charge carried by Xi (=Vc×[X]i×zX) through a proportional decrease in zX. While such reductions in the magnitude of zX would reduce the maximum polarization of Em, the predicted depolarization was too small (<2–3 mV) for detection in the present study. ΔVS+ may thus simply represent an unavoidable, even if inappropriate, consequence of the dilution of cellular contents, which might result in an increase in the osmotic pressure of Xi, for example due to the depolymerization of proteins (Lew & Bookchin, 1991), an alteration of cellular polymer water compartments (Bookchin et al. 1994), or a significant increase in the osmotic coefficient (φ) of Xi with dilution. However, it is also conceivable that ΔVS+ might represent a functional response to reduced Xi content that is inappropriately activated when Xi is diluted secondary to fibre swelling under hypotonic conditions. Under conditions of stable extracellular osmolarity, a reduction in [Xi] would tend to cause volume decrease (Fraser & Huang, 2004), rather than simply reflecting such a dilution of cellular contents, and therefore a mechanism analogous to ΔVS+ that could increase Xi content or osmotic activity towards normal might then be an appropriate corrective response.
However, modelling showed that a converse decrease in Xi and conservation of the product Vc×[X]i×zX was not compatible with the magnitude of ΔVS− observed experimentally, since such a mechanism would require an increase in the magnitude of zX to unreasonable values, thereby producing a significant hyperpolarization of Em, contrary to experimental observation. Rather, the delayed ΔVS− could be readily explained in terms of a simple efflux of Xi, thereby reducing the total intracellular charge carried by Xi but conserving zX and hence Em while reducing the product Vc×[X]i×zX. This, together with the observed delay prior to its initiation, would be compatible with ΔVS− representing an RVD phenomenon dependent on organic anion efflux that is activated by cell swelling, as has been described in other cell types (Lang et al. 1998a,b). Such a scheme is then compatible with the observed reversibility of ΔVS+ and apparent irreversibility of ΔVS−. If so, ΔVS− would represent, to the best of our knowledge, the first demonstration of RVD in mature skeletal muscle.
Acknowledgments
We thank Dr Christof J. Schwiening for providing us with image analysis software, and Paul Frost, Victoria Johnson and Jon Holdich for generous and skilled assistance. C.L.-H.H. thanks the Medical Research Council for project (G9900365 and G0100188) and Co-operative Group Grants (G9900182 and G01001986), and the Wellcome Trust Joint Research Equipment Initiative (JREI: 055203/Z/98/Z/ST/RC) for equipment funding support. C.L.-H.H. also thanks the Leverhulme Trust and the British Heart Foundation. J.A.F. holds a George Henry Lewes Studentship. J.A.U.-S. thanks Astra Zeneca and the James Baird Fund for support.
Appendix
The model of Fraser & Huang (2004) was modified in order to model the effects of step changes in extracellular osmolarity, θe. Previously, the model simply made the assumption that membrane water permeability greatly exceeded ion permeabilities, and therefore ion movements were assumed to be accompanied by sufficient water to maintain equal intracellular and extracellular osmolarities. However, in order to model step changes in extracellular osmolarity, it was necessary to model transmembrane water fluxes explicitly. Thus a permeability term was introduced for H2O (PH2O= 1.56 × 10⁻⁴ cm s−1: Frigeri et al. 2004) and transmembrane water movements were then modelled as for any other uncharged molecule. The equations described below replaced eqn (5) in Fraser & Huang (2004), and were calculated in the order that they are presented here.
The concentration of H2O in pure water was taken as 55.55 m, and the osmotic coefficient (φ) of each ion was assumed to be unity, such that solution osmolarities were numerically equal to the sum of their constituent ion concentrations. Therefore, the extracellular and intracellular H2O concentrations ([H2O]e and [H2O]i, respectively) were given by:
and
θe denotes total extracellular osmolarity, and was thus simply the sum of the concentrations of the extracellular ions. Thus, at the end of each iteration cycle, inward water flux, JH2O, was calculated:
Intracellular water was then assumed to occupy precisely the same volume per mole as in pure water, and so the change in cell volume, ΔVc, after each iteration was simply:
Preliminary simulations showed that the results described by Fraser & Huang (2004) could be precisely reconstituted. However, this change did influence the time course of Vc and Em changes following alterations in extracellular tonicity.
References
- Adrian RH. The effect of internal and external potassium concentration on the membrane potential of frog muscle. J Physiol. 1956;133:631–658. doi: 10.1113/jphysiol.1956.sp005615. [DOI] [PMC free article] [PubMed] [Google Scholar]
- Blinks JR. Influence of osmotic strength on crosssection and volume of isolated single muscle fibres. J Physiol. 1965;177:42–57. doi: 10.1113/jphysiol.1965.sp007574. [DOI] [PMC free article] [PubMed] [Google Scholar]
- Bookchin RM, Balazs T, Lew VL. Measurement of the hemoglobin concentration in deoxyhemoglobin S polymers and characterization of the polymer water compartment. J Mol Biol. 1994;244:100–109. doi: 10.1006/jmbi.1994.1707. [DOI] [PubMed] [Google Scholar]
- Chin DX, Fraser JA, Usher-Smith JA, Skepper JN, Huang CL-H. Detubulation abolishes membrane potential stabilization in amphibian skeletal muscle. J Muscle Res Cell Motil. 2004;25:379–387. doi: 10.1007/s10974-004-2767-8. [DOI] [PubMed] [Google Scholar]
- Dydynska M, Wilkie DR. The osmotic properties of striated muscle fibres in hypertonic solution. J Physiol. 1963;169:312–329. doi: 10.1113/jphysiol.1963.sp007258. [DOI] [PMC free article] [PubMed] [Google Scholar]
- Ferenczi EA, Fraser JA, Chawla S, Skepper JN, Schwiening CJ, Huang CL-H. Membrane potential stabilization in amphibian skeletal muscle fibres in hypertonic solutions. J Physiol. 2004;555:423–438. doi: 10.1113/jphysiol.2003.058545. [DOI] [PMC free article] [PubMed] [Google Scholar]
- Fraser JA, Huang CL-H. A quantitative analysis of cell volume and resting potential determination and regulation in excitable cells. J Physiol. 2004;559:459–478. doi: 10.1113/jphysiol.2004.065706. [DOI] [PMC free article] [PubMed] [Google Scholar]
- Frigeri A, Nicchia GP, Balena R, Nico B, Svelto M. Aquaporins in skeletal muscle: reassessment of the functional role of aquaporin-4. Faseb J. 2004;18:905–907. doi: 10.1096/fj.03-0987fje. [DOI] [PubMed] [Google Scholar]
- Gallagher FA, Huang CL-H. Osmotic ‘detubulation’ in frog muscle arises from a reversible vacuolation process. J Muscle Res Cell Motil. 1997;18:305–321. doi: 10.1023/a:1018670025321. [DOI] [PubMed] [Google Scholar]
- Geukes Foppen RJ, Van Mil HGJ, Van Heukelom JS. Effects of chloride transport on bistable behaviour of the membrane potential in mouse skeletal muscle. J Physiol. 2002;542:181–191. doi: 10.1113/jphysiol.2001.013298. [DOI] [PMC free article] [PubMed] [Google Scholar]
- Hiki K, D'Andrea RJ, Furze J, Crawford J, Woollatt E, Sutherland GR, et al. Cloning, characterization, and chromosomal location of a novel human K+–Cl− cotransporter. J Biol Chem. 1999;274:10661–10667. doi: 10.1074/jbc.274.15.10661. [DOI] [PubMed] [Google Scholar]
- Hodgkin AL, Horowicz P. The influence of potassium and chloride ions on the membrane potential of single muscle fibres. J Physiol. 1959;148:127–160. doi: 10.1113/jphysiol.1959.sp006278. [DOI] [PMC free article] [PubMed] [Google Scholar]
- Koutsis G, Philippides A, Huang CL-H. The afterdepolarization in Rana temporaria muscle fibres following osmotic shock. J Muscle Res Cell Motil. 1995;16:519–528. doi: 10.1007/BF00126436. [DOI] [PubMed] [Google Scholar]
- Lang F, Busch GL, Ritter M, Volkl H, Waldegger S, et al. Functional significance of cell volume regulatory mechanisms. Physiol Rev. 1998;78:247–306. doi: 10.1152/physrev.1998.78.1.247. [DOI] [PubMed] [Google Scholar]
- Lauf PK, Adragna NC. K-Cl cotransport: properties and molecular mechanism. Cell Physiol Biochem. 2000;10:341–354. doi: 10.1159/000016357. [DOI] [PubMed] [Google Scholar]
- Lew VL, Bookchin RM. Osmotic effects of protein polymerization: analysis of volume changes in sickle cell anemia red cells following deoxy-hemoglobin S polymerization. J Membr Biol. 1991;122:55–67. doi: 10.1007/BF01872739. [DOI] [PubMed] [Google Scholar]
- Martin CA, Petousi N, Chawla S, Hockaday AR, Burgess AJ, Fraser JA, et al. The effect of extracellular tonicity on the anatomy of triad complexes in amphibian skeletal muscle. J Muscle Res Cell Motil. 2003;24:407–415. doi: 10.1023/a:1027356410698. [DOI] [PubMed] [Google Scholar]
- Nilius B, Eggermont J, Voets T, Droogmans G. Volume-activated Cl− channels. General Pharmacol. 1996;27:1131–1140. doi: 10.1016/s0306-3623(96)00061-4. [DOI] [PubMed] [Google Scholar]
- Okada Y, Maeno E, Shimizu T, Dezaki K, Wang J, Morishima S. Receptor-mediated control of regulatory volume decrease (RVD) and apoptotic volume decrease (AVD) J Physiol. 2001;532:3–16. doi: 10.1111/j.1469-7793.2001.0003g.x. [DOI] [PMC free article] [PubMed] [Google Scholar]
- O'Neill WC. Physiological significance of volume-regulatory transporters. Am J Physiol. 1999;276:C995–C1011. doi: 10.1152/ajpcell.1999.276.5.C995. [DOI] [PubMed] [Google Scholar]
- Paris M, Montoreano R, Lew V. Osmotical behaviour of isolated muscle fibres. Acta Physiol Latino Am. 1965;15:38–43. [Google Scholar]
- Peachey LD. The sarcoplasmic reticulum and transverse tubules of the frog's sartorius. J Cell Biol. 1965;25(Pt 2):209–231. doi: 10.1083/jcb.25.3.209. [DOI] [PubMed] [Google Scholar]
- Reuber JP, Lopez E, Brandt PW, Grundfest H. Muscle: volume changes in isolated single fibers. Science. 1963;142:246–248. doi: 10.1126/science.142.3589.246. [DOI] [PubMed] [Google Scholar]
- Russell JM. Sodium-potassium-chloride cotransport. Physiol Rev. 2000;80:211–276. doi: 10.1152/physrev.2000.80.1.211. [DOI] [PubMed] [Google Scholar]
- Sejersted OM, Sjogaard G. Dynamics and consequences of potassium shifts in skeletal muscle and heart during exercise. Physiol Rev. 2000;80:1411–1481. doi: 10.1152/physrev.2000.80.4.1411. [DOI] [PubMed] [Google Scholar]
- Sjogaard G, Adams RP, Saltin B. Water and ion shifts in skeletal muscle of humans with intense dynamic knee extension. Am J Physiol. 1985;248:R190–R196. doi: 10.1152/ajpregu.1985.248.2.R190. [DOI] [PubMed] [Google Scholar]
- Weibel ER. Morphometry of the human lung: the state of the art after two decades. Bull Eur Physiopathol Respir. 1979;15:999–1013. [PubMed] [Google Scholar]
- Wong JA, Fu L, Schneider EG, Thomason DB. Molecular and functional evidence for Na+-K+-2Cl− cotransporter expression in rat skeletal muscle. Am J Physiol. 1999;277:R154–R161. doi: 10.1152/ajpregu.1999.277.1.R154. [DOI] [PubMed] [Google Scholar]


