

Abstract
Infrared imaging analysis of iliac crest biopsy specimens from patients with osteoporotic and multiple spontaneous fractures shows significant differences in the spatial variation of the nonreducible: reducible collagen cross-links at bone-forming trabecular surfaces compared with normal bone.
Introduction
Although the role of BMC and bone mineral quality in determining fracture risk has been extensively studied, considerably less attention has been paid to the quality of collagen in fragile bone.
Materials and Methods
In this study, the technique of Fourier transform infrared imaging (FTIRI) was used to determine the ratio of nonreducible:reducible cross-links, in 2- to 4-μm-thick sections, from human iliac crest biopsy specimens (N = 27) at bone-forming trabecular surfaces. The biopsy specimens were obtained from patients that had been diagnosed as high- or low-turnover osteoporosis, as well as premenopausal women <40 years of age, with normal BMD and biochemistry, who suffered multiple spontaneous fractures. The obtained values were compared with previously published analyses of trabecular bone from normal non-osteoporotic subjects (N = 14, 6 males and 8 females; age range, 51–70 years).
Results and Conclusions
Collagen cross-links distribution within the first 50 μm at forming trabecular surfaces in patients with fragile bone was markedly different compared with normal bone.
Keywords: osteoporosis, bone fragility, bone formation, infrared imaging, collagen cross-links
INTRODUCTION
Loss of bone mass, measured clinically as change in BMD, is considered an important risk factor for osteoporotic fractures. However, BMD is not the sole predictor of whether an individual will experience a fracture,(1,2) and there is considerable overlap in BMD between populations that do and do not develop fractures.(3–5) In addition to BMD, factors such as geometry and bone mass distribution, trabecular bone microarchitecture, microdamage, increased remodeling activity, genetics, body size, environmental factors, and changes in bone mineral and matrix tissue properties(4) also influence fracture risk.
There have been several suggestions that the composition of bone collagen is altered in osteoporotic tissues.(6–14) Among the distinct features of bone (type I) collagen is its cross-linking chemistry and its molecular packing structure.(15) Intermolecular cross-linking provides the fibrillar collagen matrices with properties such as tensile strength and viscoelasticity. The major cross-links found in type I collagen are dehydro-dihydroxylysinonorleucine (deH-DHLNL), dehydro-hydroxylysinonorleucine (deH-HLNL), dehydro-histidinohydroxymerodesmosine (deH-HHMD), pyridinoline (Pyr), deoxypyridinoline (lysyl analog of Pyr, d-Pyr), histidinohydroxylysinonorleucine (HHL), and pyr-role. Of these seven major cross-links, the first three (deH-DHLNL, deH-HLNL, deH-HHMD) are reducible with sodium borohydride, whereas the others are nonreducible.(15) For the purposes of this report, reducible cross-links include deH-DHLNL and deH-HLNL, whereas nonreducible cross-links include Pyr and d-Pyr and are referred to as pyridinium cross-links.
In a series of recent reports,(16–18) we described the spatial variation of the nonreducible pyridinium/reducible collagen cross-link ratio in trabecular bone surfaces obtained from iliac crest biopsy specimens from normal humans as a function of surface activity (forming versus resorbing).(18) In this report, Fourier transform infrared imaging analysis (FTIRI) was used to examine the spatial variation of the pyridinium/reducible collagen cross-link ratio at bone-forming trabecular surfaces in bone biopsy specimens obtained from patients with osteoporosis. Three groups of patients were examined: postmenopausal women and men with high turnover osteoporosis and low turnover osteoporosis, as well as otherwise normal premenopausal women who had sustained spontaneous low-trauma fractures. The results show that all three groups of fracturing subjects exhibit a higher ratio of nonreducible pyridinium/reducible collagen cross-link than normal and suggest that abnormal bone collagen quality may contribute to bone fragility.
MATERIALS AND METHODS
Materials
Iliac crest biopsy specimens from 27 osteoporotic patients were subjected to FTIRI analysis. The diagnosis of osteoporosis was based on cancellous bone volume <15%. Moreover, they had all sustained at least one osteoporotic fracture. They were further discriminated into high-turnover (HTOP; N = 9, all female; age range, 46–57 years) and low-turnover (LTOP; N = 9, 3 male and 6 female; age range, 52–77 years) osteoporosis patients based on histological and histomorphometric evaluation of percentage of osteoblast surface normalized for total bone surface (Ob.S/BS). The range of values was 2.62–4.17 in the LTOP groups and 5.39–9.77 in the HTOP group. Subjects with underlying secondary causes of osteoporosis, such as rheumatoid arthritis or glucocorticoid excess, were excluded from the study.
In addition, biopsy specimens from nine premenopausal women with spontaneous fractures (SF; age range, 25–35 years; Ob.S/BS values range, 9.88–18.56) were analyzed. All had sustained multiple, spontaneous fractures despite having normal BMD (spine BMD value range, 0.934–1.178). Moreover, an exhaustive biochemical evaluation had excluded any secondary cause of osteoporosis and fractures. Conditions such as osteogenesis imperfecta and Marfan’s syndrome were also considered and excluded. All biopsy specimens were selected from cases on file under an IRB-approved protocol. Because this is an intriguing group, some typical values ranges of the biochemical analyses are listed in Table 1.
Table 1.
Range of Values of Biochemical Analyses in Patients of the SF Group
| Parameter | Value range |
|---|---|
| Serum calcium | 8.9–10.1 mg/dl |
| Serum phosphate | 3.1–4.2 mg/dl |
| Total Alkaline phosphatase | 56–89 U/liter |
| Creatinine | 0.7–0.8 mg/dl |
| Intact PTH | 18.64–38.2 pg/ml |
| 25-Hydroxyvitamin D | 19–41 ng/dl |
| 1,25D | 28–55 pg/ml |
All values were within normal range.
All tissues were fixed in 70% ethanol, dehydrated through serial acetones, embedded in methyl methacrylate (PMMA), cut at ~4 μm thickness using a Jung Model K microtome (Heidelberg, Germany), placed onto BaF2 FTIR windows, and stained while on the window with von Kossa counterstained with neutral red, following the procedures published elsewhere.(19)
The data obtained in this study were compared against the corresponding values obtained in iliac crest biopsy specimens from iliac crest biopsy specimens from 14 “normal” patients (NL; age range, 51–70 years; 6 males, 8 females), under appropriate IRB-approved protocols, at equivalent anatomical locations at the microscopic level. Their “normal status” was defined based on the absence of fractures and BMD measurements (values range, 0.928–1.185), and their collagen cross-link ratio as a function of trabecular bone surface activity has been published previously.(18)
Methods
FTIRI spectral images were acquired on the BioRad (Cambridge, MA, USA) “Sting-Ray” system, consisting of a step-scan interferometer interfaced to a Mercury-Cadmium-Telluride (MCT) focal plane array detector imaged to the focal plane of an IR microscope. Interferograms were simultaneously collected from each element of the 64 × 64 array to provide 4096 spectra (~4-minute scan time) at a spectral resolution of 8 cm−1. Each spectral image corresponds to an area of 400 × 400 μm2, and each spectrum corresponds to an area of ~6.3 × 6.3 μm2.(18,20–22) Background imaging spectra were collected at identical conditions with only the BaF2 windows. A digital video camera (Panasonic, Tokyo, Japan) attached to the microscope allowed the acquisition of pictures of the areas under spectroscopic analysis.
Trabeculae in each section were selected for FTIRI analysis based on the presence of osteoid at the surface as determined by the von Kossa stain counterstained with neutral red. After the FTIRI image acquisition, eight sequential FTIR spectra were extracted along a line originating adjacent to the trabecular surface and proceeding toward the trabecular geometrical center. The first spectrum in every spectral sequence was of the first 6.3 × 6.3-μm area adjacent to the trabecular surfaces where only PMMA was evident. The second spectrum in every spectral sequence was the adjacent 6.3 × 6.3-μm area where both PMMA and protein (amide I and II) spectral peaks were evident. Water vapor and PMMA spectral contributions were subtracted, and the amide I and II spectral regions were baseline corrected according to the standards published elsewhere.(23) The spectral curves were fit using a commercially available software package (Grams/32; Galactic Software, Salem, NH, USA). The initial position and type (Gaussian) of underlying bands that were input were determined through second derivative and difference spectroscopy. Once the curve-fitting process converged, the output of the analysis was expressed as peak position and relative percentage area.(17) Of the various underlying bands, the ratio of the relative areas of the peaks at ~1660 and 1690 cm−1 was calculated and plotted as a function of depth in the bone. This ratio has been shown to correspond to the pyridinium/reducible collagen cross-links ratio.(16–18)
Mean and SD values at equivalent anatomical positions were compared using Bonferroni statistical test (p < 0.05).
RESULTS
Figure 1 shows the spatial variation in the pyridinium/reducible collagen cross-links at bone-forming trabecular surfaces as a function of anatomical distance from the osteoid’s outer edge. The data presented in open symbols are from the subjects with HTOP and LTOP. Previously reported data from normal (closed symbols) subjects at equivalent anatomical locations(18) are included for purposes of comparison. In all cases, equivalent loci data were averaged for each group, and SD was plotted as error bars. The first, most superficial, point consisted only of a PMMA peak, and the second point had amide I and II peaks without a peak at ~1660 cm−1 (representative of pyridinium collagen cross-links(16–18)). Significant differences (p < 0.01) exist between the three groups 14–28 and 40–50 μm beneath the trabecular surface, with HTOP and LTOP exhibiting higher ratios than normal at both locations. At 14 μm, the HTOP group (open circles) has significantly higher ratio values than the LTOP group (open triangles); both have higher values than the control group. At 21 μm, the values for the HTOP group fall below those of the LTOP group, but for both groups, the values remained significantly above normal. At 28 μm, HTOP values are the same as those of the NL group, whereas both normal and HTOP values are significantly below the LTOP group. Beyond this depth, the HTOP values increase again and become significantly higher than those for both the LTOP and NL groups.
FIG. 1.
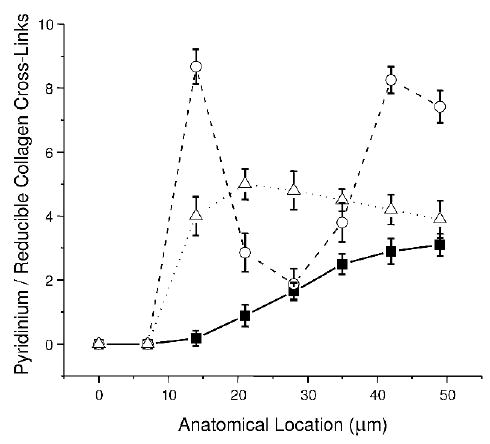
Spatial variation in the pyridinium/reducible collagen cross-links at bone-forming trabecular surfaces as a function of anatomical distance from the osteoid’s outer edge. The data presented in open symbols are from the subjects with HTOP (open circles) and LTOP (open upright triangles). Previously reported data from normal (solid squares) subjects at equivalent anatomical locations are included for purposes of comparison. In all cases, equivalent loci data were averaged for each group, and SD are plotted as error bars.
Figure 2 shows the comparison of the spatial variation in the pyridinium/reducible collagen cross-link ratio between the normal, LTOP (open triangles), and SF (open diamonds) groups. While the LTOP and SF group values are statistically indistinguishable, they are both higher than NL for the first 42 μm, after which all three groups exhibit statistically comparable values.
FIG. 2.
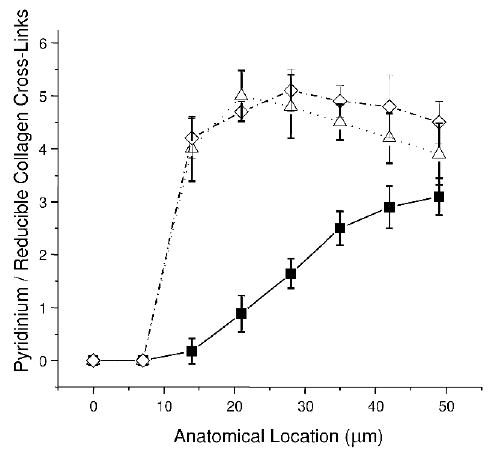
Comparison of the spatial variation in the pyridinium/reducible collagen cross-link ratio between the normal LTOP (open triangles) and premenopausal spontaneously fracturing (SF; open diamonds) patient groups.
DISCUSSION
In this study, the spatial distribution of the pyridinium/reducible collagen cross-link ratio was determined in thin tissue sections from iliac crest biopsy specimens of patients that had been diagnosed as either high- or low-turnover osteoporotics, as well as premenopausal women with normal BMD sustaining multiple spontaneous fractures. The data were compared with recently reported values encountered in normal bone at equivalent anatomical locations (bone forming trabecular surfaces). The results of this study show for the first time in human subjects that the pyridinium/reducible collagen cross-link ratio differs between normal subjects and patients with fragile bone, even when BMD values are normal.
Fractures, the clinical consequences of osteoporosis, result when bone mass is reduced below a level sufficient to maintain structural integrity. Tissue heterogeneity is a major complicating factor in studies of osteoporosis, many of which use bulk-type analyses of the bony tissues. One of the advantages of FTIR spectroscopic analysis is that it allows for the rapid analysis of thin tissue sections with a spatial resolution of ~6.3 μm, making it possible to examine discrete and anatomically equivalent points.
The organic matrix in osteoporosis has received considerably less attention than the bone mineral. However, accumulated evidence suggests that the matrix content in osteoporotic bone is decreased relative to age- and sex-matched controls and that biochemical alterations are apparent in the collagen molecules.(6–14) The intermolecular cross-linking of bone collagen is a chemical feature that is intimately related to the way matrix collagen molecules are arranged in fibrils(15) and provides fibrillar matrices with important mechanical properties such as tensile strength and viscoelasticity.(24,25) The cross-link pattern is determined and influenced by many factors, including the level of lysine hydroxylation,(26) collagen turnover,(27) molecular packing structure,(28) and mineralization,(29) and has been shown to be specific to the type of tissue(15,30) rather than the type of collagen.
In this study, FTIRI was used to examine the cross-linking patterns in bone matrix at bone-forming trabecular surfaces, showing that distinctive differences in the collagen cross-link ratio (pyridinium/reducible) are in fact present. At formative trabecular surfaces of normal bone, the most superficial, that is, the “youngest,” tissue (at the first 6.3 × 6.3-μm measurement point) seemed to lack the mature Pyr cross-links.(18) This observation is consistent with what is known about the maturation of collagen cross-links based on biochemical analyses.(29,30) As the tissue matures (as seen in the next and subsequent 6.3 × 6.3-μm measurement points), complex variations in the cross-link ratios are apparent.
In both the HTOP and LTOP samples, the values of the collagen cross-link ratios were higher than those obtained in the normal samples. This suggests that, in osteoporosis, processes affecting the collagen cross-link ratio in the osteoid matrix are altered, implying that, in addition to the well-established imbalance between formation and resorption seen in osteoporosis, the bone matrix that is produced in osteoporosis is also different from the bone matrix that is made in normal bone. The case of HTOP is similar to that of LTOP, if more dramatic and somewhat enigmatic, because the cross-link ratios become higher more rapidly than in either normal or LTOP samples. However, at ~30 μm from the surface, they become similar to those of normal samples and then again become higher than either the normal or LTOP samples. This variation, which indicates a deviation from the expected sequence of matrix “maturation,” is not readily explained but may become better defined with future knowledge of the mechanism of collagen maturation in these cases, as well as the effect of collagen polymorphisms.(31–50)
Just as intriguing is the data obtained in the SF group of patients. These young women, all under age 40, had normal BMD, serum chemistry, and lacked underlying conditions that might contribute to fractures, yet they spontaneously fractured. The type of analysis presented in this manuscript suggests an identical collagen cross-link profile with the one encountered in low-turnover osteoporotic patients. Whether this is the cause of the skeletal fragility or the result of improper bone repair cannot be determined from this data but importance of bone material properties, a component of bone quality, when considering bone fragility is emphasized.
In summary, FTIRI analysis of thin sections from human iliac crest biopsy specimens revealed differences in the spatial distribution of the pyridinium/reducible collagen cross-link ratio between normal and osteoporotic patients at forming trabecular surfaces. This may be because of the possibility that the matrix produced in osteoporosis matures at a faster rate than in normal bone matrix or the bone matrix of osteoporosis undergoes post-translational modification for a longer period of time than the bone matrix of normal bone, perhaps because of a delay or alteration in mineralization. The fact that similar trends were observed in spontaneously fracturing women with normal BMD accentuate the role of the matrix in determining bone strength and therefore fracture resistance.
As more information concerning details of the matrix is revealed by the use of techniques such as FTIR imaging, the contributing factors to bone fragility can be better understood, and therapeutic protocols can be developed that address issues concerning the quality of the matrix produced, not just its quantity.
Acknowledgments
This work was supported by NIH Grants AR046505 (to EPP) and AR46121 (Hospital for Special Surgery Musculoskeletal Core Center) and AR043125 (to ALB and RM).
Footnotes
The authors have no conflict of interest.
References
- 1.Boyce TM, Bloebaum RD. Cortical aging differences and fracture implications for the human femoral neck. Bone. 1993;14:769–778. doi: 10.1016/8756-3282(93)90209-s. [DOI] [PubMed] [Google Scholar]
- 2.Marshall D, Johnell O, Wedel H. Meta-analysis of how well measures of bone mineral density predict occurrence of osteoporotic fractures. BMJ. 1996;312:1254–1259. doi: 10.1136/bmj.312.7041.1254. [DOI] [PMC free article] [PubMed] [Google Scholar]
- 3.Cummings SR. Are patients with hip fractures more osteoporotic? Review of the evidence. Am J Med. 1985;78:487–494. doi: 10.1016/0002-9343(85)90343-2. [DOI] [PubMed] [Google Scholar]
- 4.McCreade RB, Goldstein AS. Biomechanics of fracture: Is bone mineral density sufficient to assess risk? J Bone Miner Res. 2000;15:2305–2308. doi: 10.1359/jbmr.2000.15.12.2305. [DOI] [PubMed] [Google Scholar]
- 5.Manolagas SC. Corticosteroids and fractures: A close encounter of the third cell kind. J Bone Miner Res. 2000;15:1001–1005. doi: 10.1359/jbmr.2000.15.6.1001. [DOI] [PubMed] [Google Scholar]
- 6.Dodds RA, Ferris BD 1987 Changes in orientation of non-collagenous bone matrix in osteoporosis. In: Christiansen C, Johansen JS, Riis BJ (eds.) Osteoporosis. Osteopress APS, Copenhagen, Denmark, pp. 309–312.
- 7.Oxlund H, Mosekilde L, Ortoff G 1987 Alterations in the stability of collagen from human trabecular bone with respect to age. In: Christiansen C, Johansen JS, Riis BJ (eds.) Osteoporosis. Osteopress APS, Copenhagen, Denmark, pp. 309–312.
- 8.Prockop DJ, Kivirikko KI. Collagens: Molecular biology, diseases, and potentials for therapy. Annu Rev Biochem. 1995;64:403–434. doi: 10.1146/annurev.bi.64.070195.002155. [DOI] [PubMed] [Google Scholar]
- 9.Shapiro JR, Burn VE, Chipman SD, Velis KP, Bansal M. Osteoporosis and familial idiopathic scoliosis: Association with an abnormal alpha 2(I) collagen. Connect Tissue Res. 1989;21:117–123. doi: 10.3109/03008208909050002. [DOI] [PubMed] [Google Scholar]
- 10.Spotila LD, Constantinou CD, Sereda L, Ganguly A, Riggs BL, Prockop DJ. Mutation in a gene for type I procollagen (COL1A2) in a woman with postmenopausal osteoporosis: Evidence for phenotypic and genotypic overlap with mild osteogenesis imperfecta. Proc Natl Acad Sci USA. 1991;88:5423–5427. doi: 10.1073/pnas.88.12.5423. [DOI] [PMC free article] [PubMed] [Google Scholar]
- 11.Bailey AJ, Wotton SF, Sims TJ, Thompson PW. Post-translational modifications in the collagen of human osteoporotic femoral head. Biochem Biophys Res Commun. 1992;185:801–805. doi: 10.1016/0006-291x(92)91697-o. [DOI] [PubMed] [Google Scholar]
- 12.Bailey AJ, Wotton SF, Sims TJ, Thompson PW. Biochemical changes in the collagen of human osteoporotic bone matrix. Connect Tissue Res. 1993;29:119–132. doi: 10.3109/03008209309014239. [DOI] [PubMed] [Google Scholar]
- 13.Kivirikko KI. Collagens and their abnormalities in a wide spectrum of diseases. Ann Med. 1993;25:113–126. doi: 10.3109/07853899309164153. [DOI] [PubMed] [Google Scholar]
- 14.Knott L, Whitehead CC, Fleming RH, Bailey AJ. Biochemical changes in the collagenous matrix of osteoporotic avian bone. Biochem J. 1995;310:1045–1051. doi: 10.1042/bj3101045. [DOI] [PMC free article] [PubMed] [Google Scholar]
- 15.Yamauchi M 1996 Collagen: The major matrix molecule in mineralized tissues. In: Anderson JJB, Garner SC (eds.) Calcium and Phosphorus in Health and Disease. CRC Press, New York, NY, USA, pp. 127–141.
- 16.Paschalis EP, Ilg A, Verdelis K, Yamauchi M, Mendelsohn R, Boskey AL. Spectroscopic determination of collagen cross-links at the ultrastructural level and its application to osteoporosis. Bone. 1998;23:S342. [Google Scholar]
- 17.Paschalis EP, Verdelis K, Mendelsohn R, Boskey A, Yamauchi M. Spectroscopic characterization of collagen cross-links in bone. J Bone Miner Res. 2001;16:1821–1828. doi: 10.1359/jbmr.2001.16.10.1821. [DOI] [PubMed] [Google Scholar]
- 18.Paschalis EP, Recker R, DiCarlo E, Doty SB, Atti E, Boskey AL. Distribution of collagen cross-links in normal human trabecular bone. J Bone Miner Res. 2003;18:1942–1946. doi: 10.1359/jbmr.2003.18.11.1942. [DOI] [PubMed] [Google Scholar]
- 19.Schenk RK, Olah AJ, Herrmann W 1984 Preparation of calcified tissues for light microscopy. In: Dickson GR (ed.) Methods of Calcified Tissue Preparation. Elsevier Press, Amsterdam, The Netherlands, pp. 1–56.
- 20.Paschalis EP, Burr DB, Mendelsohn R, Hock JM, Boskey AL. Bone mineral and collagen quality in humeri of ovariectomized cynomolgus monkeys given rhPTH(1–34) for 18 months. J Bone Miner Res. 2003;18:769–775. doi: 10.1359/jbmr.2003.18.4.769. [DOI] [PubMed] [Google Scholar]
- 21.Marcott C, Reeder RC, Paschalis EP, Tatakis DN, Boskey AL, Mendelsohn R. Infrared microspectroscopic imaging of biomineralized tissues using a mercury-cadmium-telluride focal-plane array detector. Cell Mol Biol (Noisy-le-grand) 1998;44:109–115. [PubMed] [Google Scholar]
- 22.Mendelsohn R, Paschalis EP, Boskey AL. Infrared spectroscopy, microscopy, and microscopic imaging of mineralizing tissues. Spectra-structure correlations from human iliac crest biopsies. J Biomed Opt. 1999;4:14–21. doi: 10.1117/1.429916. [DOI] [PubMed] [Google Scholar]
- 23.Dong A, Huang P, Caughey WS. Protein secondary structures in water from second-derivative amide I infrared spectra. Biochemistry. 1990;29:3303–3308. doi: 10.1021/bi00465a022. [DOI] [PubMed] [Google Scholar]
- 24.Yamauchi M, Young DR, Chandler GS, Mechanic GL. Cross-linking and new bone collagen synthesis in immobilized and recovering primate osteoporosis. Bone. 1988;9:415–418. doi: 10.1016/8756-3282(88)90124-x. [DOI] [PubMed] [Google Scholar]
- 25.Yamauchi M, Woodley DT, Mechanic GL. Aging and cross-linking of skin collagen. Biochem Biophys Res Commun. 1988;152:898–903. doi: 10.1016/s0006-291x(88)80124-4. [DOI] [PubMed] [Google Scholar]
- 26.Uzawa K, Grzesik WJ, Nishiura T, Kuznetsov SA, Robey PG, Brenner DA, Yamauchi M. Differential expression of human lysyl hydroxylase genes, lysine hydroxylation, and cross-linking of type I collagen during osteoblastic differentiation in vitro. J Bone Miner Res. 1999;14:1272–1280. doi: 10.1359/jbmr.1999.14.8.1272. [DOI] [PubMed] [Google Scholar]
- 27.Yamauchi M, Katz EP, Mechanic GL. Intermolecular cross-linking and stereospecific molecular packing inType I collagen fibrils of the periodontal ligament. Biochemistry. 1986;25:4907–4913. doi: 10.1021/bi00365a027. [DOI] [PubMed] [Google Scholar]
- 28.Mechanic GL, Katz EP, Henmi M, Noyes C, Yamauchi M. Locus of a histidine-based, stable trifunctional, helix to helix collagen cross-link: Stereospecific collagen structure of type I skin fibrils. Biochemistry. 1987;26:3500–3509. doi: 10.1021/bi00386a038. [DOI] [PubMed] [Google Scholar]
- 29.Otsubo K, Katz EP, Mechanic GL, Yamauchi M. The COOH terminal locus of free aldehyde in bone collagen: The loss of crosslinking connectivity with mineralization. Biochemistry. 1992;31:396–402. doi: 10.1021/bi00117a013. [DOI] [PubMed] [Google Scholar]
- 30.Eyre DR, Paz MA, Gallop PM. Cross-linking in collagen and elastin. Annu Rev Biochem. 1984;53:717–748. doi: 10.1146/annurev.bi.53.070184.003441. [DOI] [PubMed] [Google Scholar]
- 31.Mann V, Ralston SH. Meta-analysis of COL1A1 Sp1 polymorphism in relation to bone mineral density and osteoporotic fracture. Bone. 2003;32:711–717. doi: 10.1016/s8756-3282(03)00087-5. [DOI] [PubMed] [Google Scholar]
- 32.Ralston SH. Genetic control of susceptibility to osteoporosis. J Clin Endocrinol Metab. 2002;87:2460–2466. doi: 10.1210/jcem.87.6.8621. [DOI] [PubMed] [Google Scholar]
- 33.McGuigan FE, Ralston SH. Single nucleotide polymorphism detection: Allelic discrimination using TaqMan. Psychiatr Genet. 2002;12:133–136. doi: 10.1097/00041444-200209000-00003. [DOI] [PubMed] [Google Scholar]
- 34.Qureshi AM, McGuigan FE, Seymour DG, Hutchison JD, Reid DM, Ralston SH. Association between COLIA1 Sp1 alleles and femoral neck geometry. Calcif Tissue Int. 2001;69:67–72. doi: 10.1007/s002230010037. [DOI] [PubMed] [Google Scholar]
- 35.McGuigan FE, Armbrecht G, Smith R, Felsenberg D, Reid DM, Ralston SH. Prediction of osteoporotic fractures by bone densitometry and COLIA1 genotyping: A prospective, population-based study in men and women. Osteoporos Int. 2001;12:91–96. doi: 10.1007/s001980170139. [DOI] [PubMed] [Google Scholar]
- 36.Mann V, Hobson EE, Li B, Stewart TL, Grant SF, Robins SP, Aspden RM, Ralston SH. A COL1A1 Sp1 binding site polymorphism predisposes to osteoporotic fracture by affecting bone density and quality. J Clin Invest. 2001;107:899–907. doi: 10.1172/JCI10347. [DOI] [PMC free article] [PubMed] [Google Scholar]
- 37.MacDonald HM, McGuigan FA, New SA, Campbell MK, Golden MH, Ralston SH, Reid DM. COL1A1 Sp1 polymorphism predicts perimenopausal and early postmenopausal spinal bone loss. J Bone Miner Res. 2001;16:1634–1641. doi: 10.1359/jbmr.2001.16.9.1634. [DOI] [PubMed] [Google Scholar]
- 38.Hobson EE, Ralston SH. Role of genetic factors in the pathophysiology and management of osteoporosis. Clin Endocrinol (Oxf) 2001;54:1–9. doi: 10.1046/j.1365-2265.2001.01149.x. [DOI] [PubMed] [Google Scholar]
- 39.Ashford RU, Luchetti M, McCloskey EV, Gray RL, Pande KC, Dey A, Kayan K, Ralston SH, Kanis JA. Studies of bone density, quantitative ultrasound, and vertebral fractures in relation to collagen type I alpha 1 alleles in elderly women. Calcif Tissue Int. 2001;68:348–351. doi: 10.1007/s002230010010. [DOI] [PubMed] [Google Scholar]
- 40.Stewart TL, Ralston SH. Role of genetic factors in the pathogenesis of osteoporosis. J Endocrinol. 2000;166:235–245. doi: 10.1677/joe.0.1660235. [DOI] [PubMed] [Google Scholar]
- 41.McGuigan FE, Reid DM, Ralston SH. Susceptibility to osteoporotic fracture is determined by allelic variation at the Sp1 site, rather than other polymorphic sites at the COL1A1 locus. Osteoporos Int. 2000;11:338–343. doi: 10.1007/s001980070123. [DOI] [PubMed] [Google Scholar]
- 42.Heegaard A, Jorgensen HL, Vestergaard AW, Hassager C, Ralston SH. Lack of influence of collagen type Ialpha1 Sp1 binding site polymorphism on the rate of bone loss in a cohort of post-menopausal danish women followed for 18 years. Calcif Tissue Int. 2000;66:409–413. doi: 10.1007/s002230010083. [DOI] [PubMed] [Google Scholar]
- 43.Keen RW, Woodford-Richens KL, Grant SF, Ralston SH, Lanchbury JS, Spector TD. Association of polymorphism at the type I collagen (COL1A1) locus with reduced bone mineral density, increased fracture risk, and increased collagen turnover. Arthritis Rheum. 1999;42:285–290. doi: 10.1002/1529-0131(199902)42:2<285::AID-ANR10>3.0.CO;2-3. [DOI] [PubMed] [Google Scholar]
- 44.Uitterlinden AG, Burger H, Huang Q, Yue F, McGuigan FE, Grant SF, Hofman A, van Leeuwen JP, Pols HA, Ralston SH. Relation of alleles of the collagen type Ialpha1 gene to bone density and the risk of osteoporotic fractures in postmenopausal women. N Engl J Med. 1998;338:1016–1021. doi: 10.1056/NEJM199804093381502. [DOI] [PubMed] [Google Scholar]
- 45.Langdahl BL, Ralston SH, Grant SF, Eriksen EF. An Sp1 binding site polymorphism in the COLIA1 gene predicts osteoporotic fractures in both men and women. J Bone Miner Res. 1998;13:1384–1389. doi: 10.1359/jbmr.1998.13.9.1384. [DOI] [PubMed] [Google Scholar]
- 46.Garnero P, Borel O, Grant SF, Ralston SH, Delmas PD. Collagen Ialpha1 Sp1 polymorphism, bone mass, and bone turnover in healthy French premenopausal women: The OFELY study. J Bone Miner Res. 1998;13:813–817. doi: 10.1359/jbmr.1998.13.5.813. [DOI] [PubMed] [Google Scholar]
- 47.Beavan S, Prentice A, Dibba B, Yan L, Cooper C, Ralston SH. Polymorphism of the collagen type Ialpha1 gene and ethnic differences in hip-fracture rates. N Engl J Med. 1998;339:351–352. doi: 10.1056/NEJM199807303390517. [DOI] [PubMed] [Google Scholar]
- 48.Ralston SH. The genetics of osteoporosis. QJM. 1997;90:247–251. doi: 10.1093/qjmed/90.4.247. [DOI] [PubMed] [Google Scholar]
- 49.Eyre DR, Muir H. Collagen polymorphism: Two molecular species in pig intervertebral disc. FEBS Lett. 1974;42:192–196. doi: 10.1016/0014-5793(74)80783-0. [DOI] [PubMed] [Google Scholar]
- 50.Grant SF, Reid DM, Blake G, Herd R, Fogelman I, Ralston SH. Reduced bone density and osteoporosis associated with a polymorphic Sp1 binding site in the collagen type I alpha 1 gene. Nat Genet. 1996;14:203–205. doi: 10.1038/ng1096-203. [DOI] [PubMed] [Google Scholar]